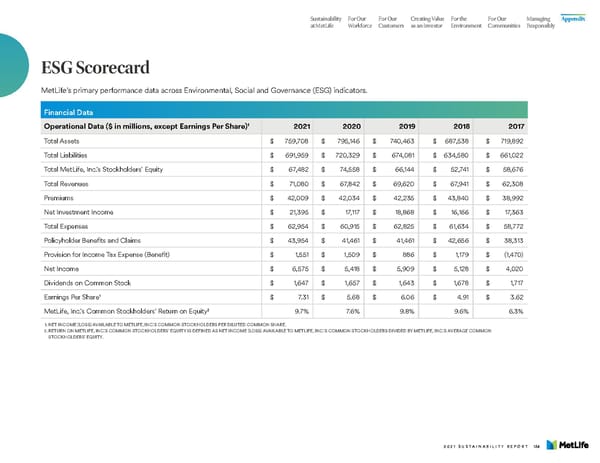
Sustainability For Our For Our Creating Value For the For Our Managing Appendix at MetLife Workforce Customers as an Investor Environment Communities Responsibly ESG Scorecard MetLife’s primary performance data across Environmental, Social and Governance (ESG) indicators. Financial Data 1 Operational Data ($ in millions, except Earnings Per Share) 2021 2020 2019 2018 2017 Total Assets $ 759,708 $ 795,146 $ 740,463 $ 687,538 $ 719,892 Total Liabilities $ 691,959 $ 720,329 $ 674,081 $ 634,580 $ 661,022 Total MetLife, Inc.’s Stockholders’ Equity $ 67,482 $ 74,558 $ 66,144 $ 52,741 $ 58,676 Total Revenues $ 71,080 $ 67,842 $ 69,620 $ 67,941 $ 62,308 Premiums $ 42,009 $ 42,034 $ 42,235 $ 43,840 $ 38,992 Net Investment Income $ 21,395 $ 17,117 $ 18,868 $ 16,166 $ 17,363 Total Expenses $ 62,954 $ 60,915 $ 62,825 $ 61,634 $ 58,772 Policyholder Benefits and Claims $ 43,954 $ 41,461 $ 41,461 $ 42,656 $ 38,313 Provision for Income Tax Expense (Benefit) $ 1,551 $ 1,509 $ 886 $ 1,179 $ (1,470) Net Income $ 6,575 $ 5,418 $ 5,909 $ 5,128 $ 4,020 Dividends on Common Stock $ 1,647 $ 1,657 $ 1,643 $ 1,678 $ 1,717 Earnings Per Share1 $ 7.31 $ 5.68 $ 6.06 $ 4.91 $ 3.62 2 MetLife, Inc.’s Common Stockholders’ Return on Equity 9.7% 7.6% 9.8% 9.6% 6.3% 1. NET INCOME (LOSS) AVAILABLE TO METLIFE, INC.’S COMMON STOCKHOLDERS PER DILUTED COMMON SHARE. 2. RETURN ON METLIFE, INC.’S COMMON STOCKHOLDERS’ EQUITY IS DEFINED AS NET INCOME (LOSS) AVAILABLE TO METLIFE, INC.’S COMMON STOCKHOLDERS DIVIDED BY METLIFE, INC.’S AVERAGE COMMON STOCKHOLDERS’ EQUITY. 2021 SUSTAINABILITY REPORT 134
 MetLife Sustainability Report Page 135 Page 137