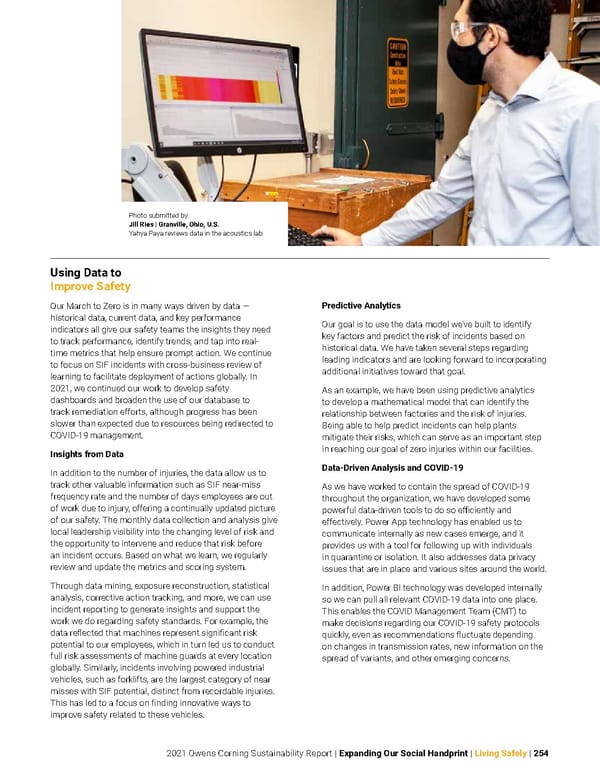
2021 Owens Corning Sustainability Report | Expanding Our Social Handprint | Living Safely | 254 Using Data to Improve Safety Our March to Zero is in many ways driven by data — historical data, current data, and key performance indicators all give our safety teams the insights they need to track performance, identify trends, and tap into real- time metrics that help ensure prompt action. We continue to focus on SIF incidents with cross-business review of learning to facilitate deployment of actions globally. In 2021, we continued our work to develop safety dashboards and broaden the use of our database to track remediation efforts, although progress has been slower than expected due to resources being redirected to COVID-19 management. Insights from Data In addition to the number of injuries, the data allow us to track other valuable information such as SIF near-miss frequency rate and the number of days employees are out of work due to injury, offering a continually updated picture of our safety. The monthly data collection and analysis give local leadership visibility into the changing level of risk and the opportunity to intervene and reduce that risk before an incident occurs. Based on what we learn, we regularly review and update the metrics and scoring system. Through data mining, exposure reconstruction, statistical analysis, corrective action tracking, and more, we can use incident reporting to generate insights and support the work we do regarding safety standards. For example, the data reflected that machines represent significant risk potential to our employees, which in turn led us to conduct full risk assessments of machine guards at every location globally. Similarly, incidents involving powered industrial vehicles, such as forklifts, are the largest category of near misses with SIF potential, distinct from recordable injuries. This has led to a focus on finding innovative ways to improve safety related to these vehicles. Predictive Analytics Our goal is to use the data model we’ve built to identify key factors and predict the risk of incidents based on historical data. We have taken several steps regarding leading indicators and are looking forward to incorporating additional initiatives toward that goal. As an example, we have been using predictive analytics to develop a mathematical model that can identify the relationship between factories and the risk of injuries. Being able to help predict incidents can help plants mitigate their risks, which can serve as an important step in reaching our goal of zero injuries within our facilities. Data-Driven Analysis and COVID-19 As we have worked to contain the spread of COVID-19 throughout the organization, we have developed some powerful data-driven tools to do so efficiently and effectively. Power App technology has enabled us to communicate internally as new cases emerge, and it provides us with a tool for following up with individuals in quarantine or isolation. It also addresses data privacy issues that are in place and various sites around the world. In addition, Power BI technology was developed internally so we can pull all relevant COVID-19 data into one place. This enables the COVID Management Team (CMT) to make decisions regarding our COVID-19 safety protocols quickly, even as recommendations fluctuate depending on changes in transmission rates, new information on the spread of variants, and other emerging concerns. Photo submitted by: Jill Ries | Granville, Ohio, U.S. Yahya Paya reviews data in the acoustics lab.
 Owens Corning Sustainability Report Page 253 Page 255