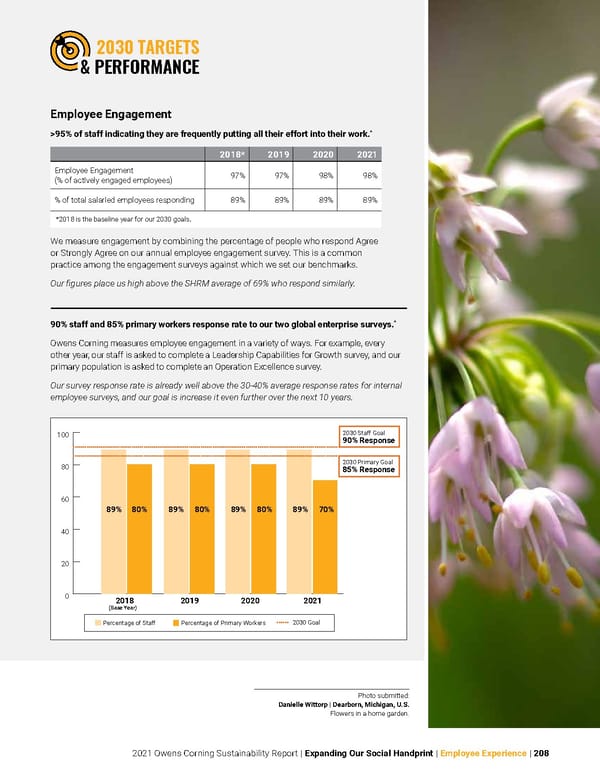
2021 Owens Corning Sustainability Report | Expanding Our Social Handprint | Employee Experience | 208 90% staff and 85% primary workers response rate to our two global enterprise surveys. ^ Owens Corning measures employee engagement in a variety of ways. For example, every other year, our staff is asked to complete a Leadership Capabilities for Growth survey, and our primary population is asked to complete an Operation Excellence survey. Our survey response rate is already well above the 30-40% average response rates for internal employee surveys, and our goal is increase it even further over the next 10 years. Employee Engagement >95% of staff indicating they are frequently putting all their effort into their work. ^ We measure engagement by combining the percentage of people who respond Agree or Strongly Agree on our annual employee engagement survey. This is a common practice among the engagement surveys against which we set our benchmarks. Our figures place us high above the SHRM average of 69% who respond similarly. 2018* 2019 2020 2021 Employee Engagement (% of actively engaged employees) 97% 97% 98% 98% % of total salaried employees responding 89% 89% 89% 89% *2018 is the baseline year for our 2030 goals . 2030 TARGETS & PERFORMANCE Photo submitted: Danielle Wittorp | Dearborn, Michigan, U.S. Flowers in a home garden. 0 20 40 60 80 100 2018 (Base Year ) 2019 2020 2021 2030 Goal Percentage of Prima ry W orkers Percentage of Staf f 2030 Staff Goal 90% Response 2030 Primary Goal 85% Response 89% 80% 89% 80% 89% 80% 89% 70%
 Owens Corning Sustainability Report Page 207 Page 209