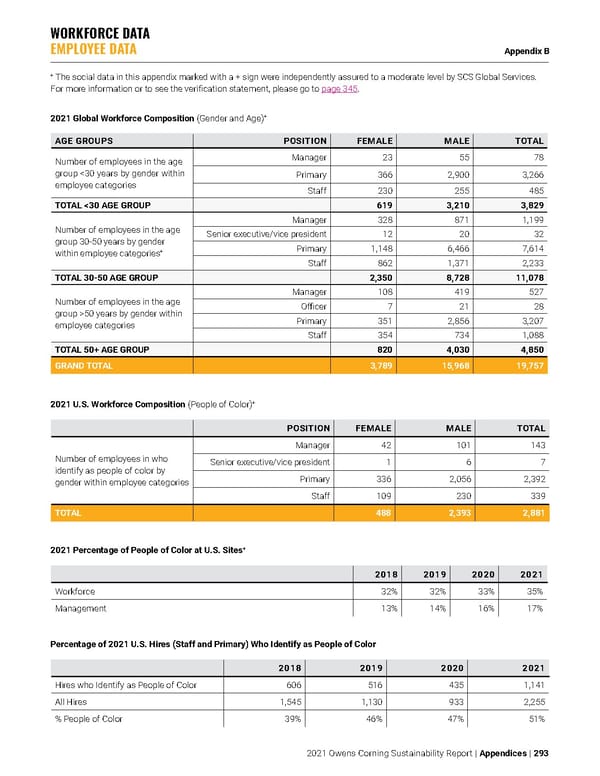
WORKFORCE DATA EMPLOYEE DATA Appendix B 2021 Owens Corning Sustainability Report | Appendices | 293 2021 Global Workforce Composition (Gender and Age) + 2021 U.S. Workforce Composition (People of Color) + POSITION FEMALE MALE TOTAL Number of employees in who identify as people of color by gender within employee categories Manager 42 101 143 Senior executive/vice president 1 6 7 Primary 336 2,056 2,392 Staff 109 230 339 TOTAL 488 2,393 2,881 2021 Percentage of People of Color at U.S. Sites + 2018 2019 2020 2021 Workforce 32% 32% 33% 35% Management 13% 14% 16% 17% Percentage of 2021 U.S. Hires (Staff and Primary) Who Identify as People of Color 2018 2019 2020 2021 Hires who Identify as People of Color 606 516 435 1,141 All Hires 1,545 1,130 933 2,255 % People of Color 39% 46% 47% 51% AGE GROUPS POSITION FEMALE MALE TOTAL Number of employees in the age group <30 years by gender within employee categories Manager 23 55 78 Primary 366 2,900 3,266 Staff 230 255 485 TOTAL <30 AGE GROUP 619 3,210 3,829 Number of employees in the age group 30-50 years by gender within employee categories + Manager 328 871 1,199 Senior executive/vice president 12 20 32 Primary 1,148 6,466 7,614 Staff 862 1,371 2,233 TOTAL 30-50 AGE GROUP 2,350 8,728 11,078 Number of employees in the age group >50 years by gender within employee categories Manager 108 419 527 Officer 7 21 28 Primary 351 2,856 3,207 Staff 354 734 1,088 TOTAL 50+ AGE GROUP 820 4,030 4,850 GRAND TOTAL 3,789 15,968 19,757 + The social data in this appendix marked with a + sign were independently assured to a moderate level by SCS Global Services. For more information or to see the verification statement, please go to page 345.
 Owens Corning Sustainability Report Page 292 Page 294