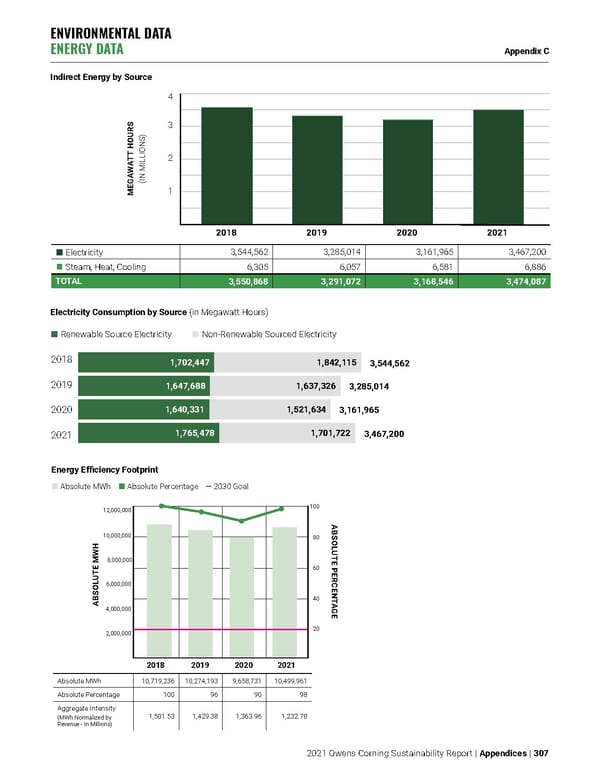
ENVIRONMENTAL DATA ENERGY DATA Appendix C 2021 Owens Corning Sustainability Report | Appendices | 307 Indirect Energy by Source Energy Efficiency Footprint Absolute MWh Absolute Percentage ― 2030 Goal Absolute MWh 10,719,236 10,274,193 9,658,731 10,499,961 Absolute Percentage 100 96 90 98 Aggregate Intensity (MWh Normalized by Revenue - In Millions) 1,501.53 1,429.38 1,363.96 1,232.78 ABSOLUTE MWH ABSOLUTE PERCENTAGE 20 40 60 80 100 12,000,000 10,000,000 8,000,000 6,000,000 4,000,000 2,000,000 2018 2019 2020 2021 Electricity 3,544,562 3,285,014 3,161,965 3,467,200 Steam, Heat, Cooling 6,305 6,057 6,581 6,886 TOTAL 3,550,868 3,291,072 3,168,546 3,474,087 Electricity Consumption by Source (in Megawatt Hours) Renewable Source Electricity Non-Renewable Sourced Electricity 2020 2019 2018 3,544,562 3,285,014 3,161,965 3,467,200 2021 1,842,115 1,637,326 1,521,634 1,701,722 1,702,447 1,647,688 1,640,331 1,765,478 2018 2019 2020 2021 MEGAWATT HOURS (IN MILLIONS) 4 3 2 1
 Owens Corning Sustainability Report Page 306 Page 308