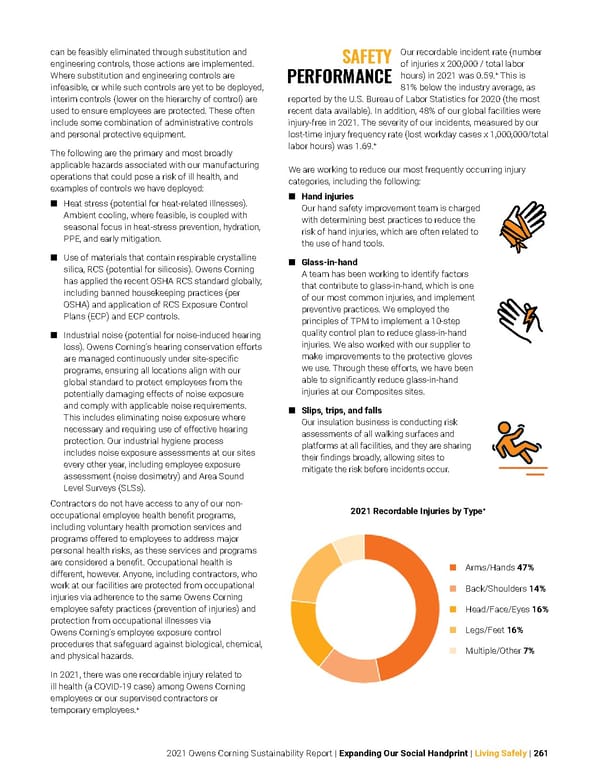
2021 Owens Corning Sustainability Report | Expanding Our Social Handprint | Living Safely | 261 Our recordable incident rate (number of injuries x 200,000 / total labor hours) in 2021 was 0.59. + This is 81% below the industry average, as reported by the U.S. Bureau of Labor Statistics for 2020 (the most recent data available). In addition, 48% of our global facilities were injury-free in 2021. The severity of our incidents, measured by our lost-time injury frequency rate (lost workday cases x 1,000,000/total labor hours) was 1.69. + We are working to reduce our most frequently occurring injury categories, including the following: ■ Hand injuries Our hand safety improvement team is charged with determining best practices to reduce the risk of hand injuries, which are often related to the use of hand tools. ■ Glass-in-hand A team has been working to identify factors that contribute to glass-in-hand, which is one of our most common injuries, and implement preventive practices. We employed the principles of TPM to implement a 10-step quality control plan to reduce glass-in-hand injuries. We also worked with our supplier to make improvements to the protective gloves we use. Through these efforts, we have been able to significantly reduce glass-in-hand injuries at our Composites sites. ■ Slips, trips, and falls Our insulation business is conducting risk assessments of all walking surfaces and platforms at all facilities, and they are sharing their findings broadly, allowing sites to mitigate the risk before incidents occur. can be feasibly eliminated through substitution and engineering controls, those actions are implemented. Where substitution and engineering controls are infeasible, or while such controls are yet to be deployed, interim controls (lower on the hierarchy of control) are used to ensure employees are protected. These often include some combination of administrative controls and personal protective equipment. The following are the primary and most broadly applicable hazards associated with our manufacturing operations that could pose a risk of ill health, and examples of controls we have deployed: ■ Heat stress (potential for heat-related illnesses). Ambient cooling, where feasible, is coupled with seasonal focus in heat-stress prevention, hydration, PPE, and early mitigation. ■ Use of materials that contain respirable crystalline silica, RCS (potential for silicosis). Owens Corning has applied the recent OSHA RCS standard globally, including banned housekeeping practices (per OSHA) and application of RCS Exposure Control Plans (ECP) and ECP controls. ■ Industrial noise (potential for noise-induced hearing loss). Owens Corning’s hearing conservation efforts are managed continuously under site-specific programs, ensuring all locations align with our global standard to protect employees from the potentially damaging effects of noise exposure and comply with applicable noise requirements. This includes eliminating noise exposure where necessary and requiring use of effective hearing protection. Our industrial hygiene process includes noise exposure assessments at our sites every other year, including employee exposure assessment (noise dosimetry) and Area Sound Level Surveys (SLSs). Contractors do not have access to any of our non- occupational employee health benefit programs, including voluntary health promotion services and programs offered to employees to address major personal health risks, as these services and programs are considered a benefit. Occupational health is different, however. Anyone, including contractors, who work at our facilities are protected from occupational injuries via adherence to the same Owens Corning employee safety practices (prevention of injuries) and protection from occupational illnesses via Owens Corning’s employee exposure control procedures that safeguard against biological, chemical, and physical hazards. In 2021, there was one recordable injury related to ill health (a COVID-19 case) among Owens Corning employees or our supervised contractors or temporary employees. + SAFETY PERFORMANCE Arms/Hands 47% Back/Shoulders 14% Head/Face/Eyes 16% Legs/Feet 16% Multiple/Other 7% 2021 Recordable Injuries by Type +
 Owens Corning Sustainability Report Page 260 Page 262