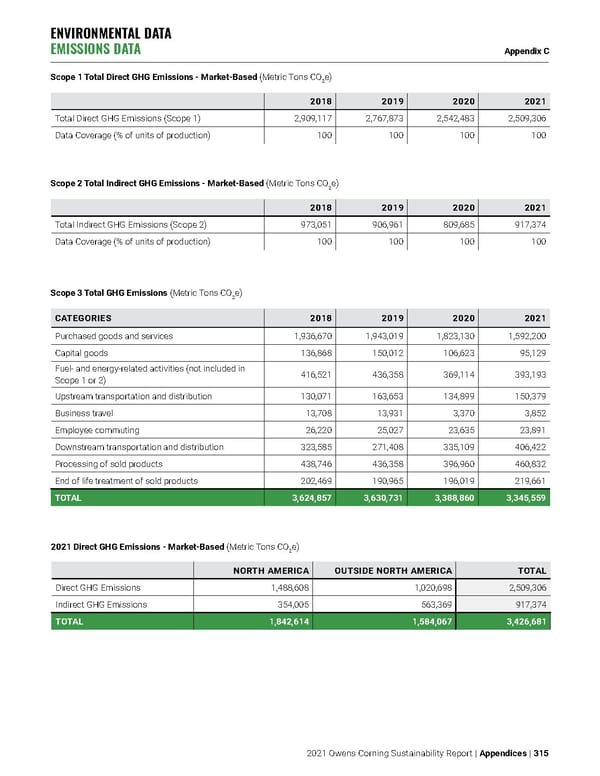
Scope 1 Total Direct GHG Emissions - Market-Based (Metric Tons CO 2 e) 2018 2019 2020 2021 Total Direct GHG Emissions (Scope 1) 2,909,117 2,767,873 2,542,483 2,509,306 Data Coverage (% of units of production) 100 100 100 100 Scope 3 Total GHG Emissions (Metric Tons CO 2 e) CATEGORIES 2018 2019 2020 2021 Purchased goods and services 1,936,670 1,943,019 1,823,130 1,592,200 Capital goods 136,868 150,012 106,623 95,129 Fuel- and energy-related activities (not included in Scope 1 or 2) 416,521 436,358 369,114 393,193 Upstream transportation and distribution 130,071 163,653 134,899 150,379 Business travel 13,708 13,931 3,370 3,852 Employee commuting 26,220 25,027 23,635 23,891 Downstream transportation and distribution 323,585 271,408 335,109 406,422 Processing of sold products 438,746 436,358 396,960 460,832 End of life treatment of sold products 202,469 190,965 196,019 219,661 TOTAL 3,624,857 3,630,731 3,388,860 3,345,559 Scope 2 Total Indirect GHG Emissions - Market-Based (Metric Tons CO 2 e) 2018 2019 2020 2021 Total Indirect GHG Emissions (Scope 2) 973,051 906,961 809,685 917,374 Data Coverage (% of units of production) 100 100 100 100 2021 Direct GHG Emissions - Market-Based (Metric Tons CO 2 e) NORTH AMERICA OUTSIDE NORTH AMERICA TOTAL Direct GHG Emissions 1,488,608 1,020,698 2,509,306 Indirect GHG Emissions 354,005 563,369 917,374 TOTAL 1,842,614 1,584,067 3,426,681 ENVIRONMENTAL DATA EMISSIONS DATA Appendix C 2021 Owens Corning Sustainability Report | Appendices | 315
 Owens Corning Sustainability Report Page 314 Page 316