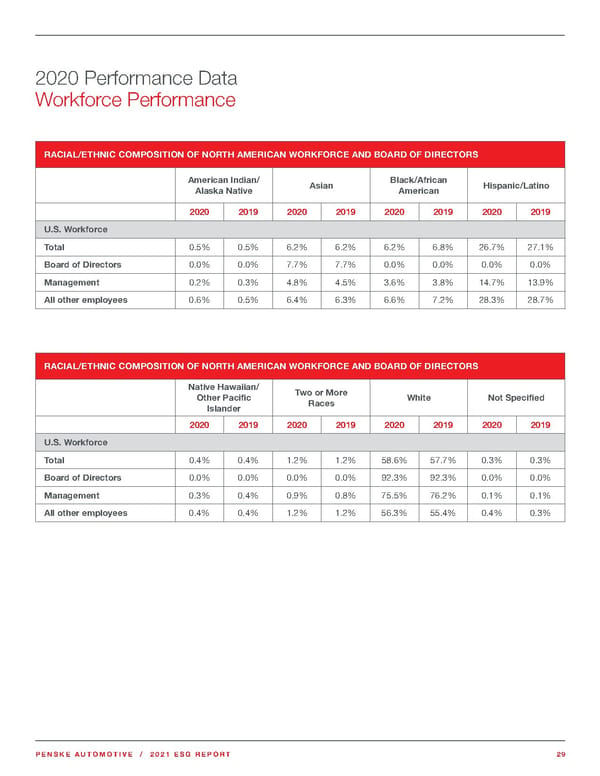
PENSKE AUTOMOTIVE / 2021 ESG REPORT 29 2020 Performance Data Workforce Performance RACIAL/ETHNIC COMPOSITION OF NORTH AMERICAN WORKFORCE AND BOARD OF DIRECTORS Native Hawaiian/ Other Pacific Islander Two or More Races White Not Specified 2020 2019 2020 2019 2020 2019 2020 2019 U.S. Workforce Total 0.4% 0.4% 1.2% 1.2% 58.6% 57.7% 0.3% 0.3% Board of Directors 0.0% 0.0% 0.0% 0.0% 92.3% 92.3% 0.0% 0.0% Management 0.3% 0.4% 0.9% 0.8% 75.5% 76.2% 0.1% 0.1% All other employees 0.4% 0.4% 1.2% 1.2% 56.3% 55.4% 0.4% 0.3% RACIAL/ETHNIC COMPOSITION OF NORTH AMERICAN WORKFORCE AND BOARD OF DIRECTORS American Indian/ Alaska Native Asian Black/African American Hispanic/Latino 2020 2019 2020 2019 2020 2019 2020 2019 U.S. Workforce Total 0.5% 0.5% 6.2% 6.2% 6.2% 6.8% 26.7% 27.1% Board of Directors 0.0% 0.0% 7.7% 7.7% 0.0% 0.0% 0.0% 0.0% Management 0.2% 0.3% 4.8% 4.5% 3.6% 3.8% 14.7% 13.9% All other employees 0.6% 0.5% 6.4% 6.3% 6.6% 7.2% 28.3% 28.7%
 Penske Automotive ESG Report Page 28 Page 30