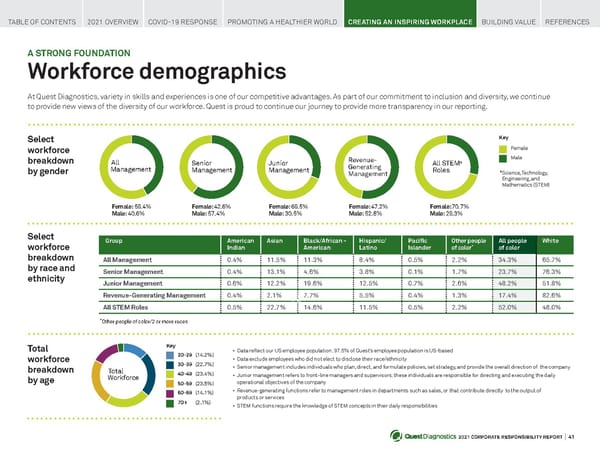
2021 CORPORATE RESPONSIBILITY REPORT I 41 A STRONG FOUNDATION Workforce demographics At Quest Diagnostics, variety in skills and experiences is one of our competitive advantages. As part of our commitment to inclusion and diversity, we continue to provide new views of the diversity of our workforce. Quest is proud to continue our journey to provide more transparency in our reporting. TABLE OF CONTENTS 2021 OVERVIEW COVID-19 RESPONSE PROMOTING A HEALTHIER WORLD CREATING AN INSPIRING WORKPLACE BUILDING VALUE REFERENCES Total workforce breakdown by age Group American Indian Asian Black/African - American Hispanic/ Latino Pacific Islander Other people of color * All people of color White All Management 0.4% 11.5% 11.3% 8.4% 0.5% 2.2% 34.3% 65.7% Senior Management 0.4% 13.1% 4.6% 3.8% 0.1% 1.7% 23.7% 76.3% Junior Management 0.6% 12.2% 19.6% 12.5% 0.7% 2.6% 48.2% 51.8% Revenue-Generating Management 0.4% 2.1% 7.7% 5.5% 0.4% 1.3% 17.4% 82.6% All STEM Roles 0.5% 22.7% 14.6% 11.5% 0.5% 2.2% 52.0% 48.0% Select workforce breakdown by race and ethnicity Select workforce breakdown by gender Male Key Female 29 + 71 + M 31 + 69 + M 60 + 40 + M 42 + 58 + M 53 + 47 + M All STEM a Roles Revenue- Generating Management Junior Management Senior Management All Management 20-29 (14.2%) Key 30-39 (22.7%) 40-49 (23.4%) 50-59 (23.5%) 60-69 (14.1%) 70+ (2.1%) • Data reflect our US employee population; 97.5% of Quest’s employee population is US-based • Data exclude employees who did not elect to disclose their race/ethnicity • Senior management includes individuals who plan, direct, and formulate policies, set strategy, and provide the overall direction of the company • Junior management refers to front-line managers and supervisors; these individuals are responsible for directing and executing the daily operational objectives of the company • Revenue-generating functions refer to management roles in departments such as sales, or that contribute directly to the output of products or services • STEM functions require the knowledge of STEM concepts in their daily responsibilities Female: 59.4% Male: 40.6% Female: 42.6% Male: 57.4% Female: 69.5% Male: 30.5% Female: 47.2% Male: 52.8% Female: 70.7% Male: 29.3% 13 + 23 + 23 + 24 + 14 + 3 + M Total Workforce * Other people of color/2 or more races a Science, Technology, Engineering, and Mathematics (STEM)
 Quest Diagnostics Corporate Responsibility Report Page 40 Page 42