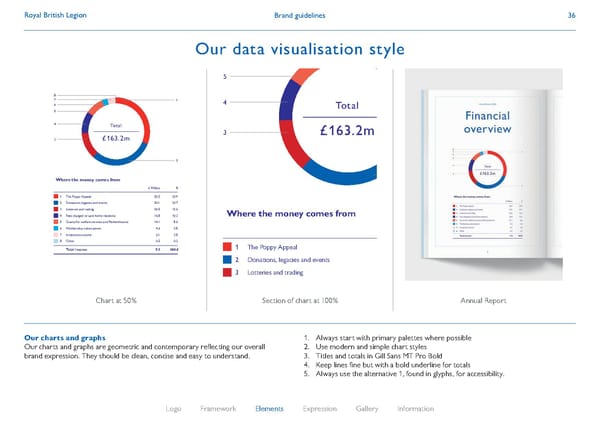
Brand guidelines Royal British Legion 36 Our charts and graphs Our charts and graphs are geometric and contemporary reflecting our overall brand expression. They should be clean, concise and easy to understand. 1. A lways start with primary palettes where possible 2. U se modern and simple chart styles 3. T itles and totals in Gill Sans MT Pro Bold 4. K eep lines fine but with a bold underline for totals 5. A lways use the alternative 1, found in glyphs, for accessibility. Chart at 50% Section of chart at 100% Annual Report 4 Financial overview Annual Report 2019 £ Million % 1 The Poppy Appeal 50.5 30.9 2 Donations, legacies and events 50.1 30.7 3 Lotteries and trading 20.5 12.6 4 Fees charged to care home residents 16.8 10.3 5 Grants for welfare services and Remembrance 14.1 8.6 6 Membership subscriptions 4.6 2.8 7 Investment income 6.1 3.8 8 Other 0.5 0.3 Total Income 9.5 100.0 Where the money comes from 8 7 1 2 6 5 4 3 Total £163.2m 5 Financial overview £ Million % 1 The National Memorial Arboretum development 6.4 67.4 2 Care homes and break centres 1.3 13.7 3 Improving IT Infrastructure 1.2 12.6 4 Other 0.6 6.3 Total Capital costs 9.5 100.0 Where the money goes to (Capital costs) 1 2 3 4 4 Financial overview Annual Report 2019 £ Million % 1 The Poppy Appeal 50.5 30.9 2 Donations, legacies and events 50.1 30.7 3 Lotteries and trading 20.5 12.6 4 Fees charged to care home residents 16.8 10.3 5 Grants for welfare services and Remembrance 14.1 8.6 6 Membership subscriptions 4.6 2.8 7 Investment income 6.1 3.8 8 Other 0.5 0.3 Total Income 9.5 100.0 Where the money comes from 8 7 1 2 6 5 4 3 Total £163.2m 5 Financial overview £ Million % 1 The National Memorial Arboretum development 6.4 67.4 2 Care homes and break centres 1.3 13.7 3 Improving IT Infrastructure 1.2 12.6 4 Other 0.6 6.3 Total Capital costs 9.5 100.0 Where the money goes to (Capital costs) 1 2 3 4 Logo Framework Elements Expression Gallery Information Our data visualisation style
 Royal British Legion Brand Book Page 35 Page 37