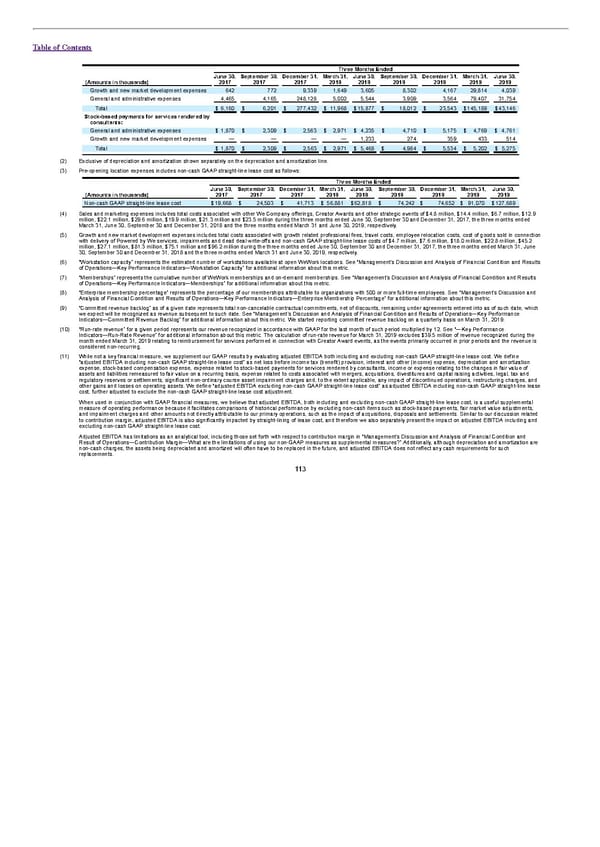
Table of Contents Three Months Ended June 30, September 30, December 31, March 31, June 30, September 30, December 31, March 31, June 30, (Amounts in thousands) 2017 2017 2017 2018 2018 2018 2018 2019 2019 Growth and new market development expenses 642 772 9,339 1,649 3,605 8,302 4,167 29,814 4,039 General and administrative expenses 4,465 4,165 248,128 5,002 5,544 3,909 3,564 79,407 31,754 Total $ 6,160 $ 6,201 $ 277,432 $ 11,968 $15,877 $ 18,012 $ 23,543 $145,189 $43,146 Stock-based payments for services rendered by consultants: General and administrative expenses $ 1,870 $ 2,309 $ 2,563 $ 2,971 $ 4,235 $ 4,710 $ 5,175 $ 4,769 $ 4,761 Growth and new market development expenses — — — — 1,233 274 359 433 514 Total $ 1,870 $ 2,309 $ 2,563 $ 2,971 $ 5,468 $ 4,984 $ 5,534 $ 5,202 $ 5,275 (2) Exclusive of depreciation and amortization shown separately on the depreciation and amortization line. (3) Pre-opening location expenses includes non-cash GAAP straight-line lease cost as follows: Three Months Ended June 30, September 30, December 31, March 31, June 30, September 30, December 31, March 31, June 30, (Amounts in thousands) 2017 2017 2017 2018 2018 2018 2018 2019 2019 Non-cash GAAP straight-line lease cost $19,668 $ 24,503 $ 41,713 $ 56,881 $62,818 $ 74,242 $ 74,652 $ 91,070 $127,689 (4) Sales and marketing expenses includes total costs associated with other We Company offerings, Creator Awards and other strategic events of $4.8 million, $14.4 million, $6.7 million, $12.9 million, $22.1 million, $29.6 million, $19.9 million, $21.3 million and $23.5 million during the three months ended June 30, September 30 and December 31, 2017, the three months ended March 31, June 30, September 30 and December 31, 2018 and the three months ended March 31 and June 30, 2019, respectively. (5) Growth and new market development expenses includes total costs associated with growth related professional fees, travel costs, employee relocation costs, cost of goods sold in connection with delivery of Powered by We services, impairments and dead deal write-offs and non-cash GAAP straight-line lease costs of $4.7 million, $7.6 million, $18.0 million, $22.8 million, $45.2 million, $27.1 million, $81.3 million, $75.1 million and $96.2 million during the three months ended June 30, September 30 and December 31, 2017, the three months ended March 31, June 30, September 30 and December 31, 2018 and the three months ended March 31 and June 30, 2019, respectively. (6) “Workstation capacity” represents the estimated number of workstations available at open WeWork locations. See “Management’s Discussion and Analysis of Financial Condition and Results of Operations—Key Performance Indicators—Workstation Capacity” for additional information about this metric. (7) “Memberships” represents the cumulative number of WeWork memberships and on-demand memberships. See “Management’s Discussion and Analysis of Financial Condition and Results of Operations—Key Performance Indicators—Memberships” for additional information about this metric. (8) “Enterprise membership percentage” represents the percentage of our memberships attributable to organizations with 500 or more full-time employees. See “Management’s Discussion and Analysis of Financial Condition and Results of Operations—Key Performance Indicators—Enterprise Membership Percentage” for additional information about this metric. (9) “Committed revenue backlog” as of a given date represents total non-cancelable contractual commitments, net of discounts, remaining under agreements entered into as of such date, which we expect will be recognized as revenue subsequent to such date. See “Management’s Discussion and Analysis of Financial Condition and Results of Operations—Key Performance Indicators—Committed Revenue Backlog” for additional information about this metric. We started reporting committed revenue backlog on a quarterly basis on March 31, 2019. (10) “Run-rate revenue” for a given period represents our revenue recognized in accordance with GAAP for the last month of such period multiplied by 12. See “—Key Performance Indicators—Run-Rate Revenue” for additional information about this metric. The calculation of run-rate revenue for March 31, 2019 excludes $39.5 million of revenue recognized during the month ended March 31, 2019 relating to reimbursement for services performed in connection with Creator Award events, as the events primarily occurred in prior periods and the revenue is considered non-recurring. (11) While not a key financial measure, we supplement our GAAP results by evaluating adjusted EBITDA both including and excluding non-cash GAAP straight-line lease cost. We define “adjusted EBITDA including non-cash GAAP straight-line lease cost” as net loss before income tax (benefit) provision, interest and other (income) expense, depreciation and amortization expense, stock-based compensation expense, expense related to stock-based payments for services rendered by consultants, income or expense relating to the changes in fair value of assets and liabilities remeasured to fair value on a recurring basis, expense related to costs associated with mergers, acquisitions, divestitures and capital raising activities, legal, tax and regulatory reserves or settlements, significant non-ordinary course asset impairment charges and, to the extent applicable, any impact of discontinued operations, restructuring charges, and other gains and losses on operating assets. We define “adjusted EBITDA excluding non-cash GAAP straight-line lease cost” as adjusted EBITDA including non-cash GAAP straight-line lease cost, further adjusted to exclude the non-cash GAAP straight-line lease cost adjustment. When used in conjunction with GAAP financial measures, we believe that adjusted EBITDA, both including and excluding non-cash GAAP straight-line lease cost, is a useful supplemental measure of operating performance because it facilitates comparisons of historical performance by excluding non-cash items such as stock-based payments, fair market value adjustments, and impairment charges and other amounts not directly attributable to our primary operations, such as the impact of acquisitions, disposals and settlements. Similar to our discussion related to contribution margin, adjusted EBITDA is also significantly impacted by straight-lining of lease cost, and therefore we also separately present the impact on adjusted EBITDA including and excluding non-cash GAAP straight-line lease cost. Adjusted EBITDA has limitations as an analytical tool, including those set forth with respect to contribution margin in “Management’s Discussion and Analysis of Financial Condition and Result of Operations—Contribution Margin—What are the limitations of using our non-GAAP measures as supplemental measures?” Additionally, although depreciation and amortization are non-cash charges, the assets being depreciated and amortized will often have to be replaced in the future, and adjusted EBITDA does not reflect any cash requirements for such replacements. 113
 S1 - WeWork Prospectus Page 117 Page 119