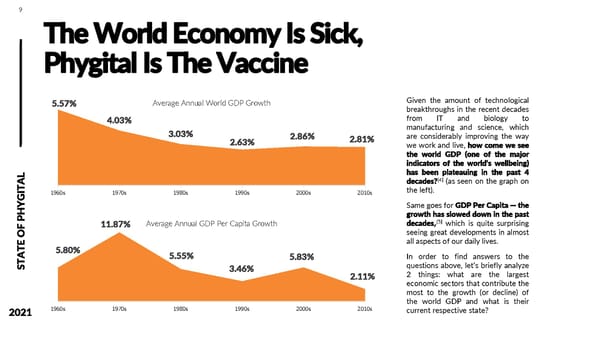
9 The World Economy Is Sick, Phygital Is The Vaccine 5.57% Average Annual World GDP Growth Given the amount of technological breakthroughs in the recent decades 4.03% from IT and biology to 3.03% manufacturing and science, which 2.63% 2.86% 2.81% are considerably improving the way weworkandlive, how come we see the world GDP (one of the major indicators of the world’s wellbeing) has been plateauing in the past 4 AL decades?[4] (as seen on the graph on 1960s 1970s 1980s 1990s 2000s 2010s the left). SamegoesforGDPPerCapita—the growth has slowed down in the past [5] 11.87% Average Annual GDP Per Capita Growth decades, which is quite surprising OF PHYGIT seeing great developments in almost E all aspects of our daily lives. AT 5.80% 5.55% 5.83% In order to find answers to the questions above, let’s briefly analyze ST 3.46% 2.11% 2 things: what are the largest economic sectors that contribute the most to the growth (or decline) of the world GDP and what is their 2021 1960s 1970s 1980s 1990s 2000s 2010s current respective state?
 State of Phygital Page 8 Page 10