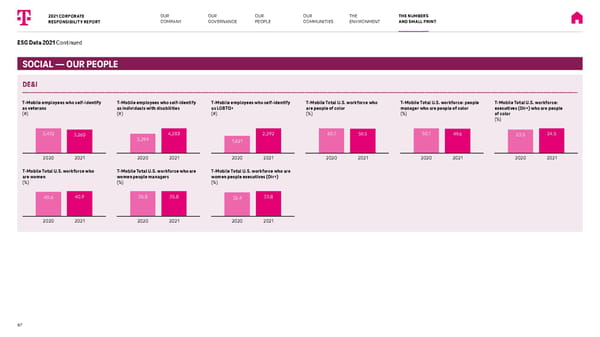
SOCIAL — OUR PEOPLE DE&I T-Mobile employees who self-identify as veterans (#) 3,432 2020 3,26 0 2021 T-Mobile employees who self-identify as individuals with disabilities (#) 3,294 2020 4,28 3 2021 T-Mobile employees who self-identify as LGBTQ+ (#) 1,621 2020 2,292 2021 T-Mobile Total U.S. workforce who are people of color (%) 6 0.1 2020 5 9. 5 2021 T-Mobile Total U.S. workforce: people manager who are people of color (%) 5 0.1 2020 49. 6 2021 T-Mobile Total U.S. workforce: executives (Dir+) who are people of color (%) 23.5 24.5 2020 2021 T-Mobile Total U.S. workforce who are women (%) 40.6 2020 40.9 2021 T-Mobile Total U.S. workforce who are women people managers (%) 35.8 2020 35.8 2021 T-Mobile Total U.S. workforce who are women people executives (Dir+) (%) 32.4 2020 33.8 2021 ESG Data 2021 Continued 2021 CORPORATE RESPONSIBILITY REPORT OUR PE OPLE OUR G OVERNANCE OUR C OMMUNITIES THE E NVIRONMENT THE NUMBERS A ND SMALL PRINT 67 OUR COMPANY
 T-Mobile Corporate Responsibility Report Page 66 Page 68