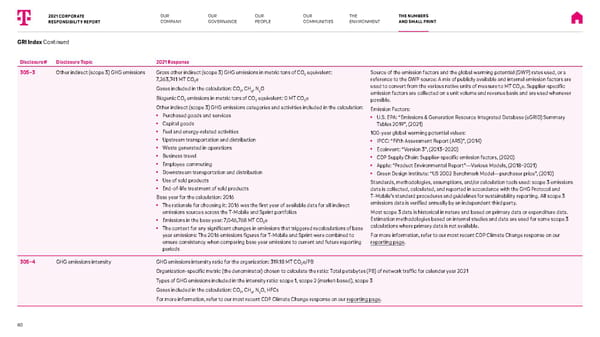
Disclosure# Disclosure Topic 2021 Response 305-3 Other indirect (scope 3) GHG emissions Gross other indirect (scope 3) GHG emissions in metric tons of CO 2 equivalent: 7,263,741 MT CO 2 e Gases included in the calculation: CO 2 , CH 4 , N 2 O Biogenic CO 2 emissions in metric tons of CO 2 equivalent: 0 MT CO 2 e Other indirect (scope 3) GHG emissions categories and activities included in the calculation: ■ Purchased goods and services ■ Capital goods ■ Fuel and energy-related activities ■ Upstream transportation and distribution ■ Waste generated in operations ■ Business travel ■ Employee commuting ■ Downstream transportation and distribution ■ Use of sold products ■ End-of-life treatment of sold products Base year for the calculation: 2016 ■ The rationale for choosing it: 2016 was the first year of available data for all indirect emissions sources across the T-Mobile and Sprint portfolios ■ Emissions in the base year: 7,046,768 MT CO 2 e ■ The context for any significant changes in emissions that triggered recalculations of base year emissions: The 2016 emissions figures for T-Mobile and Sprint were combined to ensure consistency when comparing base year emissions to current and future reporting periods Source of the emission factors and the global warming potential (GWP) rates used, or a reference to the GWP source: A mix of publicly available and internal emission factors are used to convert from the various native units of measure to MT CO 2 e. Supplier-specific emission factors are collected on a unit volume and revenue basis and are used whenever possible. Emission Factors: ■ U.S. EPA: “Emissions & Generation Resource Integrated Database (eGRID) Summary Tables 2019”, (2021) 100-year global warming potential values: ■ IPCC: “Fifth Assessment Report (AR5)”, (2014) ■ Ecoinvent: “Version 3”, (2013-2020) ■ CDP Supply Chain: Supplier-specific emission factors, (2020) ■ Apple: “Product Environmental Report”—Various Models, (2018-2021) ■ Green Design Institute: “US 2002 Benchmark Model—purchaser price”, (2010) Standards, methodologies, assumptions, and/or calculation tools used: scope 3 emissions data is collected, calculated, and reported in accordance with the GHG Protocol and T-Mobile’s standard procedures and guidelines for sustainability reporting. All scope 3 emissions data is verified annually by an independent third party. Most scope 3 data is historical in nature and based on primary data or expenditure data. Estimation methodologies based on internal studies and data are used for some scope 3 calculations where primary data is not available. For more information, refer to our most recent CDP Climate Change response on our reporting page . 305-4 GHG emissions intensity GHG emissions intensity ratio for the organization: 319.18 MT CO 2 e /PB Organization-specific metric (the denominator) chosen to calculate the ratio: Total petabytes (PB) of network traffic for calendar year 2021 Types of GHG emissions included in the intensity ratio: scope 1, scope 2 (market-based), scope 3 Gases included in the calculation: CO 2 , CH 4 , N 2 O , HFCs For more information, refer to our most recent CDP Climate Change response on our reporting page . GRI Index Continued 2021 CORPORATE RESPONSIBILITY REPORT OUR PEOPLE OUR GOVERNANCE OUR COMMUNITIES THE ENVIRONMENT THE NUMBERS AND SMALL PRINT 80 OUR COMPANY
 T-Mobile Corporate Responsibility Report Page 79 Page 81