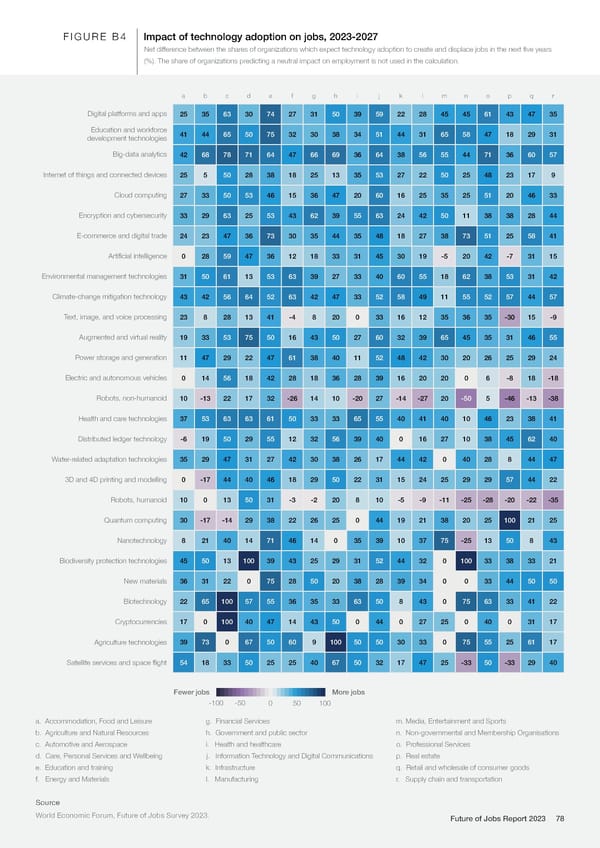
FIGURE B4 Impact of technology adoption on jobs, 2023-2027 Net difference between the shares of organizations which expect technology adoption to create and displace jobs in the next five years (%). The share of organizations predicting a neutral impact on employment is not used in the calculation. a b c d e f g h i j k l m n o p q r Digital platforms and apps 25 35 63 30 74 27 31 50 39 59 22 28 45 45 61 43 47 35 Education and workforce 41 44 65 50 75 32 30 38 34 51 44 31 65 58 47 18 29 31 development technologies Big-data analytics 42 68 78 71 64 47 66 69 36 64 38 56 55 44 71 36 60 57 Internet of things and connected devices 25 5 50 28 38 18 25 13 35 53 27 22 50 25 48 23 17 9 Cloud computing 27 33 50 53 46 15 36 47 20 60 16 25 35 25 51 20 46 33 Encryption and cybersecurity 33 29 63 25 53 43 62 39 55 63 24 42 50 11 38 38 28 44 E-commerce and digital trade 24 23 47 36 73 30 35 44 35 48 18 27 38 73 51 25 58 41 Artificial intelligence 0 28 59 47 36 12 18 33 31 45 30 19 -5 20 42 -7 31 15 Environmental management technologies 31 50 61 13 53 63 39 27 33 40 60 55 18 62 38 53 31 42 Climate-change mitigation technology 43 42 56 64 52 63 42 47 33 52 58 49 11 55 52 57 44 57 Text, image, and voice processing 23 8 28 13 41 -4 8 20 0 33 16 12 35 36 35 -30 15 -9 Augmented and virtual reality 19 33 53 75 50 16 43 50 27 60 32 39 65 45 35 31 46 55 Power storage and generation 11 47 29 22 47 61 38 40 11 52 48 42 30 20 26 25 29 24 Electric and autonomous vehicles 0 14 56 18 42 28 18 36 28 39 16 20 20 0 6 -8 18 -18 Robots, non-humanoid 10 -13 22 17 32 -26 14 10 -20 27 -14 -27 20 -50 5 -46 -13 -38 Health and care technologies 37 53 63 63 61 50 33 33 65 55 40 41 40 10 46 23 38 41 Distributed ledger technology -6 19 50 29 55 12 32 56 39 40 0 16 27 10 38 45 62 40 Water-related adaptation technologies 35 29 47 31 27 42 30 38 26 17 44 42 0 40 28 8 44 47 3D and 4D printing and modelling 0 -17 44 40 46 18 29 50 22 31 15 24 25 29 29 57 44 22 Robots, humanoid 10 0 13 50 31 -3 -2 20 8 10 -5 -9 -11 -25 -28 -20 -22 -35 Quantum computing 30 -17 -14 29 38 22 26 25 0 44 19 21 38 20 25 100 21 25 Nanotechnology 8 21 40 14 71 46 14 0 35 39 10 37 75 -25 13 50 8 43 Biodiversity protection technologies 45 50 13 100 39 43 25 29 31 52 44 32 0 100 33 38 33 21 New materials 36 31 22 0 75 28 50 20 38 28 39 34 0 0 33 44 50 50 Biotechnology 22 65 100 57 55 36 35 33 63 50 8 43 0 75 63 33 41 22 Cryptocurrencies 17 0 100 40 47 14 43 50 0 44 0 27 25 0 40 0 31 17 Agriculture technologies 39 73 0 67 50 60 9 100 50 50 30 33 0 75 55 25 61 17 Satellite services and space flight 54 18 33 50 25 25 40 67 50 32 17 47 25 -33 50 -33 29 40 Fewer jobs More jobs -100 -50 0 50 100 a. Accommodation, Food and Leisure g. Financial Services m. Media, Entertainment and Sports b. Agriculture and Natural Resources h. Government and public sector n. Non-governmental and Membership Organisations c. Automotive and Aerospace i. Health and healthcare o. Professional Services d. Care, Personal Services and Wellbeing j. Information Technology and Digital Communications p. Real estate e. Education and training k. Infrastructure q. Retail and wholesale of consumer goods f. Energy and Materials l. Manufacturing r. Supply chain and transportation Source World Economic Forum, Future of Jobs Survey 2023. Future of Jobs Report 2023 78
 The Future of Jobs Report 2023 Page 77 Page 79