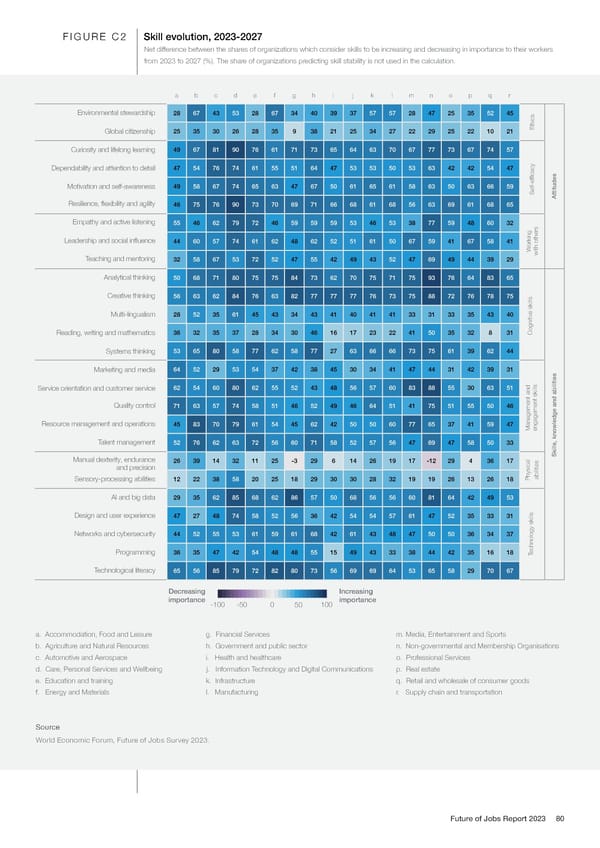
FIGURE C2 Skill evolution, 2023-2027 Net difference between the shares of organizations which consider skills to be increasing and decreasing in importance to their workers from 2023 to 2027 (%). The share of organizations predicting skill stability is not used in the calculation. a b c d e f g h i j k l m n o p q r Environmental stewardship 28 67 43 53 28 67 34 40 39 37 57 57 28 47 25 35 52 45 Global citizenship 25 35 30 26 28 35 9 38 21 25 34 27 22 29 25 22 10 21 Ethics Curiosity and lifelong learning 49 67 81 90 76 61 71 73 65 64 63 70 67 77 73 67 74 57 Dependability and attention to detail 47 54 76 74 61 55 51 64 47 53 53 50 53 63 42 42 54 47 ficacy Motivation and self-awareness 49 58 67 74 65 63 47 67 50 61 65 61 58 63 50 63 66 59 Self-ef Attitudes Resilience, flexibility and agility 46 75 76 90 73 70 69 71 66 68 61 68 56 63 69 61 68 65 Empathy and active listening 55 46 62 79 72 46 59 59 59 53 46 53 38 77 59 48 60 32 Leadership and social influence 44 60 57 74 61 62 48 62 52 51 61 50 67 59 41 67 58 41 orking W with others Teaching and mentoring 32 58 67 53 72 52 47 55 42 49 43 52 47 69 49 44 39 29 Analytical thinking 50 68 71 80 75 75 84 73 62 70 75 71 75 93 76 64 83 65 Creative thinking 56 63 62 84 76 63 82 77 77 77 76 73 75 88 72 76 78 75 Multi-lingualism 28 52 35 61 45 43 34 43 41 40 41 41 33 31 33 35 43 40 Reading, writing and mathematics 36 32 35 37 28 34 30 46 16 17 23 22 41 50 35 32 8 31 Cognitive skills Systems thinking 53 65 80 58 77 62 58 77 27 63 66 66 73 75 61 39 62 44 Marketing and media 64 52 29 53 54 37 42 38 45 30 34 41 47 44 31 42 39 31 Service orientation and customer service 62 54 60 80 62 55 52 43 48 56 57 60 83 88 55 30 63 51 Quality control 71 63 57 74 58 51 46 52 49 46 64 51 41 75 51 55 50 46 Resource management and operations 45 83 70 79 61 54 45 62 42 50 50 60 77 65 37 41 59 47 Management andengagement skills Talent management 52 76 62 63 72 56 60 71 58 52 57 56 47 69 47 58 50 33 Manual dexterity, endurance Skills, knowledge and abilities 26 39 14 32 11 25 -3 29 6 14 26 19 17 -12 29 4 36 17 and precision Sensory-processing abilities 12 22 38 58 20 25 18 29 30 30 28 32 19 19 26 13 26 18 Physicalabilities AI and big data 29 35 62 85 68 62 86 57 50 68 56 56 60 81 64 42 49 53 Design and user experience 47 27 48 74 58 52 56 36 42 54 54 57 61 47 52 35 33 31 Networks and cybersecurity 44 52 55 53 61 59 61 68 42 61 43 48 47 50 50 36 34 37 Programming 36 35 47 42 54 48 48 55 15 49 43 33 38 44 42 35 16 18 echnology skills T Technological literacy 65 56 85 79 72 82 80 73 56 69 69 64 53 65 58 29 70 67 Decreasing Increasing importance -100 -50 0 50 100 importance a. Accommodation, Food and Leisure g. Financial Services m. Media, Entertainment and Sports b. Agriculture and Natural Resources h. Government and public sector n. Non-governmental and Membership Organisations c. Automotive and Aerospace i. Health and healthcare o. Professional Services d. Care, Personal Services and Wellbeing j. Information Technology and Digital Communications p. Real estate e. Education and training k. Infrastructure q. Retail and wholesale of consumer goods f. Energy and Materials l. Manufacturing r. Supply chain and transportation Source World Economic Forum, Future of Jobs Survey 2023. Future of Jobs Report 2023 80
 The Future of Jobs Report 2023 Page 79 Page 81