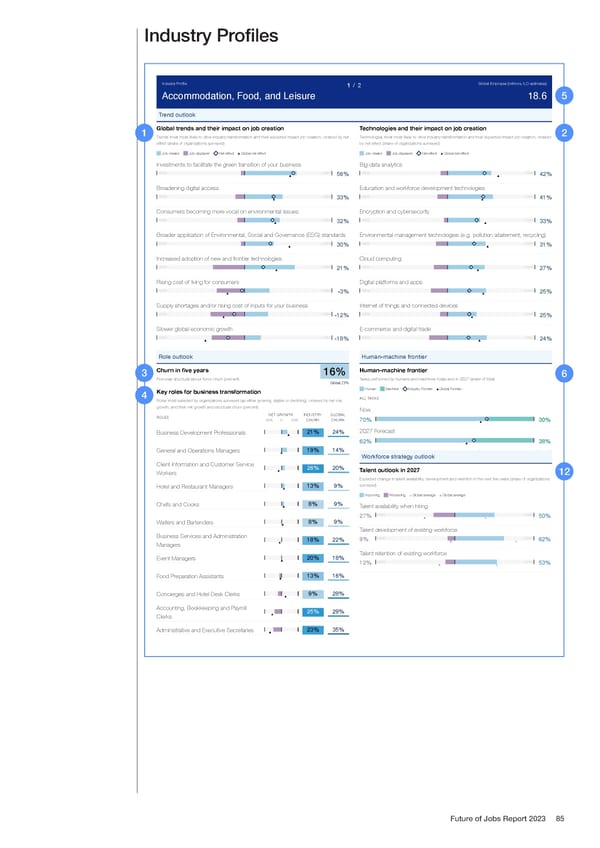
Industry Profiles Industry Profile Global Employee (millions, ILO estimates) 1 / 2 5 Accommodation, Food, and Leisure 18.6 Trend outlook 1 Global trends and their impact on job creation Technologies and their impact on job creation 2 Trends most most likely to drive industry transformation and their expected impact job creation, ordered by net Technologies most most likely to drive industry transformation and their expected impact job creation, ordered effect (share of organizations surveyed) by net effect (share of organizations surveyed) Job creator Job displacer Net effect Global net effect Job creator Job displacer Net effect Global net effect Investments to facilitate the green transition of your business Big-data analytics -100% +100% -100% +100% 56% 42% Broadening digital access Education and workforce development technologies -100% +100% -100% +100% 33% 41% Consumers becoming more vocal on environmental issues Encryption and cybersecurity -100% +100% -100% +100% 32% 33% Broader application of Environmental, Social and Governance (ESG) standards Environmental management technologies (e.g. pollution abatement, recycling) -100% +100% -100% +100% 30% 31% Increased adoption of new and frontier technologies Cloud computing -100% +100% -100% +100% 21% 27% Rising cost of living for consumers Digital platforms and apps -100% +100% -100% +100% -3% 25% Supply shortages and/or rising cost of inputs for your business Internet of things and connected devices -100% +100% -100% +100% -12% 25% Slower global economic growth E-commerce and digital trade -100% +100% -100% +100% -18% 24% Role outlook Human-machine frontier Human-machine frontier Churn in five years 3 16% 6 Five-year structural labour-force churn (percent) Tasks performed by humans and machines today and in 2027 (share of total) Global 23% Human Machine Industry Frontier Global Frontier 4 Key roles for business transformation ALL TASKS Roles most selected by organizations surveyed (as either growing, stable or declining), ordered by net role growth, and their net growth and structural churn (percent) Now NET GROWTH INDUSTRY GLOBAL ROLES -50% 0 50% CHURN CHURN 70% 30% 2027 Forecast 21% 24% Business Development Professionals 62% 38% 19% 14% General and Operations Managers Workforce strategy outlook Client Information and Customer Service 26% 20% Talent outlook in 2027 12 Workers Expected change in talent availability, development and retention in the next five years (share of organizations surveyed) 13% 9% Hotel and Restaurant Managers Improving Worsening Global average Global average 8% 9% Chefs and Cooks Talent availability when hiring -100% +100% 27% 50% 8% 9% Waiters and Bartenders Talent development of existing workforce Business Services and Administration -100% +100% 9% 62% 18% 22% Managers Talent retention of existing workforce 20% 18% Event Managers -100% +100% 12% 53% 13% 16% Food Preparation Assistants 9% 28% Concierges and Hotel Desk Clerks Accounting, Bookkeeping and Payroll 25% 29% Clerks 23% 35% Administrative and Executive Secretaries Future of Jobs Report 2023 85
 The Future of Jobs Report 2023 Page 84 Page 86