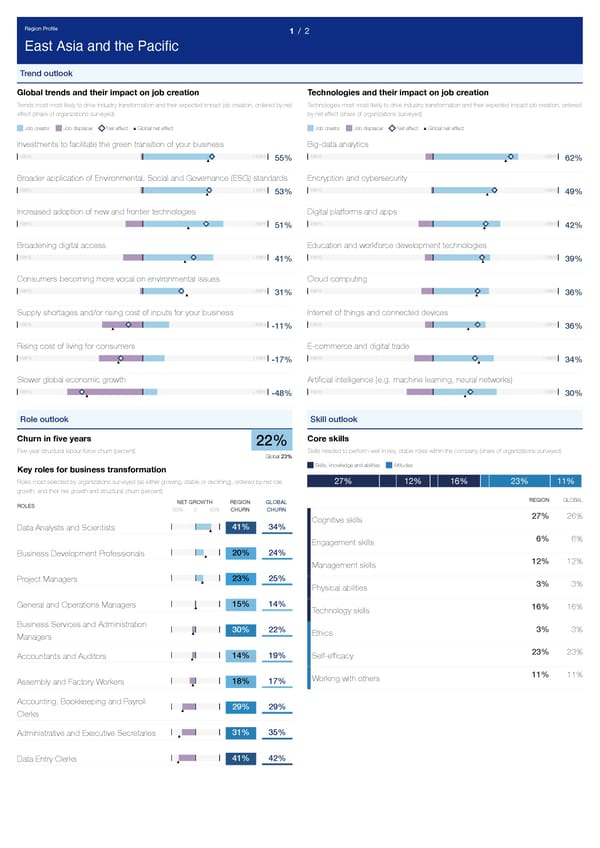
Region Profile 1 / 2 East Asia and the Pacific Trend outlook Global trends and their impact on job creation Technologies and their impact on job creation Trends most most likely to drive industry transformation and their expected impact job creation, ordered by net Technologies most most likely to drive industry transformation and their expected impact job creation, ordered effect (share of organizations surveyed) by net effect (share of organizations surveyed) Job creator Job displacer Net effect Global net effect Job creator Job displacer Net effect Global net effect Investments to facilitate the green transition of your business Big-data analytics -100% +100% -100% +100% 55% 62% Broader application of Environmental, Social and Governance (ESG) standards Encryption and cybersecurity -100% +100% -100% +100% 53% 49% Increased adoption of new and frontier technologies Digital platforms and apps -100% +100% -100% +100% 51% 42% Broadening digital access Education and workforce development technologies -100% +100% -100% +100% 41% 39% Consumers becoming more vocal on environmental issues Cloud computing -100% +100% -100% +100% 31% 36% Supply shortages and/or rising cost of inputs for your business Internet of things and connected devices -100% +100% -100% +100% -11% 36% Rising cost of living for consumers E-commerce and digital trade -100% +100% -100% +100% -17% 34% Slower global economic growth Artificial intelligence (e.g. machine learning, neural networks) -100% +100% -100% +100% -48% 30% Role outlook Skill outlook Churn in five years Core sRills 22% Five-year structural labour-force churn (percent) 6kills needed to perform well in key, stable roles within the company (share of organizations surveyed) Global 23% Skills, knowledge and abilities Attitudes Key roles for business transformation Roles most selected by organizations surveyed (as either growing, stable or declining), ordered by net role 27% 12% 16% 23% 11% growth, and their net growth and structural churn (percent) REGION GLOBAL NET GROWTH REGION GLOBAL ROLES -50% 0 50% CHURN CHURN 27% 26% Cognitive skills 41% 34% Data Analysts and Scientists 6% 6% Engagement skills 20% 24% Business Development Professionals 12% 12% Management skills 23% 25% Project Managers 3% 3% Physical abilities 15% 14% General and Operations Managers 16% 16% Technology skills Business Services and Administration 3% 3% 30% 22% Ethics Managers 23% 23% 14% 19% Self-efficacy Accountants and Auditors 11 % 11% Working with others 18% 17% Assembly and Factory Workers Accounting, Bookkeeping and Payroll 29% 29% Clerks 31% 35% Administrative and Executive Secretaries 41% 42% Data Entry Clerks
 The Future of Jobs Report 2023 Page 239 Page 241