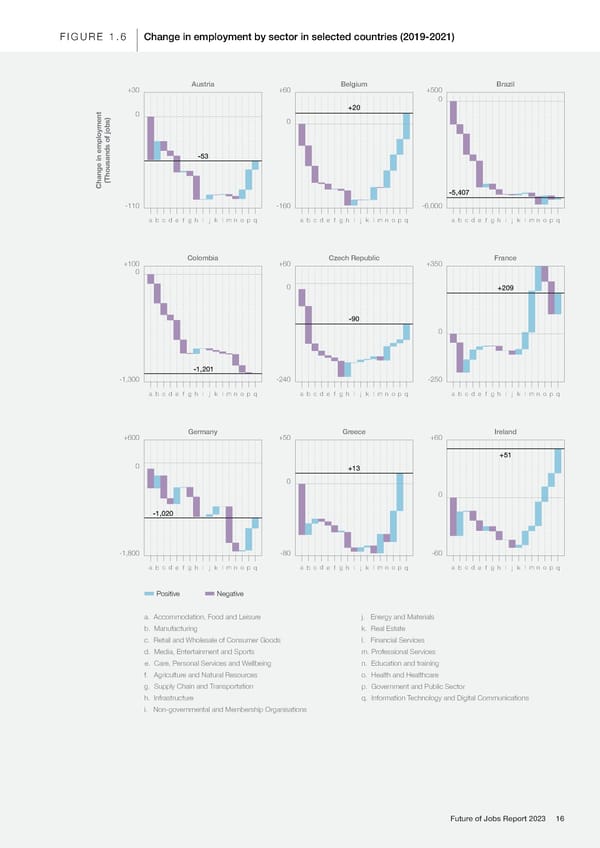
FIGURE 1.6 Change in employment by sector in selected countries (2019-2021) +30 Austria +60 Belgium +500 Brazil 0 +20 0 0 -53 (Thousands of jobs) Change in employment -5,407 -110 -160 -6,000 a b c d e f g h i j k l m n o p q a b c d e f g h i j k l m n o p q a b c d e f g h i j k l m n o p q +100 Colombia +60 Czech Republic +350 France 0 0 +209 -90 0 -1,201 -1,300 -240 -250 a b c d e f g h i j k l m n o p q a b c d e f g h i j k l m n o p q a b c d e f g h i j k l m n o p q +600 Germany +50 Greece +60 Ireland +51 0 +13 0 0 -1,020 -1,800 -80 -60 a b c d e f g h i j k l m n o p q a b c d e f g h i j k l m n o p q a b c d e f g h i j k l m n o p q Positive Negative a. Accommodation, Food and Leisure j. Energy and Materials b. Manufacturing k. Real Estate c. Retail and Wholesale of Consumer Goods l. Financial Services d. Media, Entertainment and Sports m. Professional Services e. Care, Personal Services and Wellbeing n. Education and training f. Agriculture and Natural Resources o. Health and Healthcare g. Supply Chain and Transportation p. Government and Public Sector h. Infrastructure q. Information Technology and Digital Communications i. Non-governmental and Membership Organisations Future of Jobs Report 2023 16
 The Future of Jobs Report 2023 Page 15 Page 17