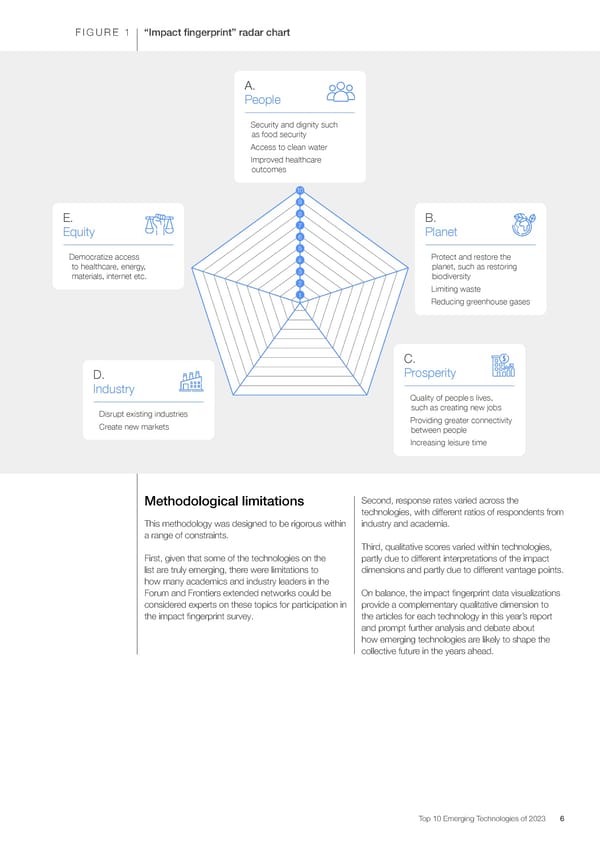
FIGURE 1 “Impact 昀椀ngerprint” radar chart A. People – Security and dignity such as food security – Access to clean water – Improved healthcare outcomes 10 9 E. 8 B. Equity 7 Planet 6 5 – Democratize access 4 – Protect and restore the to healthcare, energy, 3 planet, such as restoring materials, internet etc. biodiversity 2 – Limiting waste 1 – Reducing greenhouse gases C. D. Prosperity Industry – Quality of people’s lives, – Disrupt existing industries such as creating new jobs – Create new markets – Providing greater connectivity between people – Increasing leisure time Second, response rates varied across the Methodological limitations technologies, with different ratios of respondents from This methodology was designed to be rigorous within industry and academia. a range of constraints. Third, qualitative scores varied within technologies, First, given that some of the technologies on the partly due to different interpretations of the impact list are truly emerging, there were limitations to dimensions and partly due to different vantage points. how many academics and industry leaders in the Forum and Frontiers extended networks could be On balance, the impact 昀椀ngerprint data visualizations considered experts on these topics for participation in provide a complementary qualitative dimension to the impact 昀椀ngerprint survey. the articles for each technology in this year’s report and prompt further analysis and debate about how emerging technologies are likely to shape the collective future in the years ahead. Top 10 Emerging Technologies of 2023 6
 Top 10 Emerging Technologies of 2023 Page 5 Page 7