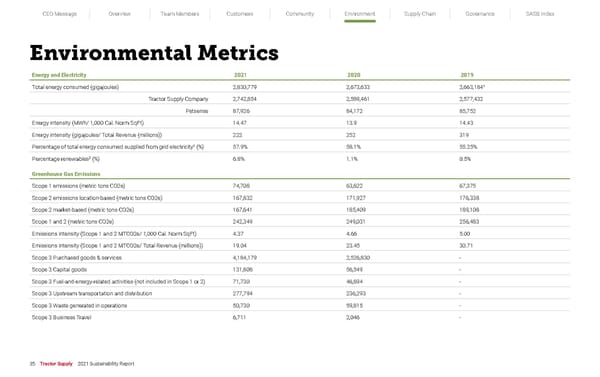
CEO Message Overview Team Members Customers Community Environment Supply Chain Governance SASB Index 35 Tractor Supply 2021 Sustainability Report Environmental Metrics Energy and Electricity 2021 2020 2019 Total energy consumed (gigajoules) 2,830,779 2,673,633 2,663,184 1 Tractor Supply Company 2,742,854 2,589,461 2,577,432 Petsense 87,926 84,172 85,752 Energy intensity (MWh/ 1,000 Cal. Norm SqFt) 14.47 13.9 14.43 Energy intensity (gigajoules/ Total Revenue (millions)) 222 252 319 Percentage of total energy consumed supplied from grid electricity 1 (%) 57.9% 58.1% 55.25% Percentage renewables 2 (%) 6.8% 1.1% 0.5% Greenhouse Gas Emissions Scope 1 emissions (metric tons CO2e) 74,708 63,622 67,375 Scope 2 emissions location-based (metric tons CO2e) 167,832 171,927 176,338 Scope 2 market-based (metric tons CO2e) 167,641 185,409 189,108 Scope 1 and 2 (metric tons CO2e) 242,349 249,031 256,483 Emissions intensity (Scope 1 and 2 MTCO2e/ 1,000 Cal. Norm SqFt) 4.37 4.66 5.00 Emissions intensity (Scope 1 and 2 MTCO2e/ Total Revenue (millions)) 19.04 23.45 30.71 Scope 3 Purchased goods & services 4,184,179 2,526,830 - Scope 3 Capital goods 131,808 56,549 - Scope 3 Fuel-and-energy-related activities (not included in Scope 1 or 2) 71,730 46,894 - Scope 3 Upstream transportation and distribution 277,794 236,293 - Scope 3 Waste generated in operations 50,730 59,815 - Scope 3 Business Travel 6,711 2,046 -
 Tractor Supply Sustainability Report Page 35 Page 37