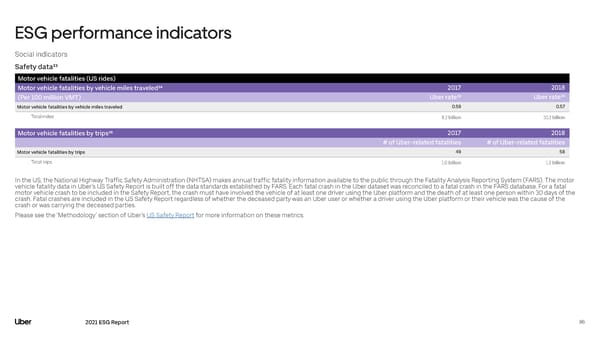
ESG performance indicators Social indicators Safety data³³ Motor vehicle fatalities (US rides) Motor vehicle fatalities by vehicle miles traveled³⁴ 2017 2018 (Per 100 million VMT) Uber rate³⁵ Uber rate³⁵ Motor vehicle fatalities by vehicle miles traveled 0.59 0.57 Total miles 8.2 billion 10.2 billion Motor vehicle fatalities by trips³⁶ 2017 2018 # of Uber-related fatalities # of Uber-related fatalities Motor vehicle fatalities by trips 49 58 Total trips 1.0 billion 1.3 billion In the US, the National Highway Traffic Safety Administration (NHTSA) makes annual traffic fatality information available to the public through the Fatality Analysis Reporting System (FARS). The motor vehicle fatality data in Uber’s US Safety Report is built off the data standards established by FARS. Each fatal crash in the Uber dataset was reconciled to a fatal crash in the FARS database. For a fatal motor vehicle crash to be included in the Safety Report, the crash must have involved the vehicle of at least one driver using the Uber platform and the death of at least one person within 30 days of the crash. Fatal crashes are included in the US Safety Report regardless of whether the deceased party was an Uber user or whether a driver using the Uber platform or their vehicle was the cause of the crash or was carrying the deceased parties. Please see the ‘Methodology’ section of Uber’s US Safety Report for more information on these metrics. 2021 ESG Report 86
 Uber ESG Report Page 85 Page 87