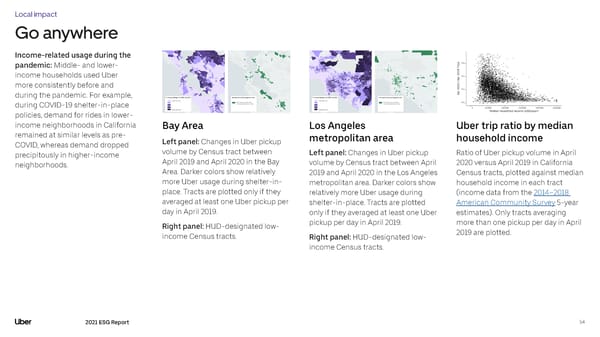
Local impact Go anywhere Income-related usage during the pandemic: Middle- and lower- income households used Uber more consistently before and during the pandemic. For example, during COVID-19 shelter-in-place policies, demand for rides in lower- income neighborhoods in California Bay Area Los Angeles Uber trip ratio by median remained at similar levels as pre- Left panel: Changes in Uber pickup metropolitan area household income COVID, whereas demand dropped volume by Census tract between precipitously in higher-income Left panel: Changes in Uber pickup Ratio of Uber pickup volume in April neighborhoods. April 2019 and April 2020 in the Bay volume by Census tract between April 2020 versus April 2019 in California Area. Darker colors show relatively 2019 and April 2020 in the Los Angeles Census tracts, plotted against median more Uber usage during shelter-in- metropolitan area. Darker colors show household income in each tract place. Tracts are plotted only if they relatively more Uber usage during (income data from the 2014–2018 averaged at least one Uber pickup per shelter-in-place. Tracts are plotted American Community Survey 5-year day in April 2019. only if they averaged at least one Uber estimates). Only tracts averaging Right panel: HUD-designated low- pickup per day in April 2019. more than one pickup per day in April income Census tracts. Right panel: HUD-designated low- 2019 are plotted. income Census tracts. 2021 ESG Report 54
 Uber ESG Report Page 53 Page 55