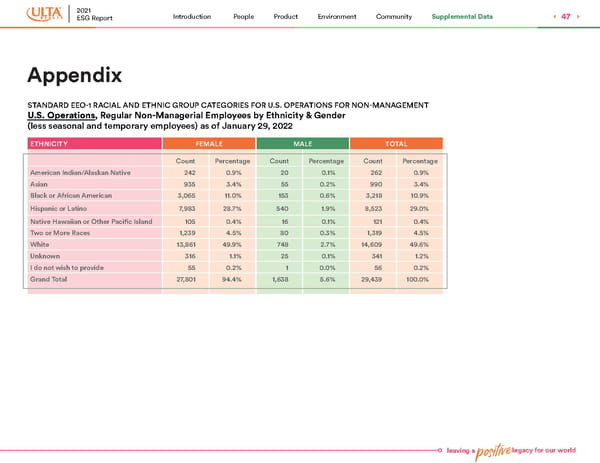
leaving a positive legacy for our world ETHNICITY FEMALE MALE TOTAL Count Percentage Count Percentage Count Percentage American Indian/Alaskan Native 242 0.9% 20 0.1% 262 0.9% Asian 935 3.4% 55 0.2% 990 3.4% Black or African American 3,065 11.0% 153 0.6% 3,218 10.9% Hispanic or Latino 7, 9 8 3 28.7% 540 1.9% 8,523 29.0% Native Hawaiian or Other Pacific Island 105 0.4% 16 0.1% 121 0.4% Two or More Races 1,239 4.5% 80 0.3% 1,319 4.5% White 13,861 49.9% 748 2.7% 14,609 49.6% Unknown 316 1.1% 25 0.1% 341 1.2% I do not wish to provide 55 0.2% 1 0.0% 56 0.2% Grand Total 2 7, 8 0 1 94.4% 1,638 5.6% 29,439 100.0% STANDARD EEO-1 RACIAL AND ETHNIC GROUP CATEGORIES FOR U.S. OPERATIONS FOR NON-MANAGEMENT U.S. Operations , Regular Non-Managerial Employees by Ethnicity & Gender (less seasonal and temporary employees) as of January 29, 2022 Appendix 2021 ESG Report 47 Supplemental Data Community Environment Product People Introduction
 Ulta Beauty ESG Report Page 47 Page 49