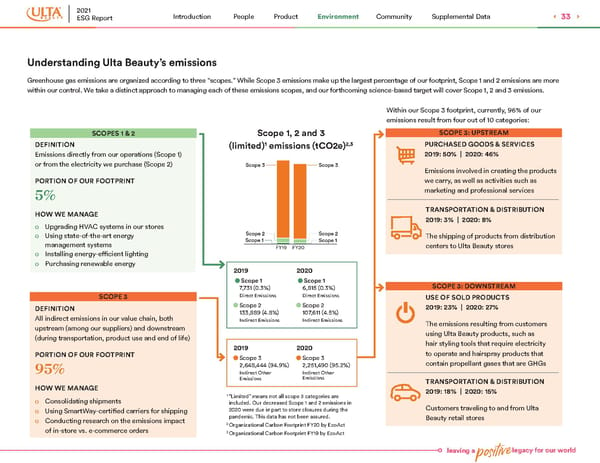
leaving a positive legacy for our world Understanding Ulta Beauty’s emissions Greenhouse gas emissions are organized according to three “scopes.” While Scope 3 emissions make up the largest percentage of our footprint, Scope 1 and 2 emissions are more within our control. We take a distinct approach to managing each of these emissions scopes, and our forthcoming science-based target will cover Scope 1, 2 and 3 emissions. SCOPES 1 & 2 DEFINITION Emissions directly from our operations (Scope 1) or from the electricity we purchase (Scope 2) PORTION OF OUR FOOTPRINT 5% HOW WE MA NAGE o Upgrading HVAC systems in our stores o Using state-of-the-art energy management systems o Installing energy-efficient lighting o Purchasing renewable energy DEFINITION All indirect emissions in our value chain, both upstream (among our suppliers) and downstream (during transportation, product use and end of life) PORTION OF OUR FOOTPRINT 95% HOW WE MA NAGE o Consolidating shipments o Using SmartWay-certified carriers for shipping o Conducting research on the emissions impact of in-store vs. e-commerce orders SCOPE 3 Within our Scope 3 footprint, currently, 96% of our emissions result from four out of 10 categories: SCOPE 3: UPSTREAM TRANSPORTATION & DISTRIBUTION 2019: 3% | 2020: 8% The shipping of products from distribution centers to Ulta Beauty stores PURCHASED GOODS & SERVICES 2019: 50% | 2020: 46% Emissions involved in creating the products we carry, as well as activities such as marketing and professional services SCOPE 3: DOWNSTREAM TRANSPORTATION & DISTRIBUTION 2019: 18% | 2020: 15% Customers traveling to and from Ulta Beauty retail stores USE OF SOLD PRODUCTS 2019: 23% | 2020: 27% The emissions resulting from customers using Ulta Beauty products, such as hair styling tools that require electricity to operate and hairspray products that contain propellant gases that are GHGs 2019 Scope 1 7,731 (0.3%) Direct Emissions Scope 2 133,889 (4.8%) Indirect Emissions Scope 1, 2 and 3 (limited) 1 emissions (tCO2e) 2,3 2020 Scope 1 6,815 (0.3%) Direct Emissions Scope 2 107,611 (4.5%) Indirect Emissions 2019 Scope 3 2,648,444 (94.9%) Indirect Other Emissions 2020 Scope 3 2,251,490 (95.2%) Indirect Other Emissions 1 “Limited” means not all scope 3 categories are included. Our decreased Scope 1 and 2 emissions in 2020 were due in part to store closures during the pandemic. This data has not been assured. 2 Organizational Carbon Footprint FY20 by EcoAct 3 Organizational Carbon Footprint FY19 by EcoAct 2021 ESG Report 33 Environment Product People Introduction Supplemental Data Community
 Ulta Beauty ESG Report Page 33 Page 35