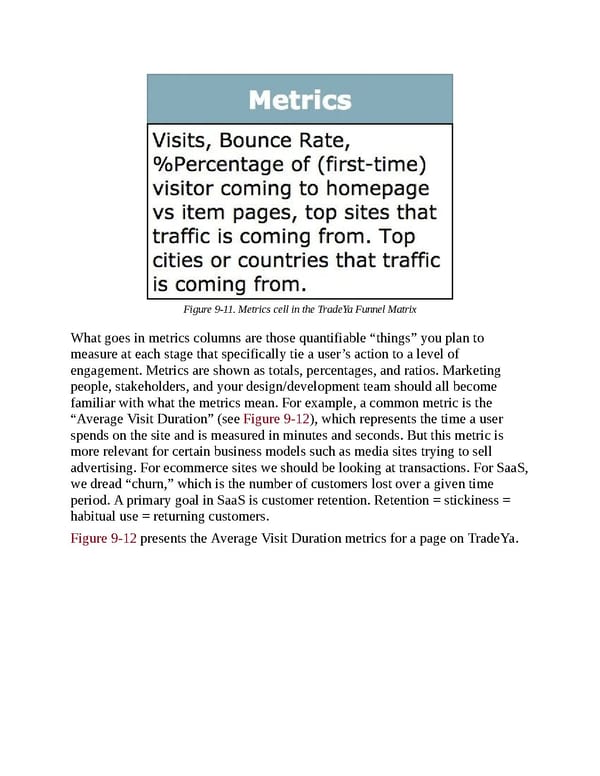
Figure 9-11. Metrics cell in the TradeYa Funnel Matrix What goes in metrics columns are those quantifiable “things” you plan to measure at each stage that specifically tie a user’s action to a level of engagement. Metrics are shown as totals, percentages, and ratios. Marketing people, stakeholders, and your design/development team should all become familiar with what the metrics mean. For example, a common metric is the “Average Visit Duration” (see Figure 9-12), which represents the time a user spends on the site and is measured in minutes and seconds. But this metric is more relevant for certain business models such as media sites trying to sell advertising. For ecommerce sites we should be looking at transactions. For SaaS, we dread “churn,” which is the number of customers lost over a given time period. A primary goal in SaaS is customer retention. Retention = stickiness = habitual use = returning customers. Figure 9-12 presents the Average Visit Duration metrics for a page on TradeYa.
 UX Strategy: How to Devise Innovative Digital Products that People Want Page 258 Page 260