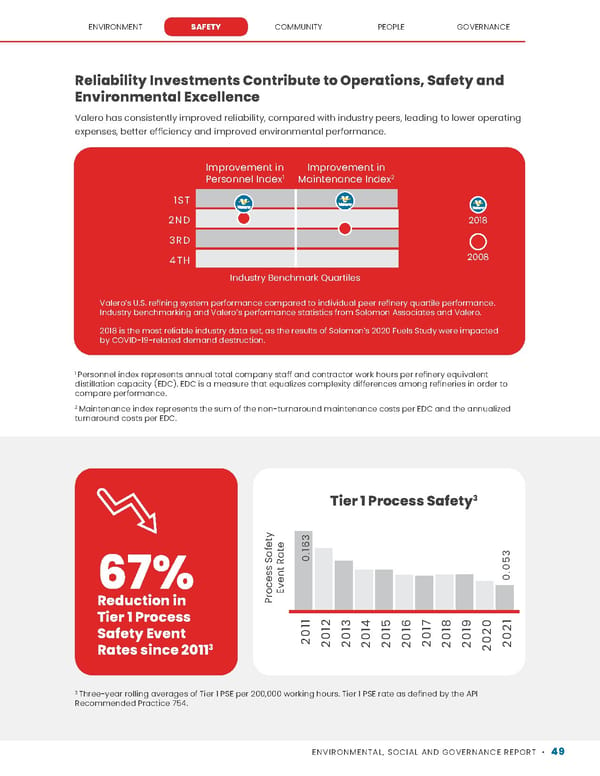
SAFETY COMMUNITY PEOPLE GOVERNANCE ENVIRONMENT ENVIRONMENTAL, SOCIAL AND GOVERNANCE REPORT • 49 Valero’s U.S. refining system performance compared to individual peer refinery quartile performance. Industry benchmarking and Valero’s performance statistics from Solomon Associates and Valero. 2018 is the most reliable industry data set, as the results of Solomon’s 2020 Fuels Study were impacted by COVID-19-related demand destruction. 1ST 2ND 3RD 4TH Improvement in Personnel Index 1 Improvement in Maintenance Index 2 Industry Benchmark Quartiles 2018 2008 1 Personnel index represents annual total company staff and contractor work hours per refinery equivalent distillation capacity (EDC). EDC is a measure that equalizes complexity differences among refineries in order to compare performance. 2 Maintenance index represents the sum of the non-turnaround maintenance costs per EDC and the annualized turnaround costs per EDC. Reliability Investments Contribute to Operations, Safety and Environmental Excellence Valero has consistently improved reliability, compared with industry peers, leading to lower operating expenses, better efficiency and improved environmental performance. 67% Reduction in Tier 1 Process Safety Event Rates since 2011 3 Tier 1 Process Safety 3 2011 2012 2013 2014 2015 2016 2017 2018 2019 2020 0.163 Process Safety Event Rate 2021 0.053 3 Three-year rolling averages of Tier 1 PSE per 200,000 working hours. Tier 1 PSE rate as defined by the API Recommended Practice 754.
 Valero ESG Report Page 48 Page 50