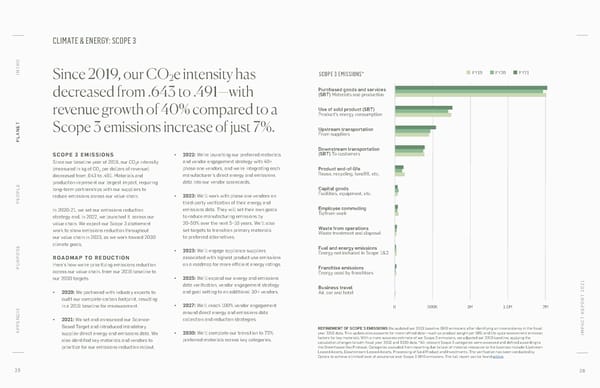
CLIMATE & ENERGY: SCOPE 3 O INTR Since 2019, our CO e intensity has SCOPE 3 EMISSIONS* FY19 FY20 FY21 2 Purchased goods and services decreased from .643 to .491—with (SB Materials and roduction revenue growth of 40% compared to a se of sold product (SB …roduct†s energy consution ANET Scope 3 emissions increase of just 7%. pstream transportation PL Fro suliers Downstream transportation SCOPE 3 EMISSIONS • 2022: We’re launching our preferred materials (SB o custoers Since our baseline year of 2019, our CO2e intensity and vendor engagement strategy with 40+ (measured in kg of CO per dollars of revenue) phase one vendors, and we’re integrating each Product end-of-life 2 manufacturer’s direct energy and emissions ƒeuse, recycling, landfill, etc. decreased from .643 to .491. Materials and production represent our largest impact, requiring data into our vendor scorecards. long-term partnerships with our suppliers to Capital goods OPLE reduce emissions across our value chain. • 2023: We’ll work with phase one vendors on Facilities, e‚uient, etc. PE third-party verification of their energy and In 2020-21, we set our emissions reduction emissions data. They will set their own goals Employee commuting strategy and, in 2022, we launched it across our to reduce manufacturing emissions by o fro or€ value chain. We expect our Scope 3 abatement 20-50% over the next 5–10 years. We’ll also Waste from operations work to show emissions reduction throughout set targets to transition primary materials aste treatent and disosal our value chain in 2023, as we work toward 2030 to preferred alternatives. climate goals. Fuel and energy emissions • 2023: We’ll engage appliance suppliers Energy not included in coe 12 ROADMAP TO REDUCTION associated with highest product use emissions PURPOSE Here’s how we’re prioritizing emissions reduction on a roadmap for more efficient energy ratings. Franchise emissions across our value chain, from our 2019 baseline to Energy used by franchises our 2030 targets. • 2025: We’ll expand our energy and emissions data verification, vendor engagement strategy Business travel • 2020: We partnered with industry experts to and goal setting to an additional 30+ vendors. Air, car and hotel T 2021 audit our complete carbon footprint, resulting in a 2019 baseline for measurement. • 2027: We’ll reach 100% vendor engagement 0 500K 1M 1.5M 2M around direct energy and emissions data T REPOR • 2021: We set and announced our Science- collection and reduction strategies. C Based Target and introduced mandatory REFINEMENT OF SCOPE 3 EMISSIONS We updated our 2019 baseline GHG emissions after identifying an inconsistency in the fiscal A APPENDIX supplier direct energy and emissions data. We • 2030: We’ll complete our transition to 75% year 2019 data. This update also accounts for more refined data—such as product weight per SKU and life cycle assessment emission IMP also identified key materials and vendors to preferred materials across key categories. factors for key materials. With a more accurate estimate of our Scope 3 emissions, we adjusted our 2019 baseline, applying the calculation changes to both fiscal year 2019 and 2020 data. *All relevant Scope 3 categories were assessed and defined according to prioritize for our emissions reduction rollout. the Greenhouse Gas Protocol. Categories excluded from reporting due to lack of material relevance to the business include: Upstream Leased Assets, Downstream Leased Assets, Processing of Sold Product and Investments. The verification has been conducted by Optera to achieve a limited level of assurance over Scope 3 GHG emissions. The full report can be found online. 25 26
 Williams-Sonoma, Inc - Impact Report Page 12 Page 14