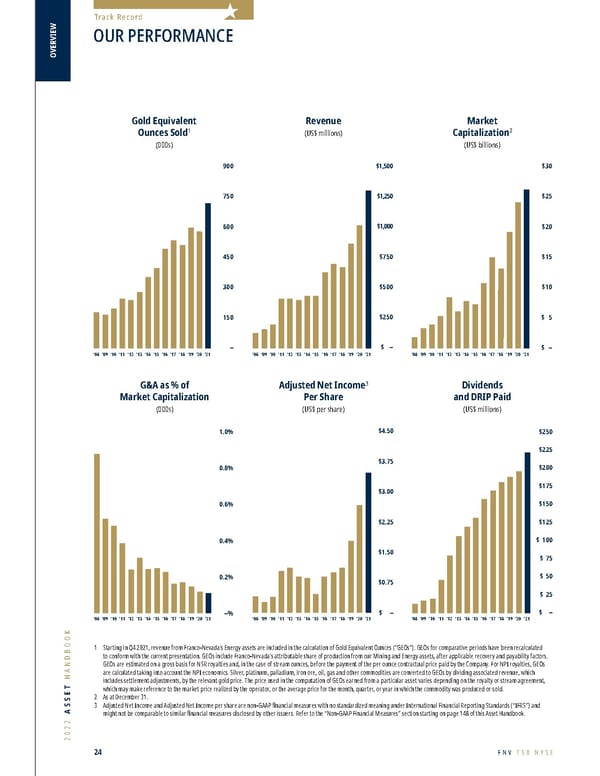
2022 ASSET HANDBOOK 24 FNV TSX NYSE OVERVIEW 1 Starting in Q4 2021, r evenue from Franco-Nevada’s Energy assets are included in the calculation of Gold Equivalent Ounces (“GEOs”). GEOs for comparative periods have been recalculated to conform with the current presentation. GEOs include Franco-Nevada’s attributable share of production from our Mining and Energy assets, after applicable recovery and payability factors. GEOs are estimated on a gross basis for NSR royalties and, in the case of stream ounces, before the payment of the per ounce contractual price paid by the Company. For NPI royalties, GEOs are calculated taking into account the NPI economics. Silver, platinum, palladium, iron ore, oil, gas and other commodities are converted to GEOs by dividing associated revenue, which includes settlement adjustments, by the relevant gold price. The price used in the computation of GEOs earned from a particular asset varies depending on the royalty or stream agreement, which may make reference to the market price realized by the operator, or the average price for the month, quarter, or year in which the commodity was produced or sold. 2 As at December 31. 3 Adjusted Net Income and Adjusted Net Income per shar e are non-GAAP financial measures with no standardized meaning under International Financial Reporting Standards (“IFRS”) and might not be comparable to similar financial measures disclosed by other issuers. Refer to the “Non-GAAP Financial Measures” section starting on page 148 of this Asset Handbook. Gold Equivalent Ounces Sold 1 (000s) Revenue (US$ millions) Market Capitalization 2 (US$ billions) Dividends & DRIP Paid Revenue G&A amended Adjusted Net income Per Share GEOs Market Cap 900 750 600 450 300 150 – ‘09 ‘13 ‘10 ‘11 ‘12 ‘08 ‘14 ‘15 ‘16 ‘17 ‘18 $1,500 $1,250 $1,000 $750 $500 $250 $ – ‘09 ‘13 ‘10 ‘11 ‘12 ‘08 ‘14 ‘15 ‘16 ‘17 ‘18 $30 $25 $20 $15 $10 $ 5 $ – ‘09 ‘13 ‘10 ‘11 ‘12 ‘08 ‘14 ‘15 ‘16 ‘17 ‘18 1.0% 0.8% 0.6% 0.4% 0.2% –% ‘09 ‘13 ‘10 ‘11 ‘12 ‘08 ‘14 ‘15 ‘16 ‘17 ‘18 $4.50 $3.75 $3.00 $2.25 $1.50 $0.75 $ – ‘09 ‘13 ‘10 ‘11 ‘12 ‘08 ‘14 ‘15 ‘16 ‘17 ‘18 ‘19 ‘19 ‘19 ‘19 ‘19 ‘20 ‘21 ‘20 ‘21 ‘20 ‘21 ‘20 ‘21 ‘20 ‘21 $250 $225 $200 $175 $150 $125 $ 100 $ 75 $ 50 $ 25 $ – ‘09 ‘13 ‘10 ‘11 ‘12 ‘08 ‘14 ‘15 ‘16 ‘17 ‘18 ‘19 ‘20 ‘21 Dividends & DRIP Paid Revenue G&A amended Adjusted Net income Per Share GEOs Market Cap 900 750 600 450 300 150 – ‘09 ‘13 ‘10 ‘11 ‘12 ‘08 ‘14 ‘15 ‘16 ‘17 ‘18 $1,500 $1,250 $1,000 $750 $500 $250 $ – ‘09 ‘13 ‘10 ‘11 ‘12 ‘08 ‘14 ‘15 ‘16 ‘17 ‘18 $30 $25 $20 $15 $10 $ 5 $ – ‘09 ‘13 ‘10 ‘11 ‘12 ‘08 ‘14 ‘15 ‘16 ‘17 ‘18 1.0% 0.8% 0.6% 0.4% 0.2% –% ‘09 ‘13 ‘10 ‘11 ‘12 ‘08 ‘14 ‘15 ‘16 ‘17 ‘18 $4.50 $3.75 $3.00 $2.25 $1.50 $0.75 $ – ‘09 ‘13 ‘10 ‘11 ‘12 ‘08 ‘14 ‘15 ‘16 ‘17 ‘18 ‘19 ‘19 ‘19 ‘19 ‘19 ‘20 ‘21 ‘20 ‘21 ‘20 ‘21 ‘20 ‘21 ‘20 ‘21 $250 $225 $200 $175 $150 $125 $ 100 $ 75 $ 50 $ 25 $ – ‘09 ‘13 ‘10 ‘11 ‘12 ‘08 ‘14 ‘15 ‘16 ‘17 ‘18 ‘19 ‘20 ‘21 Dividends & DRIP Paid Revenue G&A amended Adjusted Net income Per Share GEOs Market Cap 900 750 600 450 300 150 – ‘09 ‘13 ‘10 ‘11 ‘12 ‘08 ‘14 ‘15 ‘16 ‘17 ‘18 $1,500 $1,250 $1,000 $750 $500 $250 $ – ‘09 ‘13 ‘10 ‘11 ‘12 ‘08 ‘14 ‘15 ‘16 ‘17 ‘18 $30 $25 $20 $15 $10 $ 5 $ – ‘09 ‘13 ‘10 ‘11 ‘12 ‘08 ‘14 ‘15 ‘16 ‘17 ‘18 1.0% 0.8% 0.6% 0.4% 0.2% –% ‘09 ‘13 ‘10 ‘11 ‘12 ‘08 ‘14 ‘15 ‘16 ‘17 ‘18 $4.50 $3.75 $3.00 $2.25 $1.50 $0.75 $ – ‘09 ‘13 ‘10 ‘11 ‘12 ‘08 ‘14 ‘15 ‘16 ‘17 ‘18 ‘19 ‘19 ‘19 ‘19 ‘19 ‘20 ‘21 ‘20 ‘21 ‘20 ‘21 ‘20 ‘21 ‘20 ‘21 $250 $225 $200 $175 $150 $125 $ 100 $ 75 $ 50 $ 25 $ – ‘09 ‘13 ‘10 ‘11 ‘12 ‘08 ‘14 ‘15 ‘16 ‘17 ‘18 ‘19 ‘20 ‘21 G&A as % of Market Capitalization (000s) Adjusted Net Income 3 Per Share (US$ per share) Dividends and DRIP Paid (US$ millions) Dividends & DRIP Paid Revenue G&A amended Adjusted Net income Per Share GEOs Market Cap 900 750 600 450 300 150 – ‘09 ‘13 ‘10 ‘11 ‘12 ‘08 ‘14 ‘15 ‘16 ‘17 ‘18 $1,500 $1,250 $1,000 $750 $500 $250 $ – ‘09 ‘13 ‘10 ‘11 ‘12 ‘08 ‘14 ‘15 ‘16 ‘17 ‘18 $30 $25 $20 $15 $10 $ 5 $ – ‘09 ‘13 ‘10 ‘11 ‘12 ‘08 ‘14 ‘15 ‘16 ‘17 ‘18 1.0% 0.8% 0.6% 0.4% 0.2% –% ‘09 ‘13 ‘10 ‘11 ‘12 ‘08 ‘14 ‘15 ‘16 ‘17 ‘18 $4.50 $3.75 $3.00 $2.25 $1.50 $0.75 $ – ‘09 ‘13 ‘10 ‘11 ‘12 ‘08 ‘14 ‘15 ‘16 ‘17 ‘18 ‘19 ‘19 ‘19 ‘19 ‘19 ‘20 ‘21 ‘20 ‘21 ‘20 ‘21 ‘20 ‘21 ‘20 ‘21 $250 $225 $200 $175 $150 $125 $ 100 $ 75 $ 50 $ 25 $ – ‘09 ‘13 ‘10 ‘11 ‘12 ‘08 ‘14 ‘15 ‘16 ‘17 ‘18 ‘19 ‘20 ‘21 Dividends & DRIP Paid Revenue G&A amended Adjusted Net income Per Share GEOs Market Cap 900 750 600 450 300 150 – ‘09 ‘13 ‘10 ‘11 ‘12 ‘08 ‘14 ‘15 ‘16 ‘17 ‘18 $1,500 $1,250 $1,000 $750 $500 $250 $ – ‘09 ‘13 ‘10 ‘11 ‘12 ‘08 ‘14 ‘15 ‘16 ‘17 ‘18 $30 $25 $20 $15 $10 $ 5 $ – ‘09 ‘13 ‘10 ‘11 ‘12 ‘08 ‘14 ‘15 ‘16 ‘17 ‘18 1.0% 0.8% 0.6% 0.4% 0.2% –% ‘09 ‘13 ‘10 ‘11 ‘12 ‘08 ‘14 ‘15 ‘16 ‘17 ‘18 $4.50 $3.75 $3.00 $2.25 $1.50 $0.75 $ – ‘09 ‘13 ‘10 ‘11 ‘12 ‘08 ‘14 ‘15 ‘16 ‘17 ‘18 ‘19 ‘19 ‘19 ‘19 ‘19 ‘20 ‘21 ‘20 ‘21 ‘20 ‘21 ‘20 ‘21 ‘20 ‘21 $250 $225 $200 $175 $150 $125 $ 100 $ 75 $ 50 $ 25 $ – ‘09 ‘13 ‘10 ‘11 ‘12 ‘08 ‘14 ‘15 ‘16 ‘17 ‘18 ‘19 ‘20 ‘21 Dividends & DRIP Paid Revenue G&A amended Adjusted Net income Per Share GEOs Market Cap 900 750 600 450 300 150 – ‘09 ‘13 ‘10 ‘11 ‘12 ‘08 ‘14 ‘15 ‘16 ‘17 ‘18 $1,500 $1,250 $1,000 $750 $500 $250 $ – ‘09 ‘13 ‘10 ‘11 ‘12 ‘08 ‘14 ‘15 ‘16 ‘17 ‘18 $30 $25 $20 $15 $10 $ 5 $ – ‘09 ‘13 ‘10 ‘11 ‘12 ‘08 ‘14 ‘15 ‘16 ‘17 ‘18 1.0% 0.8% 0.6% 0.4% 0.2% –% ‘09 ‘13 ‘10 ‘11 ‘12 ‘08 ‘14 ‘15 ‘16 ‘17 ‘18 $4.50 $3.75 $3.00 $2.25 $1.50 $0.75 $ – ‘09 ‘13 ‘10 ‘11 ‘12 ‘08 ‘14 ‘15 ‘16 ‘17 ‘18 ‘19 ‘19 ‘19 ‘19 ‘19 ‘20 ‘21 ‘20 ‘21 ‘20 ‘21 ‘20 ‘21 ‘20 ‘21 $250 $225 $200 $175 $150 $125 $ 100 $ 75 $ 50 $ 25 $ – ‘09 ‘13 ‘10 ‘11 ‘12 ‘08 ‘14 ‘15 ‘16 ‘17 ‘18 ‘19 ‘20 ‘21 OUR PERFORMANCE Track Record
 Franco-Nevada 2022 Asset Handbook Page 23 Page 25