

Franco-Nevada 2022 Asset Handbook
2022 Asset Handbook
2 FNV TSX NYSE 2022 ASSET HANDBOOK Fr anco-Nevada Corporation’s 2022 Asset Handbook is intended to assist investors and analysts in their understanding of our business and portfolio of assets. Franco-Nevada Corporation is the leading gold-focused royalty and streaming company with the largest and most diversified portfolio of cash-flow producing assets. The Company’s business model provides investors with gold price and exploration optionality while limiting exposure to cost inflation. Franco-Nevada is debt-free and uses its free cash flow to expand its portfolio and pay dividends. It trades under the symbol FNV on both the Toronto and New York stock exchanges. Since its IPO, Franco-Nevada’s share price has outperformed the gold price and all relevant gold equity benchmarks. Franco-Nevada is the gold investment that works. 2022 ASSET HANDBOOK This Asset Handbook has not been prepared in connection with the sale of securities and is not an offering memorandum and should not be relied upon as such. This Asset Handbook does not constitute an offer to sell or a solicitation for an offer to purchase any security in any jurisdiction.
THE GOLD INVESTMENT THAT WORKS PRECIOUS METALS DIVERSIFIED ASSETS OVERVIEW RESERVES AND RESOURCES ADDITIONAL INFORMATION 3 FRANCO-NEVADA CORPORATION “ ” The Gold Investment that Works
GOLD GOLD GOLD GOLD GOLD GOLD GOLD GOLD GOLD GOLD GOLD GOLD GOLD GOLD GOLD GOLD GOLD GOLD GOLD GOLD SILVER SILVER SILVER SILVER SILVER SILVER SILVER SILVER SILVER SILVER SILVER SILVER SILVER SILVER SILVER SILVER SILVER SILVER SILVER PLATINUM PLATINUM PLATINUM PLATINUM PLATINUM PLATINUM PLATINUM PLATINUM PLATINUM PLATINUM PLATINUM PLATINUM OIL NATURAL GAS NGLS OIL NATURAL GAS NGLS OIL NATURAL GAS NGLS OIL NATURAL GAS NGLS OIL NATURAL GAS NGLS OIL NATURAL IRON ORE IRON ORE IRON ORE IRON ORE IRON ORE IRON ORE IRON ORE IRON ORE IRON ORE IRON ORE IRON ORE IRON ORE GOLD GOLD GOLD GOLD GOLD GOLD GOLD GOLD GOLD GOLD GOLD GOLD GOLD GOLD GOLD GOLD GOLD GOLD GOLD GOLD SILVER SILVER SILVER SILVER SILVER SILVER SILVER SILVER SILVER SILVER SILVER SILVER SILVER SILVER SILVER SILVER SILVER SILVER SILVER PLATINUM PLATINUM PLATINUM PLATINUM PLATINUM PLATINUM PLATINUM PLATINUM PLATINUM PLATINUM PLATINUM PLATINUM IRON ORE IRON ORE IRON ORE IRON ORE IRON ORE IRON ORE IRON ORE IRON ORE IRON ORE IRON ORE IRON ORE IRON ORE GOLD GOLD GOLD GOLD GOLD GOLD GOLD GOLD GOLD GOLD GOLD GOLD GOLD GOLD GOLD GOLD GOLD GOLD GOLD GOLD SILVER SILVER SILVER SILVER SILVER SILVER SILVER SILVER SILVER SILVER SILVER SILVER SILVER SILVER SILVER SILVER SILVER SILVER SILVER PLATINUM PLATINUM PLATINUM PLATINUM PLATINUM PLATINUM PLATINUM PLATINUM PLATINUM PLATINUM PLATINUM PLATINUM GOLD GOLD GOLD GOLD GOLD GOLD GOLD GOLD GOLD GOLD GOLD GOLD GOLD GOLD GOLD GOLD GOLD GOLD GOLD GOLD SILVER SILVER SILVER SILVER SILVER SILVER SILVER SILVER SILVER SILVER SILVER SILVER SILVER SILVER SILVER SILVER SILVER SILVER SILVER PLATINUM PLATINUM PLATINUM PLATINUM PLATINUM PLATINUM PLATINUM PLATINUM PLATINUM PLATINUM PLATINUM PLATINUM OIL NATURAL GAS NGLS OIL NATURAL GAS NGLS OIL NATURAL GAS NGLS OIL NATURAL GAS NGLS OIL NATURAL GAS NGLS OIL NATURAL IRON ORE IRON ORE IRON ORE IRON ORE IRON ORE IRON ORE IRON ORE IRON ORE IRON ORE IRON ORE IRON ORE IRON ORE GOLD GOLD GOLD GOLD GOLD GOLD GOLD GOLD GOLD GOLD GOLD GOLD GOLD GOLD GOLD GOLD GOLD GOLD GOLD GOLD SILVER SILVER SILVER SILVER SILVER SILVER SILVER SILVER SILVER SILVER SILVER SILVER SILVER SILVER SILVER SILVER SILVER SILVER SILVER PLATINUM PLATINUM PLATINUM PLATINUM PLATINUM PLATINUM PLATINUM PLATINUM PLATINUM PLATINUM PLATINUM PLATINUM IRON ORE IRON ORE IRON ORE IRON ORE IRON ORE IRON ORE IRON ORE IRON ORE IRON ORE IRON ORE IRON ORE IRON ORE GOLD GOLD GOLD GOLD GOLD GOLD GOLD GOLD GOLD GOLD GOLD GOLD GOLD GOLD GOLD GOLD GOLD GOLD GOLD GOLD 2022 ASSET HANDBOOK 4 FNV TSX NYSE W e ar e delighted to publish our 2022 Asset Handbook and trust it will assist you to better understand our business and portfolio of assets. Franco-Nevada is the leading gold-focused royalty and streaming company with the largest and most diversified portfolio of cash flow producing assets. Our top line business model provides investors with gold price optionality while limiting exposure to cost inflation. Our high margins and exposure to exploration success have allowed us to outperform in both bull and bear markets. Our tag-line is “Franco-Nevada is the gold investment that works” and we are committed to ensuring it does work, for our shareholders, our operating partners and our communities. Combining a lower-risk gold investment with a strong balance sheet, progressive dividends and exposure to exploration optionality is the right mix to appeal to investors seeking to hedge market instability. Over the 14 years since our initial public offering, our shareholders have realized a share price appreciation of over 860% and a compounded annual growth rate of greater than 18%. Our objective is to sustain our dividend in almost any gold price environment and for it to be progressive. We have increased dividends for the fourteenth consecutive year and cumulative dividends now exceed US$1.73 billion. At year-end, our market capitalization exceeded US$26 billion, ranking Franco-Nevada among the largest gold companies in the world. We work to build long-term alignment with our operating partners, knowing we are only successful if they are. This win-win approach and the natural flexibility of royalties and streams has proven to be an effective financing tool for the cyclical resource sector. Our approach is to provide low-cost financing to the industry, to act as stable and supportive partners through the cycle and to share in the upside of a property. Our shareholders rely on us to allocate capital to responsible mining operations. As a result, attention to ESG is a core part of our transaction due diligence and we encourage our operators to adopt responsible operating principles as established by the World Gold Council or otherwise. Our goal is to achieve at least 40% diverse representation between the Board and senior management as a group by 2025 and we actively promote diversity and inclusion in our workforce. Our work with operators to develop and fund programs to benefit communities continues to expand. We have a unique approach to the royalty and streaming business that is born from experiencing many industry cycles. We avoid long-term debt to ensure strong capital availability at all times. Our Board and management have some of the best technical skills in the industry as evidenced by their success in asset selection. We are significant owners of the Company which is essential to our “thinking like owners”, keeping G&A low and treating shareholder funds as our own. Our investment objective is to increase our net asset value and cash flow per share, not just to make the Company larger. Our focus is growing our gold expo- sure. This includes financing gold mines and acquiring gold royalties, but increasingly through acquiring by-product precious metal streams from base metal mines. When good opportunities present themselves, we also invest in other resources outside of precious metals. This strategy adds to our cash flow growth, asset diversity and exposure to resource sector optionality. We don’t control when good assets come to market but seek to balance the portfolio exposure over time. DEAR STAKEHOLDERS
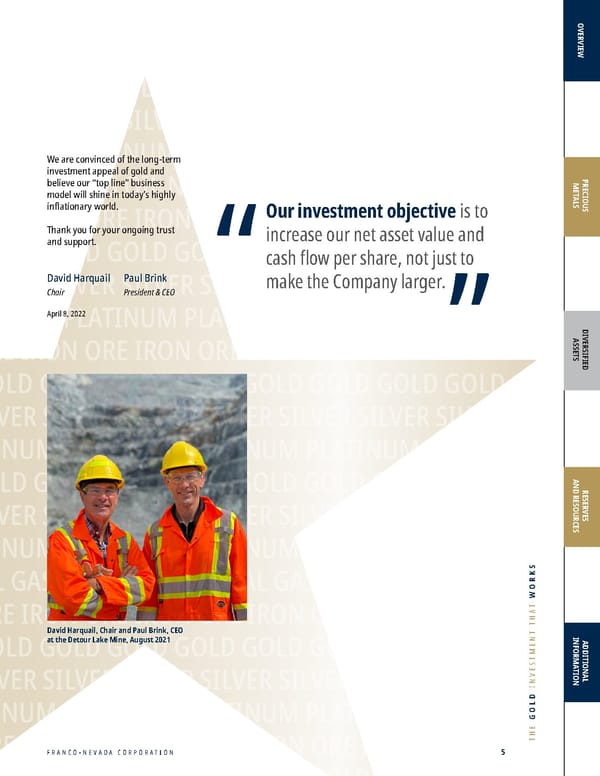
GOLD GOLD GOLD GOLD GOLD GOLD GOLD GOLD GOLD GOLD GOLD GOLD GOLD GOLD GOLD GOLD GOLD GOLD GOLD GOLD SILVER SILVER SILVER SILVER SILVER SILVER SILVER SILVER SILVER SILVER SILVER SILVER SILVER SILVER SILVER SILVER SILVER SILVER SILVER PLATINUM PLATINUM PLATINUM PLATINUM PLATINUM PLATINUM PLATINUM PLATINUM PLATINUM PLATINUM PLATINUM PLATINUM OIL NATURAL GAS NGLS OIL NATURAL GAS NGLS OIL NATURAL GAS NGLS OIL NATURAL GAS NGLS OIL NATURAL GAS NGLS OIL NATURAL IRON ORE IRON ORE IRON ORE IRON ORE IRON ORE IRON ORE IRON ORE IRON ORE IRON ORE IRON ORE IRON ORE IRON ORE GOLD GOLD GOLD GOLD GOLD GOLD GOLD GOLD GOLD GOLD GOLD GOLD GOLD GOLD GOLD GOLD GOLD GOLD GOLD GOLD SILVER SILVER SILVER SILVER SILVER SILVER SILVER SILVER SILVER SILVER SILVER SILVER SILVER SILVER SILVER SILVER SILVER SILVER SILVER PLATINUM PLATINUM PLATINUM PLATINUM PLATINUM PLATINUM PLATINUM PLATINUM PLATINUM PLATINUM PLATINUM PLATINUM IRON ORE IRON ORE IRON ORE IRON ORE IRON ORE IRON ORE IRON ORE IRON ORE IRON ORE IRON ORE IRON ORE IRON ORE GOLD GOLD GOLD GOLD GOLD GOLD GOLD GOLD GOLD GOLD GOLD GOLD GOLD GOLD GOLD GOLD GOLD GOLD GOLD GOLD SILVER SILVER SILVER SILVER SILVER SILVER SILVER SILVER SILVER SILVER SILVER SILVER SILVER SILVER SILVER SILVER SILVER SILVER SILVER PLATINUM PLATINUM PLATINUM PLATINUM PLATINUM PLATINUM PLATINUM PLATINUM PLATINUM PLATINUM PLATINUM PLATINUM GOLD GOLD GOLD GOLD GOLD GOLD GOLD GOLD GOLD GOLD GOLD GOLD GOLD GOLD GOLD GOLD GOLD GOLD GOLD GOLD SILVER SILVER SILVER SILVER SILVER SILVER SILVER SILVER SILVER SILVER SILVER SILVER SILVER SILVER SILVER SILVER SILVER SILVER SILVER PLATINUM PLATINUM PLATINUM PLATINUM PLATINUM PLATINUM PLATINUM PLATINUM PLATINUM PLATINUM PLATINUM PLATINUM OIL NATURAL GAS NGLS OIL NATURAL GAS NGLS OIL NATURAL GAS NGLS OIL NATURAL GAS NGLS OIL NATURAL GAS NGLS OIL NATURAL IRON ORE IRON ORE IRON ORE IRON ORE IRON ORE IRON ORE IRON ORE IRON ORE IRON ORE IRON ORE IRON ORE IRON ORE GOLD GOLD GOLD GOLD GOLD GOLD GOLD GOLD GOLD GOLD GOLD GOLD GOLD GOLD GOLD GOLD GOLD GOLD GOLD GOLD SILVER SILVER SILVER SILVER SILVER SILVER SILVER SILVER SILVER SILVER SILVER SILVER SILVER SILVER SILVER SILVER SILVER SILVER SILVER PLATINUM PLATINUM PLATINUM PLATINUM PLATINUM PLATINUM PLATINUM PLATINUM PLATINUM PLATINUM PLATINUM PLATINUM IRON ORE IRON ORE IRON ORE IRON ORE IRON ORE IRON ORE IRON ORE IRON ORE IRON ORE IRON ORE IRON ORE IRON ORE GOLD GOLD GOLD GOLD GOLD GOLD GOLD GOLD GOLD GOLD GOLD GOLD GOLD GOLD GOLD GOLD GOLD GOLD GOLD GOLD FRANCO-NEVADA CORPORATION 5 THE GOLD INVESTMENT THAT WORKS Our investment objective is to increase our net asset value and cash flow per share, not just to make the Company larger. “ ” David Harquail, Chair and Paul Brink, CEO at the Detour Lake Mine, August 2021 We are convinced of the long-term investment appeal of gold and believe our “top line” business model will shine in today’s highly inflationary world. Thank you for your ongoing trust and support. David Harquail Paul Brink Chair Pr esident & CEO April 8, 2022 PRECIOUS METALS DIVERSIFIED ASSETS OVERVIEW RESERVES AND RESOURCES ADDITIONAL INFORMATION
GOLD GOLD GOLD GOLD GOLD GOLD GOLD GOLD GOLD GOLD GOLD GOLD GOLD GOLD GOLD GOLD GOLD GOLD GOLD GOLD SILVER SILVER SILVER SILVER SILVER SILVER SILVER SILVER SILVER SILVER SILVER SILVER SILVER SILVER SILVER SILVER SILVER SILVER SILVER PLATINUM PLATINUM PLATINUM PLATINUM PLATINUM PLATINUM PLATINUM PLATINUM PLATINUM PLATINUM PLATINUM PLATINUM OIL NATURAL GAS NGLS OIL NATURAL GAS NGLS OIL NATURAL GAS NGLS OIL NATURAL GAS NGLS OIL NATURAL GAS NGLS OIL NATURAL IRON ORE IRON ORE IRON ORE IRON ORE IRON ORE IRON ORE IRON ORE IRON ORE IRON ORE IRON ORE IRON ORE IRON ORE GOLD GOLD GOLD GOLD GOLD GOLD GOLD GOLD GOLD GOLD GOLD GOLD GOLD GOLD GOLD GOLD GOLD GOLD GOLD GOLD SILVER SILVER SILVER SILVER SILVER SILVER SILVER SILVER SILVER SILVER SILVER SILVER SILVER SILVER SILVER SILVER SILVER SILVER SILVER PLATINUM PLATINUM PLATINUM PLATINUM PLATINUM PLATINUM PLATINUM PLATINUM PLATINUM PLATINUM PLATINUM PLATINUM IRON ORE IRON ORE IRON ORE IRON ORE IRON ORE IRON ORE IRON ORE IRON ORE IRON ORE IRON ORE IRON ORE IRON ORE GOLD GOLD GOLD GOLD GOLD GOLD GOLD GOLD GOLD GOLD GOLD GOLD GOLD GOLD GOLD GOLD GOLD GOLD GOLD GOLD SILVER SILVER SILVER SILVER SILVER SILVER SILVER SILVER SILVER SILVER SILVER SILVER SILVER SILVER SILVER SILVER SILVER SILVER SILVER PLATINUM PLATINUM PLATINUM PLATINUM PLATINUM PLATINUM PLATINUM PLATINUM PLATINUM PLATINUM PLATINUM PLATINUM GOLD GOLD GOLD GOLD GOLD GOLD GOLD GOLD GOLD GOLD GOLD GOLD GOLD GOLD GOLD GOLD GOLD GOLD GOLD GOLD SILVER SILVER SILVER SILVER SILVER SILVER SILVER SILVER SILVER SILVER SILVER SILVER SILVER SILVER SILVER SILVER SILVER SILVER SILVER PLATINUM PLATINUM PLATINUM PLATINUM PLATINUM PLATINUM PLATINUM PLATINUM PLATINUM PLATINUM PLATINUM PLATINUM OIL NATURAL GAS NGLS OIL NATURAL GAS NGLS OIL NATURAL GAS NGLS OIL NATURAL GAS NGLS OIL NATURAL GAS NGLS OIL NATURAL IRON ORE IRON ORE IRON ORE IRON ORE IRON ORE IRON ORE IRON ORE IRON ORE IRON ORE IRON ORE IRON ORE IRON ORE GOLD GOLD GOLD GOLD GOLD GOLD GOLD GOLD GOLD GOLD GOLD GOLD GOLD GOLD GOLD GOLD GOLD GOLD GOLD GOLD SILVER SILVER SILVER SILVER SILVER SILVER SILVER SILVER SILVER SILVER SILVER SILVER SILVER SILVER SILVER SILVER SILVER SILVER SILVER PLATINUM PLATINUM PLATINUM PLATINUM PLATINUM PLATINUM PLATINUM PLATINUM PLATINUM PLATINUM PLATINUM PLATINUM IRON ORE IRON ORE IRON ORE IRON ORE IRON ORE IRON ORE IRON ORE IRON ORE IRON ORE IRON ORE IRON ORE IRON ORE GOLD GOLD GOLD GOLD GOLD GOLD GOLD GOLD GOLD GOLD GOLD GOLD GOLD GOLD GOLD GOLD GOLD GOLD GOLD GOLD 2022 ASSET HANDBOOK 6 FNV TSX NYSE OUR BOARD AND MANAGEMENT Board and Management at recent AGM Our success is attributable to a small team of highly capable people and the guidance of an experienced and engaged Board. Senior management all have long tenure with the Company and have proven success executing as a team. Our Board’s depth of industry leadership and technical skills has been key in their role as an investment committee. Individual Board biographies are provided on page 142 and Executive Management biographies are provided on page 144.
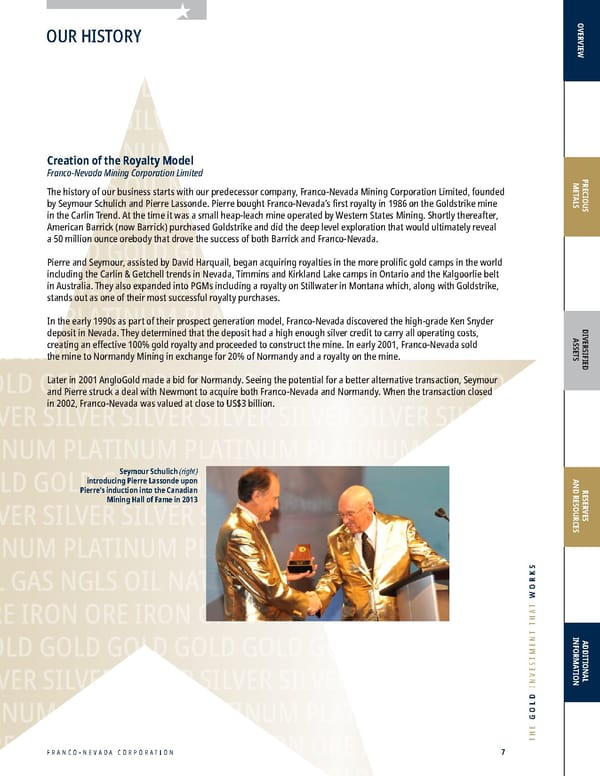
GOLD GOLD GOLD GOLD GOLD GOLD GOLD GOLD GOLD GOLD GOLD GOLD GOLD GOLD GOLD GOLD GOLD GOLD GOLD GOLD SILVER SILVER SILVER SILVER SILVER SILVER SILVER SILVER SILVER SILVER SILVER SILVER SILVER SILVER SILVER SILVER SILVER SILVER SILVER PLATINUM PLATINUM PLATINUM PLATINUM PLATINUM PLATINUM PLATINUM PLATINUM PLATINUM PLATINUM PLATINUM PLATINUM OIL NATURAL GAS NGLS OIL NATURAL GAS NGLS OIL NATURAL GAS NGLS OIL NATURAL GAS NGLS OIL NATURAL GAS NGLS OIL NATURAL IRON ORE IRON ORE IRON ORE IRON ORE IRON ORE IRON ORE IRON ORE IRON ORE IRON ORE IRON ORE IRON ORE IRON ORE GOLD GOLD GOLD GOLD GOLD GOLD GOLD GOLD GOLD GOLD GOLD GOLD GOLD GOLD GOLD GOLD GOLD GOLD GOLD GOLD SILVER SILVER SILVER SILVER SILVER SILVER SILVER SILVER SILVER SILVER SILVER SILVER SILVER SILVER SILVER SILVER SILVER SILVER SILVER PLATINUM PLATINUM PLATINUM PLATINUM PLATINUM PLATINUM PLATINUM PLATINUM PLATINUM PLATINUM PLATINUM PLATINUM IRON ORE IRON ORE IRON ORE IRON ORE IRON ORE IRON ORE IRON ORE IRON ORE IRON ORE IRON ORE IRON ORE IRON ORE GOLD GOLD GOLD GOLD GOLD GOLD GOLD GOLD GOLD GOLD GOLD GOLD GOLD GOLD GOLD GOLD GOLD GOLD GOLD GOLD SILVER SILVER SILVER SILVER SILVER SILVER SILVER SILVER SILVER SILVER SILVER SILVER SILVER SILVER SILVER SILVER SILVER SILVER SILVER PLATINUM PLATINUM PLATINUM PLATINUM PLATINUM PLATINUM PLATINUM PLATINUM PLATINUM PLATINUM PLATINUM PLATINUM GOLD GOLD GOLD GOLD GOLD GOLD GOLD GOLD GOLD GOLD GOLD GOLD GOLD GOLD GOLD GOLD GOLD GOLD GOLD GOLD SILVER SILVER SILVER SILVER SILVER SILVER SILVER SILVER SILVER SILVER SILVER SILVER SILVER SILVER SILVER SILVER SILVER SILVER SILVER PLATINUM PLATINUM PLATINUM PLATINUM PLATINUM PLATINUM PLATINUM PLATINUM PLATINUM PLATINUM PLATINUM PLATINUM OIL NATURAL GAS NGLS OIL NATURAL GAS NGLS OIL NATURAL GAS NGLS OIL NATURAL GAS NGLS OIL NATURAL GAS NGLS OIL NATURAL IRON ORE IRON ORE IRON ORE IRON ORE IRON ORE IRON ORE IRON ORE IRON ORE IRON ORE IRON ORE IRON ORE IRON ORE GOLD GOLD GOLD GOLD GOLD GOLD GOLD GOLD GOLD GOLD GOLD GOLD GOLD GOLD GOLD GOLD GOLD GOLD GOLD GOLD SILVER SILVER SILVER SILVER SILVER SILVER SILVER SILVER SILVER SILVER SILVER SILVER SILVER SILVER SILVER SILVER SILVER SILVER SILVER PLATINUM PLATINUM PLATINUM PLATINUM PLATINUM PLATINUM PLATINUM PLATINUM PLATINUM PLATINUM PLATINUM PLATINUM IRON ORE IRON ORE IRON ORE IRON ORE IRON ORE IRON ORE IRON ORE IRON ORE IRON ORE IRON ORE IRON ORE IRON ORE GOLD GOLD GOLD GOLD GOLD GOLD GOLD GOLD GOLD GOLD GOLD GOLD GOLD GOLD GOLD GOLD GOLD GOLD GOLD GOLD FRANCO-NEVADA CORPORATION 7 THE GOLD INVESTMENT THAT WORKS PRECIOUS METALS DIVERSIFIED ASSETS OVERVIEW RESERVES AND RESOURCES ADDITIONAL INFORMATION OUR HISTORY Creation of the Royalty Model Franco-Nevada Mining Corporation Limited The history of our business starts with our predecessor company, Franco-Nevada Mining Corporation Limited, founded by Seymour Schulich and Pierre Lassonde. Pierre bought Franco-Nevada’s first royalty in 1986 on the Goldstrike mine in the Carlin Trend. At the time it was a small heap-leach mine operated by Western States Mining. Shortly thereafter, American Barrick (now Barrick) purchased Goldstrike and did the deep level exploration that would ultimately reveal a 50 million ounce orebody that drove the success of both Barrick and Franco-Nevada. Pierre and Seymour, assisted by David Harquail, began acquiring royalties in the more prolific gold camps in the world including the Carlin & Getchell trends in Nevada, Timmins and Kirkland Lake camps in Ontario and the Kalgoorlie belt in Australia. They also expanded into PGMs including a royalty on Stillwater in Montana which, along with Goldstrike, stands out as one of their most successful royalty purchases. In the early 1990s as part of their prospect generation model, Franco-Nevada discovered the high-grade Ken Snyder deposit in Nevada. They determined that the deposit had a high enough silver credit to carry all operating costs, creating an effective 100% gold royalty and proceeded to construct the mine. In early 2001, Franco-Nevada sold the mine to Normandy Mining in exchange for 20% of Normandy and a royalty on the mine. Later in 2001 AngloGold made a bid for Normandy. Seeing the potential for a better alternative transaction, Seymour and Pierre struck a deal with Newmont to acquire both Franco-Nevada and Normandy. When the transaction closed in 2002, Franco-Nevada was valued at close to US$3 billion. Seymour Schulich (right) introducing Pierre Lassonde upon Pierre’s induction into the Canadian Mining Hall of Fame in 2013
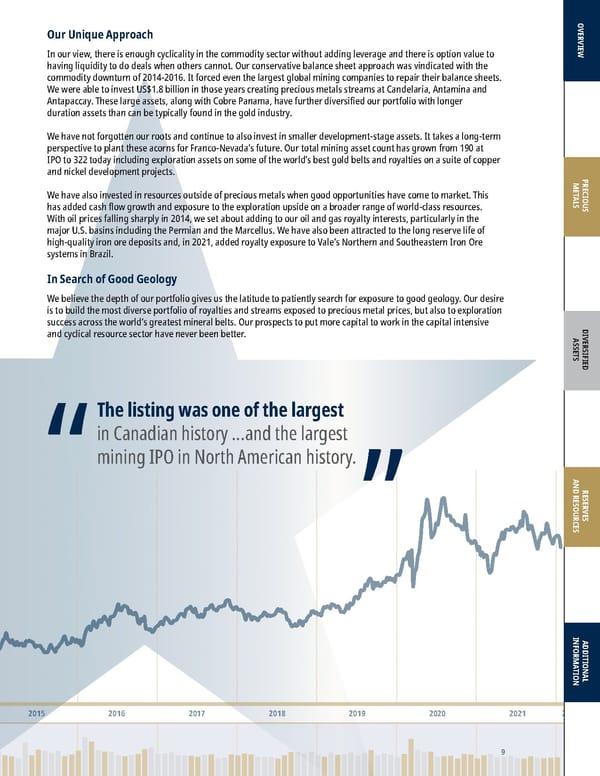
GOLD GOLD GOLD GOLD GOLD GOLD GOLD GOLD GOLD GOLD GOLD GOLD GOLD GOLD GOLD GOLD GOLD GOLD GOLD GOLD SILVER SILVER SILVER SILVER SILVER SILVER SILVER SILVER SILVER SILVER SILVER SILVER SILVER SILVER SILVER SILVER SILVER SILVER SILVER PLATINUM PLATINUM PLATINUM PLATINUM PLATINUM PLATINUM PLATINUM PLATINUM PLATINUM PLATINUM PLATINUM PLATINUM OIL NATURAL GAS NGLS OIL NATURAL GAS NGLS OIL NATURAL GAS NGLS OIL NATURAL GAS NGLS OIL NATURAL GAS NGLS OIL NATURAL IRON ORE IRON ORE IRON ORE IRON ORE IRON ORE IRON ORE IRON ORE IRON ORE IRON ORE IRON ORE IRON ORE IRON ORE GOLD GOLD GOLD GOLD GOLD GOLD GOLD GOLD GOLD GOLD GOLD GOLD GOLD GOLD GOLD GOLD GOLD GOLD GOLD GOLD SILVER SILVER SILVER SILVER SILVER SILVER SILVER SILVER SILVER SILVER SILVER SILVER SILVER SILVER SILVER SILVER SILVER SILVER SILVER PLATINUM PLATINUM PLATINUM PLATINUM PLATINUM PLATINUM PLATINUM PLATINUM PLATINUM PLATINUM PLATINUM PLATINUM IRON ORE IRON ORE IRON ORE IRON ORE IRON ORE IRON ORE IRON ORE IRON ORE IRON ORE IRON ORE IRON ORE IRON ORE GOLD GOLD GOLD GOLD GOLD GOLD GOLD GOLD GOLD GOLD GOLD GOLD GOLD GOLD GOLD GOLD GOLD GOLD GOLD GOLD SILVER SILVER SILVER SILVER SILVER SILVER SILVER SILVER SILVER SILVER SILVER SILVER SILVER SILVER SILVER SILVER SILVER SILVER SILVER PLATINUM PLATINUM PLATINUM PLATINUM PLATINUM PLATINUM PLATINUM PLATINUM PLATINUM PLATINUM PLATINUM PLATINUM GOLD GOLD GOLD GOLD GOLD GOLD GOLD GOLD GOLD GOLD GOLD GOLD GOLD GOLD GOLD GOLD GOLD GOLD GOLD GOLD SILVER SILVER SILVER SILVER SILVER SILVER SILVER SILVER SILVER SILVER SILVER SILVER SILVER SILVER SILVER SILVER SILVER SILVER SILVER PLATINUM PLATINUM PLATINUM PLATINUM PLATINUM PLATINUM PLATINUM PLATINUM PLATINUM PLATINUM PLATINUM PLATINUM OIL NATURAL GAS NGLS OIL NATURAL GAS NGLS OIL NATURAL GAS NGLS OIL NATURAL GAS NGLS OIL NATURAL GAS NGLS OIL NATURAL IRON ORE IRON ORE IRON ORE IRON ORE IRON ORE IRON ORE IRON ORE IRON ORE IRON ORE IRON ORE IRON ORE IRON ORE GOLD GOLD GOLD GOLD GOLD GOLD GOLD GOLD GOLD GOLD GOLD GOLD GOLD GOLD GOLD GOLD GOLD GOLD GOLD GOLD SILVER SILVER SILVER SILVER SILVER SILVER SILVER SILVER SILVER SILVER SILVER SILVER SILVER SILVER SILVER SILVER SILVER SILVER SILVER PLATINUM PLATINUM PLATINUM PLATINUM PLATINUM PLATINUM PLATINUM PLATINUM PLATINUM PLATINUM PLATINUM PLATINUM IRON ORE IRON ORE IRON ORE IRON ORE IRON ORE IRON ORE IRON ORE IRON ORE IRON ORE IRON ORE IRON ORE IRON ORE GOLD GOLD GOLD GOLD GOLD GOLD GOLD GOLD GOLD GOLD GOLD GOLD GOLD GOLD GOLD GOLD GOLD GOLD GOLD GOLD 8 2008 2009 2010 2011 2012 2013 2014 2016 2017 2015 2018 2019 2020 2021 2022 240.00 220.00 200.00 180.00 160.00 140.00 120.00 100.00 80.00 60.00 40.00 20.00 0.00 200.00M 0.00M December 20, 2007, ‘FNV’ opening day at the TSX The IPO Franco-Nevada Corporation (FNV) In 2007, Newmont made the decision to divest its portfolio of royalty assets. Pierre Lassonde, David Harquail and a small team led by management of the original Franco-Nevada, launched an initial public offering on the Toronto Stock Exchange and acquired the royalty portfolio from Newmont for US$1.2 billion. The offering remains the largest mining IPO completed in North America and was the birth of Franco-Nevada Corporation (FNV). The performance of the portfolio of royalties acquired from Newmont has more than justified the price of the IPO. In the past 14 years, the IPO portfolio has paid out over US$1.8 billion in revenue. At the same time, the reserve ounces associated with those same properties has tripled. Key contributors, including Detour Lake and Tasiast, have once again proven the power of the royalty business model and the exploration optionality of being exposed to great geology. Streaming – the New Engine of Growth With an increase in energy prices, oil and gas made up more than 40% of Franco-Nevada’s revenues in 2008. We set out to add gold revenue adding royalties on Newmont’s Gold Quarry operation in Nevada and Subika mine in Ghana. At the end of 2008, in the depth of the financial crisis, we enter ed into our first gold str eaming agreement with Coeur Mining. The financing assisted Coeur Mining to complete the construction of the Palmar ejo mine in Me xico. As Franco-Nevada’s revenues became more weighted to precious metals, its share price was rerated upwards. In 2012, we made a US$1 billion gold and silver streaming commitment to support Inmet's construction of the giant Cobre Panama project. A few years later the commitment was expanded to US$1.4 billion with the development of Cobre Panama then in the hands of First Quantum. First Quantum expanded the size of the planned mine and demonstrated its industry-leading project development skill bringing the asset to production in 2019. Cobre Panama is a cornerstone asset for Franco-Nevada today and First Quantum’s plans to expand the mine will be our major growth driver through 2023.
GOLD GOLD GOLD GOLD GOLD GOLD GOLD GOLD GOLD GOLD GOLD GOLD GOLD GOLD GOLD GOLD GOLD GOLD GOLD GOLD SILVER SILVER SILVER SILVER SILVER SILVER SILVER SILVER SILVER SILVER SILVER SILVER SILVER SILVER SILVER SILVER SILVER SILVER SILVER PLATINUM PLATINUM PLATINUM PLATINUM PLATINUM PLATINUM PLATINUM PLATINUM PLATINUM PLATINUM PLATINUM PLATINUM OIL NATURAL GAS NGLS OIL NATURAL GAS NGLS OIL NATURAL GAS NGLS OIL NATURAL GAS NGLS OIL NATURAL GAS NGLS OIL NATURAL IRON ORE IRON ORE IRON ORE IRON ORE IRON ORE IRON ORE IRON ORE IRON ORE IRON ORE IRON ORE IRON ORE IRON ORE GOLD GOLD GOLD GOLD GOLD GOLD GOLD GOLD GOLD GOLD GOLD GOLD GOLD GOLD GOLD GOLD GOLD GOLD GOLD GOLD SILVER SILVER SILVER SILVER SILVER SILVER SILVER SILVER SILVER SILVER SILVER SILVER SILVER SILVER SILVER SILVER SILVER SILVER SILVER PLATINUM PLATINUM PLATINUM PLATINUM PLATINUM PLATINUM PLATINUM PLATINUM PLATINUM PLATINUM PLATINUM PLATINUM IRON ORE IRON ORE IRON ORE IRON ORE IRON ORE IRON ORE IRON ORE IRON ORE IRON ORE IRON ORE IRON ORE IRON ORE GOLD GOLD GOLD GOLD GOLD GOLD GOLD GOLD GOLD GOLD GOLD GOLD GOLD GOLD GOLD GOLD GOLD GOLD GOLD GOLD SILVER SILVER SILVER SILVER SILVER SILVER SILVER SILVER SILVER SILVER SILVER SILVER SILVER SILVER SILVER SILVER SILVER SILVER SILVER PLATINUM PLATINUM PLATINUM PLATINUM PLATINUM PLATINUM PLATINUM PLATINUM PLATINUM PLATINUM PLATINUM PLATINUM GOLD GOLD GOLD GOLD GOLD GOLD GOLD GOLD GOLD GOLD GOLD GOLD GOLD GOLD GOLD GOLD GOLD GOLD GOLD GOLD SILVER SILVER SILVER SILVER SILVER SILVER SILVER SILVER SILVER SILVER SILVER SILVER SILVER SILVER SILVER SILVER SILVER SILVER SILVER PLATINUM PLATINUM PLATINUM PLATINUM PLATINUM PLATINUM PLATINUM PLATINUM PLATINUM PLATINUM PLATINUM PLATINUM OIL NATURAL GAS NGLS OIL NATURAL GAS NGLS OIL NATURAL GAS NGLS OIL NATURAL GAS NGLS OIL NATURAL GAS NGLS OIL NATURAL IRON ORE IRON ORE IRON ORE IRON ORE IRON ORE IRON ORE IRON ORE IRON ORE IRON ORE IRON ORE IRON ORE IRON ORE GOLD GOLD GOLD GOLD GOLD GOLD GOLD GOLD GOLD GOLD GOLD GOLD GOLD GOLD GOLD GOLD GOLD GOLD GOLD GOLD SILVER SILVER SILVER SILVER SILVER SILVER SILVER SILVER SILVER SILVER SILVER SILVER SILVER SILVER SILVER SILVER SILVER SILVER SILVER PLATINUM PLATINUM PLATINUM PLATINUM PLATINUM PLATINUM PLATINUM PLATINUM PLATINUM PLATINUM PLATINUM PLATINUM IRON ORE IRON ORE IRON ORE IRON ORE IRON ORE IRON ORE IRON ORE IRON ORE IRON ORE IRON ORE IRON ORE IRON ORE GOLD GOLD GOLD GOLD GOLD GOLD GOLD GOLD GOLD GOLD GOLD GOLD GOLD GOLD GOLD GOLD GOLD GOLD GOLD GOLD 9 2008 2009 2010 2011 2012 2013 2014 2016 2017 2015 2018 2019 2020 2021 2022 240.00 220.00 200.00 180.00 160.00 140.00 120.00 100.00 80.00 60.00 40.00 20.00 0.00 200.00M 0.00M PRECIOUS METALS DIVERSIFIED ASSETS OVERVIEW RESERVES AND RESOURCES ADDITIONAL INFORMATION Our Unique Approach In our view, there is enough cyclicality in the commodity sector without adding leverage and there is option value to having liquidity to do deals when others cannot. Our conservative balance sheet approach was vindicated with the commodity downturn of 2014-2016. It forced even the largest global mining companies to repair their balance sheets. We were able to invest US$1.8 billion in those years creating precious metals streams at Candelaria, Antamina and Antapaccay. These large assets, along with Cobre Panama, have further diversified our portfolio with longer duration assets than can be typically found in the gold industry. We have not forgotten our roots and continue to also invest in smaller development-stage assets. It takes a long-term perspective to plant these acorns for Franco-Nevada’s future. Our total mining asset count has grown from 190 at IPO to 322 today including exploration assets on some of the world’s best gold belts and royalties on a suite of copper and nickel development projects. We have also invested in resources outside of precious metals when good opportunities have come to market. This has added cash flow growth and exposure to the exploration upside on a broader range of world-class resources. With oil prices falling sharply in 2014, we set about adding to our oil and gas royalty interests, particularly in the major U.S. basins including the Permian and the Marcellus. We have also been attracted to the long reserve life of high-quality iron ore deposits and, in 2021, added royalty exposure to Vale’s Northern and Southeastern Iron Ore systems in Brazil. In Search of Good Geology We believe the depth of our portfolio gives us the latitude to patiently search for exposure to good geology. Our desire is to build the most diverse portfolio of royalties and streams exposed to precious metal prices, but also to exploration success across the world’s greatest mineral belts. Our prospects to put more capital to work in the capital intensive and cyclical resource sector have never been better. The listing was one of the largest in Canadian history ...and the largest mining IPO in North American history. “ ”
10 Information relating to projects, properties and their owners and operators presented in this Asset Handbook has been sourced from the public disclosure of the owners and operators of our assets available as at March 11, 2022 (except where stated otherwise). More current information may become available in our subsequent disclosure and on our website. This Asset Handbook contains information about many of our assets, including those that may not currently be material to us. Also, the description and depiction of our business and assets have been simplified for presentation purposes. Dollar references are in U.S. dollars unless otherwise noted. This Asset Handbook should be read with reference to the explanatory notes and cautionary statements contained in the Additional Information section found at the end of this Asset Handbook. Please also refer to the additional supporting information and explanatory notes found in our Annual Information Form (“AIF”), our annual Management’s Discussion & Analysis (“MD&A“), and our Annual Report on Form 40-F available at www.sedar.com and www.sec.gov, respectively, and on our website at www.franco-nevada.com. This Asset Handbook complements but does not form part of such documents. This Asset Handbook has not been prepared in connection with the sale of securities and is not an offering memorandum and should not be relied upon as such. This Asset Handbook does not constitute an offer to sell or a solicitation for an offer to pur chase any security in any jurisdiction.
Precious Metals Assets 38 South America 48 Central America and Mexico 52 United States 66 Canada 84 Rest of World 97 Precious Metals Exploration Assets PRECIOUS METALS Diversified Assets 104 Iron Ore 107 Other Mining 114 Diversified Exploration Assets 116 Energy Assets 126 Energy Exploration Assets DIVERSIFIED ASSETS Mineral Reserves and Resources 128 Gold Mineral Reserves 130 Gold Mineral Resources 132 Silver Mineral Reserves and Resources 133 PGM, Copper Mineral Reserves and Resources 134 Nickel, Chromite, Iron Ore Mineral Reserves and Resour ces RESERVES AND RESOURCES Additional Information 138 Asset Counts, Acreage of Assets 140 Mine Life Index 142 Board of Directors, Executive Management, Corporate Organization 146 Glossary 148 Non-GAAP Financial Measures 150 Technical and Third Party Information, Forward Looking Information ADDITIONAL INFORMATION FRANCO-NEVADA CORPORATION 11 Overview 12 Our Business 16 Global Assets Map 18 Asset Portfolio 20 Environmental, Social and Governance 24 Our Performance 28 Organic Growth Drivers 30 Royalty Ounces OVERVIEW
2022 ASSET HANDBOOK 12 FNV TSX NYSE Franco-Nevada Corporation is the leading gold-focused royalty and streaming company. We do not operate mines, develop projects or conduct exploration. Instead, we own and continue to grow a large, diversified portfolio of royalties and streams. Royalties Many mining properties have government and/or private royalties associated with them often created when prospectors or exploration companies sell their property to a more senior company capable of developing and operating a mine on the property. The most common royalties are 1-2% of the value of future production from the property. Often these are a percentage of the net value the Company receives for its product when it is processed at a smelter, hence the term “net smelter return royalty” or “NSR royalty”. There are other forms of royalties such as profit-related royalties or fixed-rate royalties but these are not a major part of Franco-Nevada’s focus or portfolio. Royalty rights are often registered on the title of the property or mineral rights. Registered royalties have strong tenure and, in jurisdictions where recognized, will generally survive an operating company reorganization. The majority of Franco-Nevada’s royalties have been acquired from the past owners of mining properties but we also actively work with operators to create royalties in return for mine financing. Streams Streams are metal purchase agreements where the streamer purchases all or a portion of the gold, silver or other products from a mine in exchange for an upfront payment and an additional payment on each delivery. While streams have similar exploration and price optionality to royalties, they differ from royalties in many respects including the ongoing cash payment required to purchase the physical metal. In some cases that ongoing payment is a fixed dollar amount and in other cases it is an agreed percentage of the commodity price at the time of delivery. A stream with fixed dollar ongoing payments has more leverage to the commodity price than the alternative. Both royalties and streams are typically life-of-mine agreements that provide exposure to commodity prices, increases in production and future discoveries on the property. Neither interest is subject to cash calls to fund exploration, development, capital, environmental or closure costs and so they are lower risk than an operating interest in this respect. A large and diversified portfolio can be assembled without the need for significant corporate overheads. OVERVIEW OUR BUSINESS MODEL Our Business
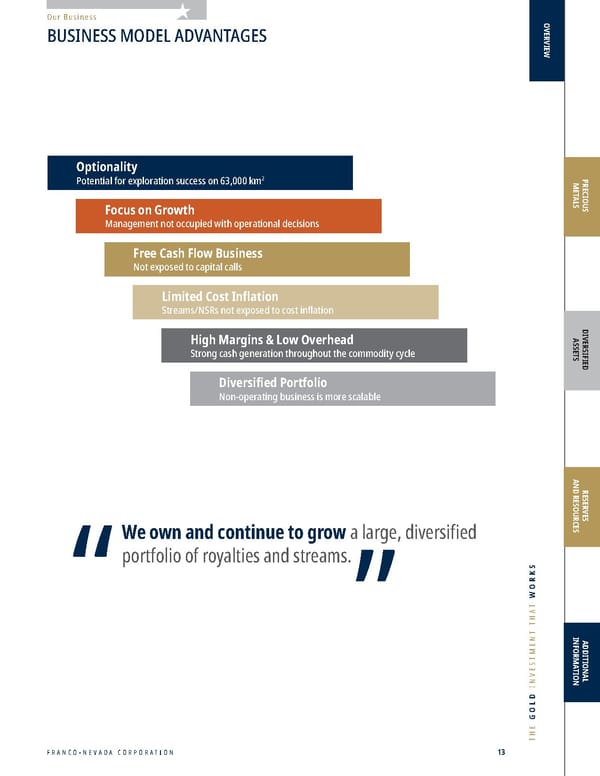
FRANCO-NEVADA CORPORATION 13 THE GOLD INVESTMENT THAT WORKS OVERVIEW PRECIOUS METALS DIVERSIFIED ASSETS RESERVES AND RESOURCES ADDITIONAL INFORMATION Our Business Optionality Potential for exploration success on 63,000 km 2 Focus on Growth Management not occupied with operational decisions Free Cash Flow Business Not exposed to capital calls Limited Cost Inflation Streams/NSRs not exposed to cost inflation High Margins & Low Overhead Strong cash generation throughout the commodity cycle Diversified Portfolio Non-operating business is more scalable We own and continue to grow a large, diversified portfolio of royalties and streams. “ ” BUSINESS MODEL ADVANTAGES
2022 ASSET HANDBOOK 14 FNV TSX NYSE OVERVIEW Our Business FINANCING SUCCESSFUL MINES PARTNERSHIP APPROACH M&A Financing Project Financing Emerging Projects Debt Reduction Support leading operators through long-term partnership Technical team with strong track record identifying successful projects Alignment with partners for a win-win solution
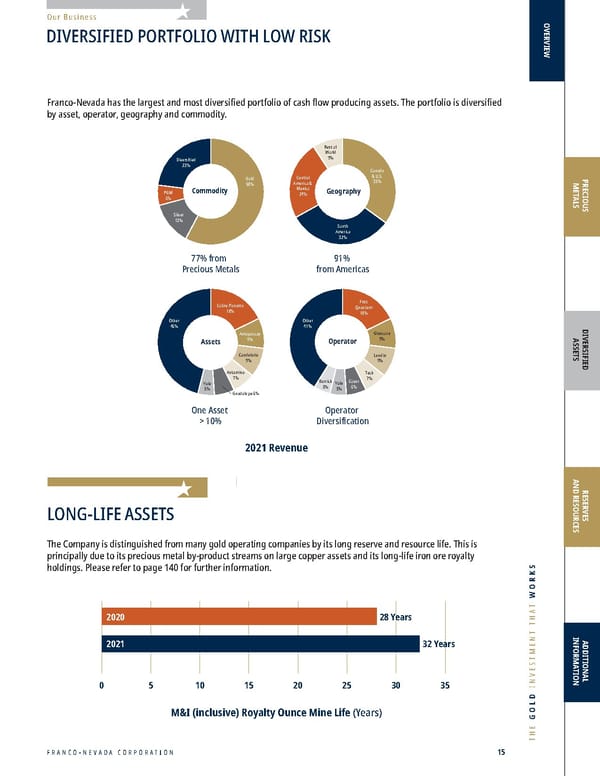
FRANCO-NEVADA CORPORATION 15 THE GOLD INVESTMENT THAT WORKS OVERVIEW PRECIOUS METALS DIVERSIFIED ASSETS RESERVES AND RESOURCES ADDITIONAL INFORMATION DIVERSIFIED PORTFOLIO WITH LOW RISK Our Business LONG-LIFE ASSETS The Company is distinguished from many gold operating companies by its long reserve and resource life. This is principally due to its precious metal by-product streams on large copper assets and its long-life iron ore royalty holdings. Please refer to page 140 for further information. Franco-Nevada has the largest and most diversified portfolio of cash flow producing assets. The portfolio is diversified by asset, operator, geography and commodity. 77% from Precious Metals 91% from Americas One Asset > 10% Operator Diversification Commodity South America 32% Reve nue Bre akdown YE 2021 Rest of World 9% Canada & U.S. 35% Central America & Mexico 24% Gold 58% Diversified 23% Silver 13% PGM 6% Cobre Panama 18% Antapaccay 9% Candelaria 9% Assets Antamina 7% Guadalupe 6% Vale 5% Other 46% Geography Operator First Quantum 18% Glencore 9% Barrick 5% Lundin 9% Teck 7% Coeur 6% Vale 5% Other 41% 2021 Revenue 25 30 15 20 5 10 M&I (inclusive) Royalty Ounce Mine Life (Years) 0 2020 35 28 Years 32 Years 2021 M&I (inclusive) Royalty Ounce Mine Life (Years) 2021 Revenue
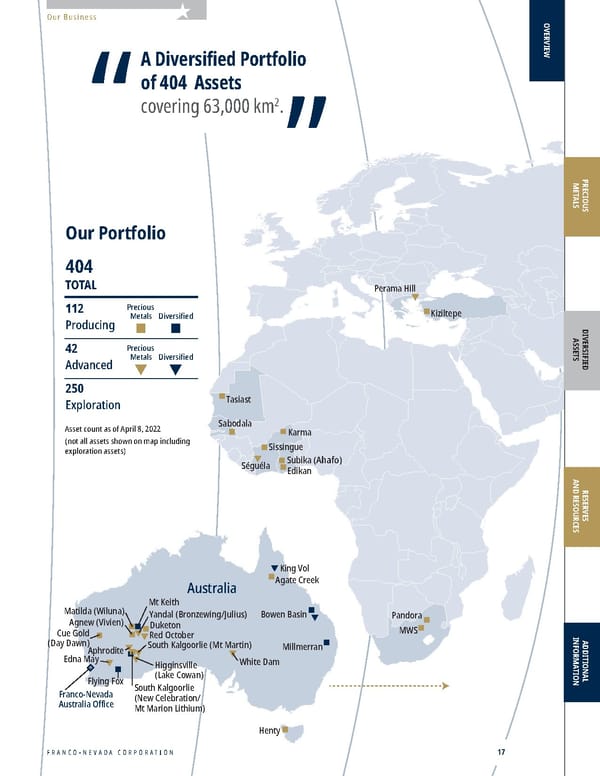
Island Gold Millmerran Red October Henty Mt Keith Duketon Yandal (Bronzewing/Julius) King Vol Bowen Basin South Kalgoorlie (Mt Martin) Flying Fox Sterling Robinson Fire Creek Bald Mountain Marigold EaglePicher Granite Creek (Pinson) Midas Goldstrike Gold Quarry South Arturo Hollister Nevada Australia Subika (Ahafo) Tasiast Sabodala Edikan MWS Perama Hill Kiziltepe Karma Sissingue Pandora Cobre Panama Falcondo Castle Mountain Mesquite Courageous Lake Musselwhite Hemlo Greenstone (Hardrock) Detour Lake Midale Weyburn Goldfields Monument Bay Edson Timmins West Sudbury Kirkland Lake Golden Highway Canadian Malartic Nevada Stibnite Gold Cariboo SCOOP Midland Orion Dublin Gulch (Eagle) Red Mountain Delaware STACK Franco-Nevada Australia Office Franco-Nevada Head Office Franco-Nevada U.S. Office Franco-Nevada Barbados Office Kivivic 2 Marcellus Guadalupe-Palmarejo Brucejack CentroGold (Gurupi) Cerro Moro Taca Taca NuevaUnión (Relincho) San Jorge Antamina Salares Norte/ Rio Baker Valentine Lake Antapaccay Candelaria Calcatreu Stillwater Cascabel (Alpala) Red Lake (Bateman) Milpillas Haynesville Agate Creek White Dam Condestable Séguéla Edna May Higginsville (Lake Cowan) Aphrodite Matilda (Wiluna) Agnew (Vivien) South Kalgoorlie (New Celebration/ Mt Marion Lithium) Cue Gold (Day Dawn) Carol Lake Vale N. System Vale S.E. System Sossego Our Portfolio 404 TOTAL 112 Producing 42 Advanced 250 Exploration Asset count as of April 8, 2022 (not all assets shown on map including exploration assets) Precious Metals Diversified Precious Metals Diversified Posse (Mara Rosa) Eskay Creek Rosemont/ Copper World 16 FNV TSX NYSE OVERVIEW GLOBAL ASSETS Our Business
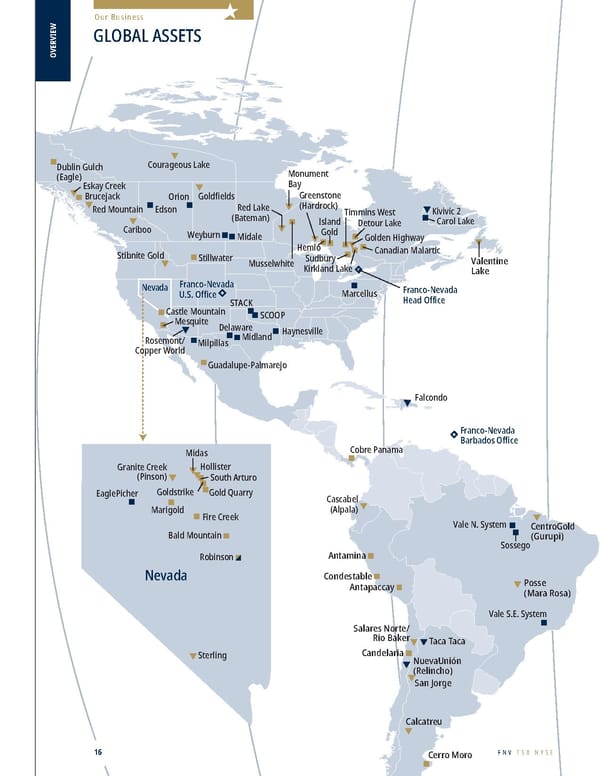
Island Gold Millmerran Red October Henty Mt Keith Duketon Yandal (Bronzewing/Julius) King Vol Bowen Basin South Kalgoorlie (Mt Martin) Flying Fox Sterling Robinson Fire Creek Bald Mountain Marigold EaglePicher Granite Creek (Pinson) Midas Goldstrike Gold Quarry South Arturo Hollister Nevada Australia Subika (Ahafo) Tasiast Sabodala Edikan MWS Perama Hill Kiziltepe Karma Sissingue Pandora Cobre Panama Falcondo Castle Mountain Mesquite Courageous Lake Musselwhite Hemlo Greenstone (Hardrock) Detour Lake Midale Weyburn Goldfields Monument Bay Edson Timmins West Sudbury Kirkland Lake Golden Highway Canadian Malartic Nevada Stibnite Gold Cariboo SCOOP Midland Orion Dublin Gulch (Eagle) Red Mountain Delaware STACK Franco-Nevada Australia Office Franco-Nevada Head Office Franco-Nevada U.S. Office Franco-Nevada Barbados Office Kivivic 2 Marcellus Guadalupe-Palmarejo Brucejack CentroGold (Gurupi) Cerro Moro Taca Taca NuevaUnión (Relincho) San Jorge Antamina Salares Norte/ Rio Baker Valentine Lake Antapaccay Candelaria Calcatreu Stillwater Cascabel (Alpala) Red Lake (Bateman) Milpillas Haynesville Agate Creek White Dam Condestable Séguéla Edna May Higginsville (Lake Cowan) Aphrodite Matilda (Wiluna) Agnew (Vivien) South Kalgoorlie (New Celebration/ Mt Marion Lithium) Cue Gold (Day Dawn) Carol Lake Vale N. System Vale S.E. System Sossego Our Portfolio 404 TOTAL 112 Producing 42 Advanced 250 Exploration Asset count as of April 8, 2022 (not all assets shown on map including exploration assets) Precious Metals Diversified Precious Metals Diversified Posse (Mara Rosa) Eskay Creek Rosemont/ Copper World FRANCO-NEVADA CORPORATION OVERVIEW PRECIOUS METALS DIVERSIFIED ASSETS RESERVES AND RESOURCES ADDITIONAL INFORMATION 17 Our Business A Diversified Portfolio of 404 Assets covering 63,000 km 2 . “ ”
2022 ASSET HANDBOOK 18 FNV TSX NYSE “NSR” Net Smelter Return Ro yalty “GORR” Gr oss Overriding Royalty “GR” Gr oss Royalty “ORR” Overriding Ro yalty “FH” Fr eehold or Lessor Royalty “NPI” Net Pr ofits Interest “NRI” Net Ro yalty Interest “WI” W orking Interest “P” “Pr oducing” assets are those that have generated revenue from steady-state operations for Franco-Nevada or are expected to in the next year. “A” “ Advanced” assets are interests on projects which are not yet producing, but where in management’s view, the technical feasibility and commercial viability of extracting a mineral resource are demonstrable. “E” “Explor ation” assets represent interests on projects where technical feasibility and commercial viability of extracting a mineral resource are not demonstrable. Management uses the following criteria in its assessment of technical feasibility and commercial viability: (i) Geology: ther e is a known mineral deposit which contains mineral reserves or resources; or the project is adjacent to a mineral deposit that is already being mined or developed and there is sufficient geologic certainty of converting the deposit into mineral reserves or resources. (ii) Accessibility and authorization: ther e are no significant unresolved issues impacting the accessibility and authorization to develop or mine the mineral deposit, and social, environmental and governmental permits and approvals to develop or mine the mineral deposit appear obtainable. Re venue ($ millions) Asset Oper ator Inter est and % (Gold unless otherwise noted) 2021 2020 2019 Notes Precious Metals SOUTH AMERICA Candelaria Lundin Mining Str eam 68% Gold & Silver $ 116.5 $ 106.8 $ 103.1 6, P Antapaccay Glencore Str eam (indexed) Gold & Silver 111.6 118.5 100.4 6, P Antamina Teck Resources Str eam 22.5% Silver 94.1 57.0 44.9 6, P Condestable Southern Peaks Mining Str eam Gold & Silver, Fixed through 2025 then % (7 ) 22.5 – – 6, P Other (19 assets) 6.2 4.9 5.9 Px1, Ax7, Ex11 CENTRAL AMERICA & MEXICO Cobre Panama First Quantum Str eam (indexed) Gold & Silver 235.0 135.4 64.7 6, P Guadalupe-Palmarejo Coeur Mining Str eam 50% 83.4 79.0 49.7 1, 3, 6, P Other (1 asset) – 0.5 0.5 Ex1 UNITED STATES Stillwater Sibanye-Stillwater NSR 5% PGM 57.8 50.9 39.8 1, P Goldstrike Nevada Gold Mines NSR 2-4%, NPI 2.4-6% 25.3 20.7 21.2 1, 2, P Gold Quarry Nevada Gold Mines NSR 7.29% 7.5 10.7 15.6 1, 3, P Marigold SSR Mining NSR 1.75-5%, GR 0.5-4% 8.5 7.1 8.7 1, 2, 3, 4, P Bald Mountain Kinross Gold NSR/GR 0.875-5% 11.2 11.2 8.9 1, 2, 3, 4, P Other (37 assets) 12.5 12.2 7.6 Px5, Ax6, Ex26 CANADA Detour Lake Agnico Eagle Mines NSR 2% 25.3 20.4 16.8 P Sudbury KGHM International Str eam 50% PGM & Gold 17.4 40.1 41.2 1, 6, Px2 Hemlo Barrick Gold NSR 3%, NPI 50% 27.6 69.9 18.2 1, 5, P Brucejack Newcrest Mining NSR 1.2% 7.0 7.2 5.6 1, P Kirkland Lake Agnico Eagle Mines NSR 1.5-5.5%, NPI 20% 5.8 5.4 5.2 2, 3, P Other (72 assets) 10.3 12.3 8.3 Px5, Ax13, Ex54 REST OF WORLD MWS Harmony Gold Mining Str eam 25% 41.3 41.8 37.1 6, P Sabodala Endeavour Mining Str eam 6%, Fixed to 105,750 oz (8) 16.7 21.6 29.5 3, 6, P Tasiast Kinross Gold NSR 2% 6.7 14.3 10.9 P Subika (Ahafo) Newmont NSR 2% 11.6 10.4 17.4 1, P Karma Néré Mining Str eam 4.875% 9.9 28.9 20.2 6, P Duketon Regis Resources NSR 2% 11.1 9.6 7.7 1, P Other (69 assets) 12.9 14.0 15.5 Px11, Ax9, Ex49 Revenue - Precious Metals $ 995.7 $ 910.8 $ 704.6 OVERVIEW ASSET PORTFOLIO Precious Metals Our Business
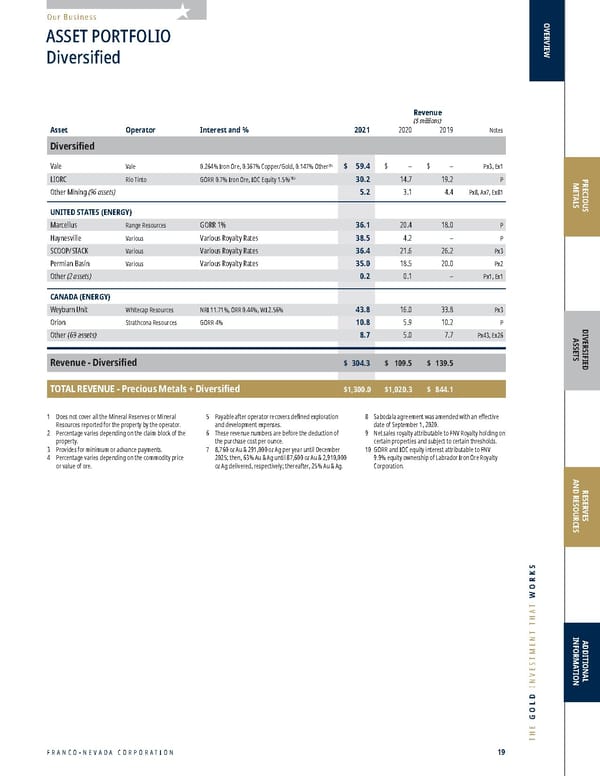
FRANCO-NEVADA CORPORATION 19 THE GOLD INVESTMENT THAT WORKS 1 Does not co ver all the Mineral Reserves or Mineral Resources reported for the property by the operator. 2 Per centage varies depending on the claim block of the property. 3 Pr ovides for minimum or advance payments. 4 Per centage varies depending on the commodity price or value of ore. 5 Payable after oper ator recovers defined exploration and development expenses. 6 These r evenue numbers are before the deduction of the purchase cost per ounce. 7 8,760 o z Au & 291,000 oz Ag per year until December 2025; then, 63% Au & Ag until 87,600 oz Au & 2,910,000 oz Ag delivered, respectively; thereafter, 25% Au & Ag. 8 Sabodala agr eement was amended with an effective date of September 1, 2020. 9 Net sales r oyalty attributable to FNV Royalty holding on certain properties and subject to certain thresholds. 10 GORR and IOC equity inter est attributable to FNV 9.9% equity ownership of Labrador Iron Ore Royalty Corporation. Re venue ($ millions) Asset Oper ator Inter est and % 2021 2020 2019 Notes Diversified Vale Vale 0.264% Iron Ore, 0.367% Copper/Gold, 0.147% Other (9) $ 59.4 $ – $ – Px3, Ex1 LIORC Rio Tinto GORR 0.7% Ir on Ore, IOC Equity 1.5% (10) 30.2 14.7 19.2 P Other Mining (96 assets) 5.2 3.1 4.4 Px8, Ax7, Ex81 UNITED STATES (ENERGY) Marcellus Range Resources GORR 1% 36.1 20.4 18.0 P Haynesville Various V arious Royalty Rates 38.5 4.2 – P SCOOP/STACK Various V arious Royalty Rates 36.4 21.6 26.2 Px3 Permian Basin Various V arious Royalty Rates 35.0 18.5 20.0 Px2 Other (2 assets) 0.2 0.1 – Px1, Ex1 CANADA (ENERGY) Weyburn Unit Whitecap Resources NRI 11.71%, ORR 0.44%, WI 2.56% 43.8 16.0 33.8 Px3 Orion Strathcona Resources GORR 4% 10.8 5.9 10.2 P Other (69 assets) 8.7 5.0 7.7 Px43, Ex26 Revenue - Diversified $ 304.3 $ 109.5 $ 139.5 TOTAL REVENUE - Precious Metals + Diversified $ 1,300.0 $ 1,020.3 $ 844.1 OVERVIEW PRECIOUS METALS DIVERSIFIED ASSETS RESERVES AND RESOURCES ADDITIONAL INFORMATION ASSET PORTFOLIO Diversified Our Business
2022 ASSET HANDBOOK OVERVIEW Inside the Antapaccay processing mill, Peru 20 FNV TSX NYSE “ We are committed to providing capital and support to the companies and operations that lead the industry in responsible mining and resource extraction and are proud of the progress achieved during the year. - Paul Brink, President & CEO ” ESG ENVIRONMENTAL, SOCIAL AND GOVERNANCE
OVERVIEW PRECIOUS METALS DIVERSIFIED ASSETS RESERVES AND RESOURCES ADDITIONAL INFORMATION FRANCO-NEVADA CORPORATION 21 THE GOLD INVESTMENT THAT WORKS

2022 ASSET HANDBOOK 22 FNV TSX NYSE OVERVIEW OUR ESG FOCUS ESG Good Governance & Shareholder Alignment Established board and management team aligned with shareholders with substantial ownership of company and having low G&A costs Responsible Capital Allocation Commitment to responsible mining and energy extraction as demonstrated through investments in operators and operations with proven track records Fostering Diversity and Inclusion Committed to furthering diversity and inclusion through the adoption of objective targets and ongoing sponsorships of diversity initiatives Community Contributions Contributing to our communities and engaging with our operators to partner in community initiatives where our royalty and stream assets are located Transparent ESG Disclosure Comprehensive annual ESG Report is available on our website and is aligned with leading sustainability frameworks, including TCFD and SASB 2022 ESG Report The Canadian Institute of Mining, Metallurgy and Petroleum Canadian Institute of Minin g, Metallu rgy and Petro leum Committed to WGC Responsible Gold Mining Principles UN Global Compact Participant 4 th ranked Canadian mining company in 2021 Board and Management own >$200M 1 in stock Low G&A even when compared to Gold ETF fees 1 Based on December 31, 2021 closing price Patron Sponsor Pledge to alleviate systemic black racism BOARD TARGET Independent Directors Women Directors 38% Board and Management Diverse Representation 40% by 2025 Accounting for a Sustainable Future
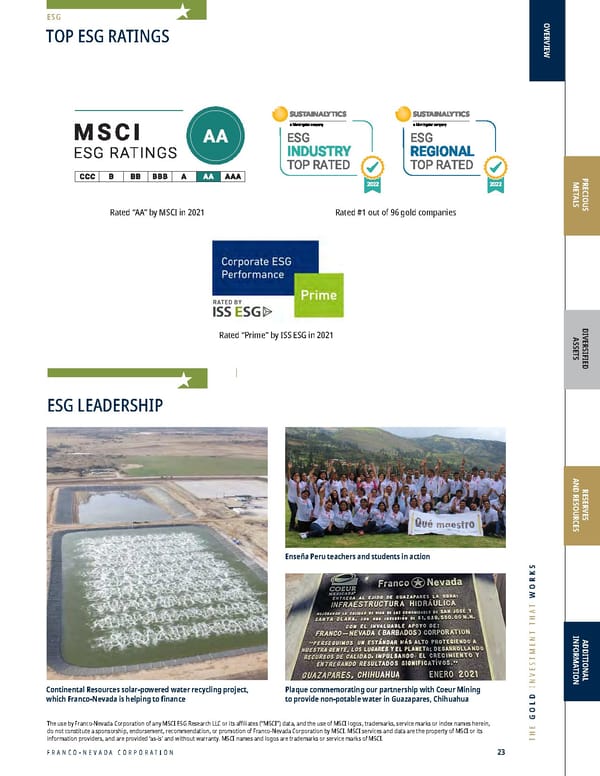
FRANCO-NEVADA CORPORATION 23 THE GOLD INVESTMENT THAT WORKS OVERVIEW PRECIOUS METALS DIVERSIFIED ASSETS RESERVES AND RESOURCES ADDITIONAL INFORMATION TOP ESG RATINGS ESG The use by Franco-Nevada Corporation of any MSCI ESG Research LLC or its affiliates (“MSCI”) data, and the use of MSCI logos, trademarks, service marks or index names herein, do not constitute a sponsorship, endorsement, recommendation, or promotion of Franco-Nevada Corporation by MSCI. MSCI services and data are the property of MSCI or its information providers, and are provided ‘as-is’ and without warranty. MSCI names and logos are trademarks or service marks of MSCI. Continental Resources solar-powered water recycling project, which Franco-Nevada is helping to finance Enseña Peru teachers and students in action Plaque commemorating our partnership with Coeur Mining to provide non-potable water in Guazapares, Chihuahua ESG LEADERSHIP Rated “AA” by MSCI in 2021 Rated “Prime” by ISS ESG in 2021 Rated #1 out of 96 gold companies
2022 ASSET HANDBOOK 24 FNV TSX NYSE OVERVIEW 1 Starting in Q4 2021, r evenue from Franco-Nevada’s Energy assets are included in the calculation of Gold Equivalent Ounces (“GEOs”). GEOs for comparative periods have been recalculated to conform with the current presentation. GEOs include Franco-Nevada’s attributable share of production from our Mining and Energy assets, after applicable recovery and payability factors. GEOs are estimated on a gross basis for NSR royalties and, in the case of stream ounces, before the payment of the per ounce contractual price paid by the Company. For NPI royalties, GEOs are calculated taking into account the NPI economics. Silver, platinum, palladium, iron ore, oil, gas and other commodities are converted to GEOs by dividing associated revenue, which includes settlement adjustments, by the relevant gold price. The price used in the computation of GEOs earned from a particular asset varies depending on the royalty or stream agreement, which may make reference to the market price realized by the operator, or the average price for the month, quarter, or year in which the commodity was produced or sold. 2 As at December 31. 3 Adjusted Net Income and Adjusted Net Income per shar e are non-GAAP financial measures with no standardized meaning under International Financial Reporting Standards (“IFRS”) and might not be comparable to similar financial measures disclosed by other issuers. Refer to the “Non-GAAP Financial Measures” section starting on page 148 of this Asset Handbook. Gold Equivalent Ounces Sold 1 (000s) Revenue (US$ millions) Market Capitalization 2 (US$ billions) Dividends & DRIP Paid Revenue G&A amended Adjusted Net income Per Share GEOs Market Cap 900 750 600 450 300 150 – ‘09 ‘13 ‘10 ‘11 ‘12 ‘08 ‘14 ‘15 ‘16 ‘17 ‘18 $1,500 $1,250 $1,000 $750 $500 $250 $ – ‘09 ‘13 ‘10 ‘11 ‘12 ‘08 ‘14 ‘15 ‘16 ‘17 ‘18 $30 $25 $20 $15 $10 $ 5 $ – ‘09 ‘13 ‘10 ‘11 ‘12 ‘08 ‘14 ‘15 ‘16 ‘17 ‘18 1.0% 0.8% 0.6% 0.4% 0.2% –% ‘09 ‘13 ‘10 ‘11 ‘12 ‘08 ‘14 ‘15 ‘16 ‘17 ‘18 $4.50 $3.75 $3.00 $2.25 $1.50 $0.75 $ – ‘09 ‘13 ‘10 ‘11 ‘12 ‘08 ‘14 ‘15 ‘16 ‘17 ‘18 ‘19 ‘19 ‘19 ‘19 ‘19 ‘20 ‘21 ‘20 ‘21 ‘20 ‘21 ‘20 ‘21 ‘20 ‘21 $250 $225 $200 $175 $150 $125 $ 100 $ 75 $ 50 $ 25 $ – ‘09 ‘13 ‘10 ‘11 ‘12 ‘08 ‘14 ‘15 ‘16 ‘17 ‘18 ‘19 ‘20 ‘21 Dividends & DRIP Paid Revenue G&A amended Adjusted Net income Per Share GEOs Market Cap 900 750 600 450 300 150 – ‘09 ‘13 ‘10 ‘11 ‘12 ‘08 ‘14 ‘15 ‘16 ‘17 ‘18 $1,500 $1,250 $1,000 $750 $500 $250 $ – ‘09 ‘13 ‘10 ‘11 ‘12 ‘08 ‘14 ‘15 ‘16 ‘17 ‘18 $30 $25 $20 $15 $10 $ 5 $ – ‘09 ‘13 ‘10 ‘11 ‘12 ‘08 ‘14 ‘15 ‘16 ‘17 ‘18 1.0% 0.8% 0.6% 0.4% 0.2% –% ‘09 ‘13 ‘10 ‘11 ‘12 ‘08 ‘14 ‘15 ‘16 ‘17 ‘18 $4.50 $3.75 $3.00 $2.25 $1.50 $0.75 $ – ‘09 ‘13 ‘10 ‘11 ‘12 ‘08 ‘14 ‘15 ‘16 ‘17 ‘18 ‘19 ‘19 ‘19 ‘19 ‘19 ‘20 ‘21 ‘20 ‘21 ‘20 ‘21 ‘20 ‘21 ‘20 ‘21 $250 $225 $200 $175 $150 $125 $ 100 $ 75 $ 50 $ 25 $ – ‘09 ‘13 ‘10 ‘11 ‘12 ‘08 ‘14 ‘15 ‘16 ‘17 ‘18 ‘19 ‘20 ‘21 Dividends & DRIP Paid Revenue G&A amended Adjusted Net income Per Share GEOs Market Cap 900 750 600 450 300 150 – ‘09 ‘13 ‘10 ‘11 ‘12 ‘08 ‘14 ‘15 ‘16 ‘17 ‘18 $1,500 $1,250 $1,000 $750 $500 $250 $ – ‘09 ‘13 ‘10 ‘11 ‘12 ‘08 ‘14 ‘15 ‘16 ‘17 ‘18 $30 $25 $20 $15 $10 $ 5 $ – ‘09 ‘13 ‘10 ‘11 ‘12 ‘08 ‘14 ‘15 ‘16 ‘17 ‘18 1.0% 0.8% 0.6% 0.4% 0.2% –% ‘09 ‘13 ‘10 ‘11 ‘12 ‘08 ‘14 ‘15 ‘16 ‘17 ‘18 $4.50 $3.75 $3.00 $2.25 $1.50 $0.75 $ – ‘09 ‘13 ‘10 ‘11 ‘12 ‘08 ‘14 ‘15 ‘16 ‘17 ‘18 ‘19 ‘19 ‘19 ‘19 ‘19 ‘20 ‘21 ‘20 ‘21 ‘20 ‘21 ‘20 ‘21 ‘20 ‘21 $250 $225 $200 $175 $150 $125 $ 100 $ 75 $ 50 $ 25 $ – ‘09 ‘13 ‘10 ‘11 ‘12 ‘08 ‘14 ‘15 ‘16 ‘17 ‘18 ‘19 ‘20 ‘21 G&A as % of Market Capitalization (000s) Adjusted Net Income 3 Per Share (US$ per share) Dividends and DRIP Paid (US$ millions) Dividends & DRIP Paid Revenue G&A amended Adjusted Net income Per Share GEOs Market Cap 900 750 600 450 300 150 – ‘09 ‘13 ‘10 ‘11 ‘12 ‘08 ‘14 ‘15 ‘16 ‘17 ‘18 $1,500 $1,250 $1,000 $750 $500 $250 $ – ‘09 ‘13 ‘10 ‘11 ‘12 ‘08 ‘14 ‘15 ‘16 ‘17 ‘18 $30 $25 $20 $15 $10 $ 5 $ – ‘09 ‘13 ‘10 ‘11 ‘12 ‘08 ‘14 ‘15 ‘16 ‘17 ‘18 1.0% 0.8% 0.6% 0.4% 0.2% –% ‘09 ‘13 ‘10 ‘11 ‘12 ‘08 ‘14 ‘15 ‘16 ‘17 ‘18 $4.50 $3.75 $3.00 $2.25 $1.50 $0.75 $ – ‘09 ‘13 ‘10 ‘11 ‘12 ‘08 ‘14 ‘15 ‘16 ‘17 ‘18 ‘19 ‘19 ‘19 ‘19 ‘19 ‘20 ‘21 ‘20 ‘21 ‘20 ‘21 ‘20 ‘21 ‘20 ‘21 $250 $225 $200 $175 $150 $125 $ 100 $ 75 $ 50 $ 25 $ – ‘09 ‘13 ‘10 ‘11 ‘12 ‘08 ‘14 ‘15 ‘16 ‘17 ‘18 ‘19 ‘20 ‘21 Dividends & DRIP Paid Revenue G&A amended Adjusted Net income Per Share GEOs Market Cap 900 750 600 450 300 150 – ‘09 ‘13 ‘10 ‘11 ‘12 ‘08 ‘14 ‘15 ‘16 ‘17 ‘18 $1,500 $1,250 $1,000 $750 $500 $250 $ – ‘09 ‘13 ‘10 ‘11 ‘12 ‘08 ‘14 ‘15 ‘16 ‘17 ‘18 $30 $25 $20 $15 $10 $ 5 $ – ‘09 ‘13 ‘10 ‘11 ‘12 ‘08 ‘14 ‘15 ‘16 ‘17 ‘18 1.0% 0.8% 0.6% 0.4% 0.2% –% ‘09 ‘13 ‘10 ‘11 ‘12 ‘08 ‘14 ‘15 ‘16 ‘17 ‘18 $4.50 $3.75 $3.00 $2.25 $1.50 $0.75 $ – ‘09 ‘13 ‘10 ‘11 ‘12 ‘08 ‘14 ‘15 ‘16 ‘17 ‘18 ‘19 ‘19 ‘19 ‘19 ‘19 ‘20 ‘21 ‘20 ‘21 ‘20 ‘21 ‘20 ‘21 ‘20 ‘21 $250 $225 $200 $175 $150 $125 $ 100 $ 75 $ 50 $ 25 $ – ‘09 ‘13 ‘10 ‘11 ‘12 ‘08 ‘14 ‘15 ‘16 ‘17 ‘18 ‘19 ‘20 ‘21 Dividends & DRIP Paid Revenue G&A amended Adjusted Net income Per Share GEOs Market Cap 900 750 600 450 300 150 – ‘09 ‘13 ‘10 ‘11 ‘12 ‘08 ‘14 ‘15 ‘16 ‘17 ‘18 $1,500 $1,250 $1,000 $750 $500 $250 $ – ‘09 ‘13 ‘10 ‘11 ‘12 ‘08 ‘14 ‘15 ‘16 ‘17 ‘18 $30 $25 $20 $15 $10 $ 5 $ – ‘09 ‘13 ‘10 ‘11 ‘12 ‘08 ‘14 ‘15 ‘16 ‘17 ‘18 1.0% 0.8% 0.6% 0.4% 0.2% –% ‘09 ‘13 ‘10 ‘11 ‘12 ‘08 ‘14 ‘15 ‘16 ‘17 ‘18 $4.50 $3.75 $3.00 $2.25 $1.50 $0.75 $ – ‘09 ‘13 ‘10 ‘11 ‘12 ‘08 ‘14 ‘15 ‘16 ‘17 ‘18 ‘19 ‘19 ‘19 ‘19 ‘19 ‘20 ‘21 ‘20 ‘21 ‘20 ‘21 ‘20 ‘21 ‘20 ‘21 $250 $225 $200 $175 $150 $125 $ 100 $ 75 $ 50 $ 25 $ – ‘09 ‘13 ‘10 ‘11 ‘12 ‘08 ‘14 ‘15 ‘16 ‘17 ‘18 ‘19 ‘20 ‘21 OUR PERFORMANCE Track Record
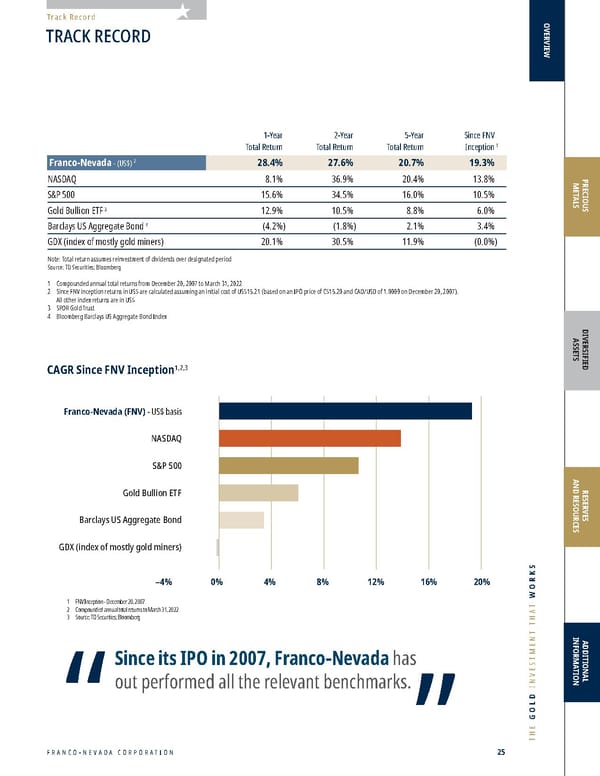
FRANCO-NEVADA CORPORATION 25 THE GOLD INVESTMENT THAT WORKS 1-Y ear 2-Year 5-Year Since FNV Total Return Total Return Total Return Inception 1 Franco-Nevada - (US$) 2 28.4% 27.6% 20.7% 19.3% NASDAQ 8.1% 36.9% 20.4% 13.8% S&P 500 15.6% 34.5% 16.0% 10.5% Gold Bullion ETF 3 12.9% 10.5% 8.8% 6.0% Barclays US Aggregate Bond 4 (4.2% ) (1.8% ) 2.1% 3.4% GDX (index of mostly gold miners) 20.1% 30.5% 11.9% (0.0% ) Note: Total return assumes reinvestment of dividends over designated period Source: TD Securities; Bloomberg 1 Compounded annual total returns from December 20, 2007 to March 31, 2022 2 Since FNV inception returns in US$ are calculated assuming an initial cost of US$15.21 (based on an IPO price of C$15.20 and CAD/USD of 1.0009 on December 20, 2007). All other inde x returns are in US$ 3 SPDR Gold Trust 4 Bloomber g Barclays US Aggregate Bond Index OVERVIEW CAGR Since FNV Inception 1,2,3 PRECIOUS METALS DIVERSIFIED ASSETS RESERVES AND RESOURCES ADDITIONAL INFORMATION TRACK RECORD Track Record Since its IPO in 2007, Franco-Nevada has out performed all the relevant benchmarks. “ ” Based on TD Securities Up to March 31, 2021 20% 24% 12% 16% 4% 8% NASDAQ S&P 500 Gold Bullion ETF Barclays US Aggregate Bond GDX (index of mostly gold miners) –4% 0% 1 FNV Inception - December 20, 2007 2 Compounded annual total returns to March 31, 2022 3 Source: TD Securities; Bloomberg Franco-Nevada (FNV) - US$ basis
2022 ASSET HANDBOOK 26 FNV TSX NYSE OVERVIEW 2021 - 2008 2021 3 2020 3 2019 3 2018 3 2017 3 2016 3 2015 3 2014 3 2013 3 2012 3 2011 3 2010 3 2009 3 2008 3 $ $ $ $ $ $ $ $ $ $ $ $ $ $ GEOs 1 sold (000s) 728.2 573.3 598.4 516.6 537.7 488.5 384.5 351.6 290.4 254.7 260.6 185.4 158.2 167.8 Revenue $ 1,300.0 $ 1,020.2 $ 844.1 $ 653.2 $ 675.0 $ 610.2 $ 443.6 $ 442.4 $ 400.9 $ 427.0 $ 411.2 $ 227.2 $ 199.7 $ 151.0 Operating Income $ 860.7 $ 336.5 $ 410.2 $ 188.8 $ 235.4 $ 155.4 $ 51.3 $ 155.8 $ 77.7 $ 146.7 $ 45.5 $ 87.3 $ 87.4 $ 38.1 Net Income (Loss) $ 733.7 $ 326.2 $ 344.1 $ 139.0 $ 194.7 $ 122.2 $ 24.6 $ 106.7 $ 11.7 $ 102.6 $ (6.8 ) $ 62.7 $ 80.9 $ 40.3 Basic Earnings (Loss) per share $ 3.84 $ 1.71 $ 1.83 $ 0.75 $ 1.06 $ 0.70 $ 0.16 $ 0.71 $ 0.08 $ 0.72 $ (0.05 ) $ 0.55 $ 0.76 $ 0.41 Adjusted Net Income 2 $ 673.6 $ 516.3 $ 341.5 $ 217.0 $ 198.3 $ 164.4 $ 88.9 $ 137.5 $ 138.3 $ 171.0 $ 136.0 $ 52.1 $ 32.0 $ 43.7 Adjusted Net Income 2 per share $ 3.52 $ 2.71 $ 1.82 $ 1.17 $ 1.08 $ 0.94 $ 0.57 $ 0.91 $ 0.94 $ 1.19 $ 1.08 $ 0.46 $ 0.30 $ 0.48 Adjusted EBITDA 2 $ 1,092.3 $ 839.6 $ 673.4 $ 519.6 $ 516.1 $ 489.1 $ 337.1 $ 356.0 $ 319.9 $ 347.5 $ 327.3 $ 180.0 $ 119.4 $ 127.2 Adjusted EBITDA 2 per share $ 5.72 $ 4.41 $ 3.59 $ 2.79 $ 2.82 $ 2.79 $ 2.37 $ 2.18 $ 2.43 $ 2.61 $ 1.58 $ 1.12 $ 1.30 $ 2.15 Dividends and DRIP Paid $ 221.4 $ 197.2 $ 187.0 $ 177.8 $ 167.9 $ 156.8 $ 129.0 $ 118.0 $ 104.4 $ 77.9 $ 49.2 $ 33.3 $ 28.2 $ 21.8 Dividends Paid per share $ 1.16 $ 1.03 $ 0.99 $ 0.95 $ 0.91 $ 0.87 $ 0.83 $ 0.78 $ 0.72 $ 0.54 $ 0.32 $ 0.29 C$ 0.28 C$ 0.24 Working Capital 4 $ 708.2 $ 610.5 $ 225.3 $ 153.5 $ 593.8 $ 323.6 $ 253.9 $ 677.8 $ 861.2 $ 822.4 $ 851.1 $ 572.7 $ 530.7 $ 239.1 Debt $ Nil $ Nil $ 80.0 $ 207.6 $ Nil $ Nil $ 457.3 $ Nil $ Nil $ Nil $ Nil $ Nil $ Nil $ Nil Total Shareholders’ Equity $ 6.0B $ 5.4B $ 5.1B $ 4.6B $ 4.7B $ 4.1B $ 3.2B $ 3.4B $ 3.0B $ 3.1B $ 2.8B $ 2.0B $ 1.9B $ 1.4B Market Capitalization 5 $ 26.5B $ 23.9B $ 19.6B $ 13.1B $ 14.9B $ 10.7B $ 7.2B $ 7.7B $ 6.0B $ 8.3B $ 5.3B $ 3.8B $ 3.2B $ 1.7B 1 Starting in Q4 2021, r evenue from Franco-Nevada’s Energy assets are included in the calculation of Gold Equivalent Ounces (“GEOs”). GEOs for comparative periods have been recalculated to conform with the current presentation. GEOs include Franco-Nevada’s attributable share of production from our Mining and Energy assets, after applicable recovery and payability factors. GEOs are estimated on a gross basis for NSR royalties and, in the case of stream ounces, before the payment of the per ounce contractual price paid by the Company. For NPI royalties, GEOs are calculated taking into account the NPI economics. Silver, platinum, palladium, iron ore, oil, gas and other commodities are converted to GEOs by dividing associated revenue, which includes settlement adjustments, by the relevant gold price. The price used in the computation of GEOs earned from a particular asset varies depending on the royalty or stream agreement, which may make reference to the market price realized by the operator, or the average price for the month, quarter, or year in which the commodity was produced or sold. 2 Adjusted Net Income, Adjusted Net Income per shar e, Adjusted EBITDA, and Adjusted EBITDA per share are non-GAAP financial measures with no standardized meaning under International Financial Reporting Standards (“IFRS”) and might not be comparable to similar financial measures disclosed by other issuers. Refer to the “Non-GAAP Financial Measur es” section starting on page 148 of this Asset Handbook. 3 Fiscal years 2010 thr ough 2021 were prepared in accordance with IFRS. Fiscal years 2008 and 2009 were prepared in accordance with Canadian GAAP. Comparative information has been adjusted to conform to current presentation. 4 The Company defines W orking Capital as current assets less current liabilities. 5 As at December 31. HISTORICAL PERFORMANCE Track Record
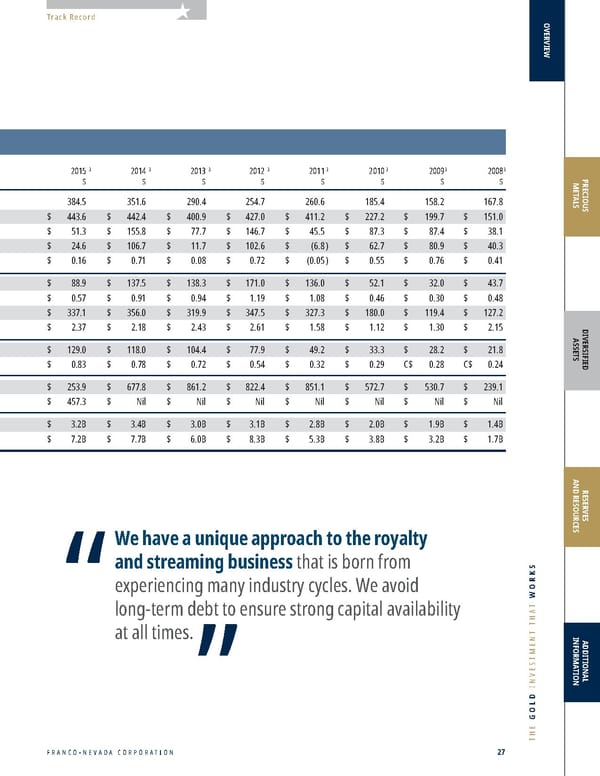
FRANCO-NEVADA CORPORATION 27 THE GOLD INVESTMENT THAT WORKS OVERVIEW 2021 3 2020 3 2019 3 2018 3 2017 3 2016 3 2015 3 2014 3 2013 3 2012 3 2011 3 2010 3 2009 3 2008 3 $ $ $ $ $ $ $ $ $ $ $ $ $ $ GEOs 1 sold (000s) 728.2 573.3 598.4 516.6 537.7 488.5 384.5 351.6 290.4 254.7 260.6 185.4 158.2 167.8 Revenue $ 1,300.0 $ 1,020.2 $ 844.1 $ 653.2 $ 675.0 $ 610.2 $ 443.6 $ 442.4 $ 400.9 $ 427.0 $ 411.2 $ 227.2 $ 199.7 $ 151.0 Operating Income $ 860.7 $ 336.5 $ 410.2 $ 188.8 $ 235.4 $ 155.4 $ 51.3 $ 155.8 $ 77.7 $ 146.7 $ 45.5 $ 87.3 $ 87.4 $ 38.1 Net Income (Loss) $ 733.7 $ 326.2 $ 344.1 $ 139.0 $ 194.7 $ 122.2 $ 24.6 $ 106.7 $ 11.7 $ 102.6 $ (6.8 ) $ 62.7 $ 80.9 $ 40.3 Basic Earnings (Loss) per share $ 3.84 $ 1.71 $ 1.83 $ 0.75 $ 1.06 $ 0.70 $ 0.16 $ 0.71 $ 0.08 $ 0.72 $ (0.05 ) $ 0.55 $ 0.76 $ 0.41 Adjusted Net Income 2 $ 673.6 $ 516.3 $ 341.5 $ 217.0 $ 198.3 $ 164.4 $ 88.9 $ 137.5 $ 138.3 $ 171.0 $ 136.0 $ 52.1 $ 32.0 $ 43.7 Adjusted Net Income 2 per share $ 3.52 $ 2.71 $ 1.82 $ 1.17 $ 1.08 $ 0.94 $ 0.57 $ 0.91 $ 0.94 $ 1.19 $ 1.08 $ 0.46 $ 0.30 $ 0.48 Adjusted EBITDA 2 $ 1,092.3 $ 839.6 $ 673.4 $ 519.6 $ 516.1 $ 489.1 $ 337.1 $ 356.0 $ 319.9 $ 347.5 $ 327.3 $ 180.0 $ 119.4 $ 127.2 Adjusted EBITDA 2 per share $ 5.72 $ 4.41 $ 3.59 $ 2.79 $ 2.82 $ 2.79 $ 2.37 $ 2.18 $ 2.43 $ 2.61 $ 1.58 $ 1.12 $ 1.30 $ 2.15 Dividends and DRIP Paid $ 221.4 $ 197.2 $ 187.0 $ 177.8 $ 167.9 $ 156.8 $ 129.0 $ 118.0 $ 104.4 $ 77.9 $ 49.2 $ 33.3 $ 28.2 $ 21.8 Dividends Paid per share $ 1.16 $ 1.03 $ 0.99 $ 0.95 $ 0.91 $ 0.87 $ 0.83 $ 0.78 $ 0.72 $ 0.54 $ 0.32 $ 0.29 C$ 0.28 C$ 0.24 Working Capital 4 $ 708.2 $ 610.5 $ 225.3 $ 153.5 $ 593.8 $ 323.6 $ 253.9 $ 677.8 $ 861.2 $ 822.4 $ 851.1 $ 572.7 $ 530.7 $ 239.1 Debt $ Nil $ Nil $ 80.0 $ 207.6 $ Nil $ Nil $ 457.3 $ Nil $ Nil $ Nil $ Nil $ Nil $ Nil $ Nil Total Shareholders’ Equity $ 6.0B $ 5.4B $ 5.1B $ 4.6B $ 4.7B $ 4.1B $ 3.2B $ 3.4B $ 3.0B $ 3.1B $ 2.8B $ 2.0B $ 1.9B $ 1.4B Market Capitalization 5 $ 26.5B $ 23.9B $ 19.6B $ 13.1B $ 14.9B $ 10.7B $ 7.2B $ 7.7B $ 6.0B $ 8.3B $ 5.3B $ 3.8B $ 3.2B $ 1.7B 1 Starting in Q4 2021, revenue from Franco-Nevada’s Energy assets are included in the calculation of Gold Equivalent Ounces (“GEOs”). GEOs for comparative periods have been recalculated to conform with the current presentation. GEOs include Franco-Nevada’s attributable share of production from our Mining and Energy assets, after applicable recovery and payability factors. GEOs are estimated on a gross basis for NSR royalties and, in the case of stream ounces, before the payment of the per ounce contractual price paid by the Company. For NPI royalties, GEOs are calculated taking into account the NPI economics. Silver, platinum, palladium, iron ore, oil, gas and other commodities are converted to GEOs by dividing associated revenue, which includes settlement adjustments, by the relevant gold price. The price used in the computation of GEOs earned from a particular asset varies depending on the royalty or stream agreement, which may make reference to the market price realized by the operator, or the average price for the month, quarter, or year in which the commodity was produced or sold. 2 Adjusted Net Income, Adjusted Net Income per share, Adjusted EBITDA, and Adjusted EBITDA per share are non-GAAP financial measures with no standardized meaning under International Financial Reporting Standards (“IFRS”) and might not be comparable to similar financial measures disclosed by other issuers. Refer to the “Non-GAAP Financial Measures” section starting on page 148 of this Asset Handbook. 3 Fiscal years 2010 through 2021 were prepared in accordance with IFRS. Fiscal years 2008 and 2009 were prepared in accordance with Canadian GAAP. Comparative information has been adjusted to conform to current presentation. 4 The Company defines Working Capital as current assets less current liabilities. 5 As at December 31. PRECIOUS METALS DIVERSIFIED ASSETS RESERVES AND RESOURCES ADDITIONAL INFORMATION Track Record We have a unique approach to the royalty and streaming business that is born from experiencing many industry cycles. We avoid long-term debt to ensure strong capital availability at all times. “ ”
GOLD GOLD GOLD GOLD GOLD GOLD GOLD GOLD GOLD GOLD GOLD GOLD GOLD GOLD GOLD GOLD GOLD GOLD GOLD GOLD SILVER SILVER SILVER] SILVER SILVER SILVER SILVER SILVER SILVER SILVER SILVER SILVER SILVER SILVER SILVER SILVER SILVER SILVER SIL- VER PLATINUM PLATINUM PLATINUM PLATINUM PLATINUM PLATINUM PLATINUM PLATINUM PLATINUM PLATINUM PLATINUM PLATI- NUM OIL NATURAL GAS NGLS OIL NATURAL GAS NGLS OIL NATURAL GAS NGLS OIL NATURAL GAS NGLS OIL NATURAL GAS NGLS OIL NATURAL IRON ORE IRON ORE IRON ORE IRON ORE IRON ORE IRON ORE IRON ORE IRON ORE IRON ORE IRON ORE IRON ORE IRON ORE GOLD GOLD GOLD GOLD GOLD GOLD GOLD GOLD GOLD GOLD GOLD GOLD GOLD GOLD GOLD GOLD GOLD GOLD GOLD GOLD SILVER SILVER SILVER SILVER SILVER SILVER SILVER SILVER SILVER SILVER SILVER SILVER SILVER SILVER SILVER SILVER SILVER SILVER SILVER PLATINUM PLATINUM PLATINUM PLATINUM PLATINUM PLATINUM PLATINUM PLATINUM PLATINUM PLATINUM PLATINUM PLATINUM IRON ORE IRON ORE IRON ORE IRON ORE IRON ORE IRON ORE IRON ORE IRON ORE IRON ORE IRON ORE IRON ORE IRON ORE GOLD GOLD GOLD GOLD GOLD GOLD GOLD GOLD GOLD GOLD GOLD GOLD GOLD GOLD GOLD GOLD GOLD GOLD GOLD GOLD SILVER SILVER SILVER SILVER SILVER SILVER SILVER SILVER SILVER SILVER SILVER SILVER SILVER SILVER SILVER SILVER SILVER SILVER SILVER PLATINUM PLATINUM PLATINUM PLATINUM PLATINUM PLATINUM PLATINUM PLATINUM PLATINUM PLATINUM PLATINUM PLATINUM GOLD GOLD GOLD GOLD GOLD GOLD GOLD GOLD GOLD GOLD GOLD GOLD GOLD GOLD GOLD GOLD GOLD GOLD GOLD GOLD SILVER SILVER SILVER SILVER SILVER SILVER SILVER SILVER SILVER SILVER SILVER SILVER SILVER SILVER SILVER SILVER SILVER SILVER SILVER PLATINUM PLATINUM PLATINUM PLATINUM PLATINUM PLATINUM PLATINUM PLATINUM PLATINUM PLATINUM PLATINUM PLATINUM OIL NATURAL GAS NGLS OIL NATURAL GAS NGLS OIL NATURAL GAS NGLS OIL NATURAL GAS NGLS OIL NATURAL GAS NGLS OIL NATURAL IRON ORE IRON ORE IRON ORE IRON ORE IRON ORE IRON ORE IRON ORE IRON ORE IRON ORE IRON ORE IRON ORE IRON ORE GOLD GOLD GOLD GOLD GOLD GOLD GOLD GOLD GOLD GOLD GOLD GOLD GOLD GOLD GOLD GOLD GOLD GOLD GOLD GOLD SILVER SILVER SILVER SILVER SILVER SILVER SILVER SILVER SILVER SILVER SILVrR SILVER SILVER SILVER SILVER SILVER SILVER SILVER SILVER PLATINUM PLATINUM PLATINUM PLATINUM PLATINUM PLATINUM PLATINUM PLATINUM PLATINUM PLATINUM PLATINUM PLATINUM IRON ORE IRON ORE IRON ORE IRON ORE IRON ORE IRON ORE IRON ORE IRON ORE IRON ORE IRON ORE IRON ORE IRON ORE OVERVIEW 2022 ASSET HANDBOOK 28 FNV TSX NYSE ORGANIC GROWTH DRIVERS Growth Outlook Over the last 15 years Franco-Nevada’s GEOs have grown over four times through organic expansions and acquisitions. In 2021, GEO sales were 728,237 GEOs. The outlook is equally as good. Our guidance 1 is for total GEO sales of 680,000 to 740,000 GEOs in 2022 growing to 765,000 to 825,000 GEOs by 2026 through organic growth alone. We have a strong pipeline of opportunities to add further growth through acquisition. Cobre Panama is expected to be the largest growth driver through the period with First Quantum looking to expand the mine from its current 85Mtpa throughput to 100Mtpa by the end of 2023. That growth is expected to be complemented by a combination of mine expansions and a number of new mines commencing production. Cobre Panama Stillwater Subika Detour Lake Tasiast Vale Macassa Island Gold Salares Norte Yandal/Bronzewing Séguéla Greenstone (Hardrock) Posse (Mara Rosa) Valentine Lake Aphrodite Eskay Creek Rosemont/Copper World 1 See InDesign file, page 28 2 Expansion periods are based on operators’ indicated period of ramp-up 3 Indicated start periods are based on operators’ guidance and FNV best estimates Expansions 2022 Q1 Q2 Q3 Q4 2023 Q1 Q2 Q3 Q4 2024 Q1 Q2 Q3 Q4 2025 Q1 Q2 Q3 Q4 2026 Q1 Q2 Q3 Q4 Q1 Q2 Q3 Q4 Q1 Q2 Q3 Q4 Q1 Q2 Q3 Q4 Q1 Q2 Q3 Q4 Q1 Q2 Q3 Q4 New Mines Est. Start 21 3 Panama Montana Ghana Ontario Mauritania Brazil Ontario Ontario Chile Australia Côte d’Ivoire Ontario Brazil Newfoundland Australia British Columbia Arizona 1 2022 Guidance and 2026 Outlook as published on Mar ch 9, 2022. Assuming: $1,800/oz Au, $23.00/oz Ag, $1,000/oz Pt, $2,100/oz Pd, $125/tonne Fe 62% CFR China, $85/bbl WTI oil and $3.75/mcf Henry Hub natur al gas 2 Expansion periods ar e based on operators’ indicated period of ramp-up 3 Indicated start periods ar e based on operators’ guidance and FNV best estimates
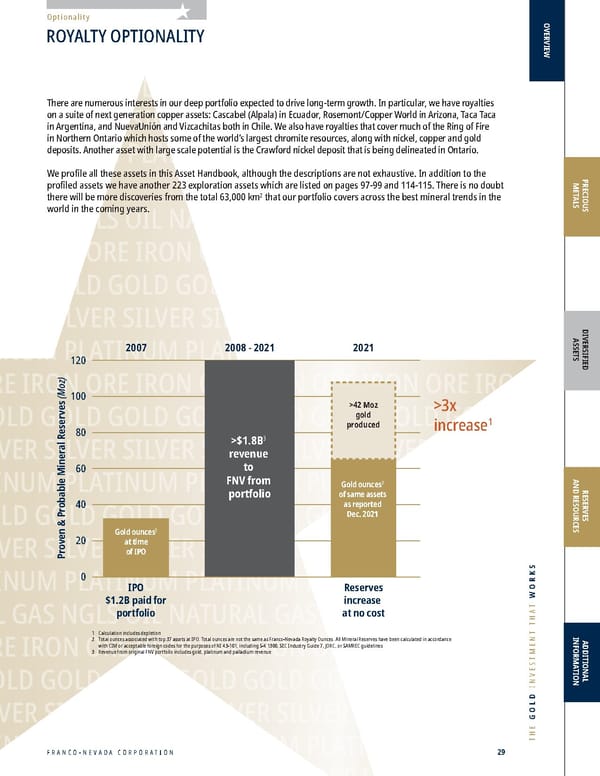
GOLD GOLD GOLD GOLD GOLD GOLD GOLD GOLD GOLD GOLD GOLD GOLD GOLD GOLD GOLD GOLD GOLD GOLD GOLD GOLD SILVER SILVER SILVER] SILVER SILVER SILVER SILVER SILVER SILVER SILVER SILVER SILVER SILVER SILVER SILVER SILVER SILVER SILVER SIL- VER PLATINUM PLATINUM PLATINUM PLATINUM PLATINUM PLATINUM PLATINUM PLATINUM PLATINUM PLATINUM PLATINUM PLATI- NUM OIL NATURAL GAS NGLS OIL NATURAL GAS NGLS OIL NATURAL GAS NGLS OIL NATURAL GAS NGLS OIL NATURAL GAS NGLS OIL NATURAL IRON ORE IRON ORE IRON ORE IRON ORE IRON ORE IRON ORE IRON ORE IRON ORE IRON ORE IRON ORE IRON ORE IRON ORE GOLD GOLD GOLD GOLD GOLD GOLD GOLD GOLD GOLD GOLD GOLD GOLD GOLD GOLD GOLD GOLD GOLD GOLD GOLD GOLD SILVER SILVER SILVER SILVER SILVER SILVER SILVER SILVER SILVER SILVER SILVER SILVER SILVER SILVER SILVER SILVER SILVER SILVER SILVER PLATINUM PLATINUM PLATINUM PLATINUM PLATINUM PLATINUM PLATINUM PLATINUM PLATINUM PLATINUM PLATINUM PLATINUM IRON ORE IRON ORE IRON ORE IRON ORE IRON ORE IRON ORE IRON ORE IRON ORE IRON ORE IRON ORE IRON ORE IRON ORE GOLD GOLD GOLD GOLD GOLD GOLD GOLD GOLD GOLD GOLD GOLD GOLD GOLD GOLD GOLD GOLD GOLD GOLD GOLD GOLD SILVER SILVER SILVER SILVER SILVER SILVER SILVER SILVER SILVER SILVER SILVER SILVER SILVER SILVER SILVER SILVER SILVER SILVER SILVER PLATINUM PLATINUM PLATINUM PLATINUM PLATINUM PLATINUM PLATINUM PLATINUM PLATINUM PLATINUM PLATINUM PLATINUM GOLD GOLD GOLD GOLD GOLD GOLD GOLD GOLD GOLD GOLD GOLD GOLD GOLD GOLD GOLD GOLD GOLD GOLD GOLD GOLD SILVER SILVER SILVER SILVER SILVER SILVER SILVER SILVER SILVER SILVER SILVER SILVER SILVER SILVER SILVER SILVER SILVER SILVER SILVER PLATINUM PLATINUM PLATINUM PLATINUM PLATINUM PLATINUM PLATINUM PLATINUM PLATINUM PLATINUM PLATINUM PLATINUM OIL NATURAL GAS NGLS OIL NATURAL GAS NGLS OIL NATURAL GAS NGLS OIL NATURAL GAS NGLS OIL NATURAL GAS NGLS OIL NATURAL IRON ORE IRON ORE IRON ORE IRON ORE IRON ORE IRON ORE IRON ORE IRON ORE IRON ORE IRON ORE IRON ORE IRON ORE GOLD GOLD GOLD GOLD GOLD GOLD GOLD GOLD GOLD GOLD GOLD GOLD GOLD GOLD GOLD GOLD GOLD GOLD GOLD GOLD SILVER SILVER SILVER SILVER SILVER SILVER SILVER SILVER SILVER SILVER SILVrR SILVER SILVER SILVER SILVER SILVER SILVER SILVER SILVER PLATINUM PLATINUM PLATINUM PLATINUM PLATINUM PLATINUM PLATINUM PLATINUM PLATINUM PLATINUM PLATINUM PLATINUM IRON ORE IRON ORE IRON ORE IRON ORE IRON ORE IRON ORE IRON ORE IRON ORE IRON ORE IRON ORE IRON ORE IRON ORE OVERVIEW PRECIOUS METALS DIVERSIFIED ASSETS RESERVES AND RESOURCES ADDITIONAL INFORMATION FRANCO-NEVADA CORPORATION 29 THE GOLD INVESTMENT THAT WORKS Optionality There are numerous interests in our deep portfolio expected to drive long-term growth. In particular, we have royalties on a suite of next generation copper assets: Cascabel (Alpala) in Ecuador, Rosemont/Copper World in Arizona, Taca Taca in Argentina, and NuevaUnión and Vizcachitas both in Chile. We also have royalties that cover much of the Ring of Fire in Northern Ontario which hosts some of the world’s largest chromite resources, along with nickel, copper and gold deposits. Another asset with large scale potential is the Crawford nickel deposit that is being delineated in Ontario. We profile all these assets in this Asset Handbook, although the descriptions are not exhaustive. In addition to the profiled assets we have another 223 exploration assets which are listed on pages 97-99 and 114-115. There is no doubt there will be more discoveries from the total 63,000 km 2 that our portfolio covers across the best mineral trends in the world in the coming years. ROYALTY OPTIONALITY IPO $1.2B paid for portfolio Reserves increase at no cost Proven & Probable Mineral Reserves (Moz) 1 Calculation includes depletion 2 Total ounces associated with top 37 assets at IPO. Total ounces are not the same as Franco-Nevada Royalty Ounces. All Mineral Reserves have been calculated in accordance with CIM or acceptable foreign codes for the purposes of NI 43-101, including S-K 1300, SEC Industry Guide 7, JORC, or SAMREC guidelines 3 Revenue from original FNV portfolio includes gold, platinum and palladium revenue >42 Moz gold produced >$1.8B 3 reve nue to FNV from po rtfo lio >3x increase 1 Gold ounces 2 at time of IPO Gold ounces 2 of same assets as reported Dec. 2021 2007 2008 - 2021 2021 120 100 80 60 40 20 0
2022 ASSET HANDBOOK 30 FNV TSX NYSE Why We Measure “Royalty Ounces” Franco-Nevada’s mining properties that have reported Mineral Reserves and Mineral Resources are tabulated in the Mineral Reserves and Resources appendix of this Asset Handbook. Unless otherwise noted in the Royalty Ounce calculation for each asset, the figures are tabulated based on the publicly disclosed reports of each operator for each property on a 100% basis. However, the tabulation does not provide a specific measure for Franco-Nevada’s interest in such Mineral Reserves and Mineral Resources for the following reasons: • Ro yalty and stream interests have different economics than an operator has for its stated Mineral Reserves and Mineral Resources. In addition, the economics differ between NSR, NPI and stream interests • Some assets do not co ver the entire property associated with the operator’s publicly reported figures To account for the above, we calculate “Royalty Ounces” to estimate the value attributable to Franco-Nevada due to our economic interest in the Mineral Reserves and Mineral Resources of our portfolio. The value of a Royalty Ounce is normalized to that of a gold NSR ounce. How We Estimate “Royalty Ounces” A traditional NSR royalty on a gold mining property provides Franco-Nevada with a simple percentage of the revenue or gold-in-kind produced from that property. For example, if we have a 2% NSR royalty on a property we calculate 2% of the stated Mineral Reserves and Mineral Resources as our “Royalty Ounces”. Note we do not make adjustments for recoveries and refining fees. When calculating Royalty Ounces for a property our objective is that they should be comparable to an attributable gold NSR Royalty Ounce. To achieve comparable Royalty Ounce figures, we make adjustments in the following circumstances: 1. The r oyalty or stream does not cover all the Mineral Reserves or Resources on a property: We provide our best estimate of the percentage of Mineral Reserves and Mineral Resources that are attributable to our inter est. 2. A str eam interest with an associated ongoing cost per ounce: The number of attributable stream ounces are factored to make them economically equivalent to a NSR ounce. For e xample, at an $1,800 per ounce gold price and a $400 cost per ounce, the stream ounces are factored by 77.7%. The factor depends on cost per ounce or the percentage margin written in the agreement. 3. A NPI r oyalty: A NPI is subject to the operating and capital costs specific to each asset. We generate our own internal mine life projections for each asset to determine a reasonable estimate of the economic equivalent of a gold NSR Royalty Ounce using an $1,800 gold price assumption. 4. An asset pr oducing silver, PGM or base/bulk metal: The number of attributable silver, platinum or palladium ounces, and attributable base/bulk metals pounds/tonnes are converted into Royalty Ounces. This year’s pricing assumptions for conversion include: $1,800 per ounce gold, $23 per ounce silver, $1,000 per ounce platinum, $2,100 per ounce palladium, $3.50 per pound copper, $9.00 per pound nickel, $0.95 per pound ferrochrome and $125/t Fe 62% CFR China for our calculations. In addition, NSR deductions can be more material for certain assets subject to deductions such as smelting and refining charges. For copper , nickel, ferrochrome and iron ore Royalty Ounce calculations deductions are more material compared to a typical gold NSR asset. In the Assets section of this Asset Handbook, we provide details for each asset that include summary figures for the Mineral Reserves (P&P Reserves), Mineral Resources (M&I Resources inclusive of P&P Reserves) and Inferred Mineral Resources (Inf Resources). We also provide the related P&P Royalty Ounces, M&I Royalty Ounces and Inf Royalty Ounces for each of those assets and the key guidance and assumptions that were required to derive those Royalty Ounces. Readers are cautioned that the Royalty Ounces are prepared by the management of Franco-Nevada and have not been reviewed or endorsed by the operators of the projects. OVERVIEW ROYALTY OUNCES Royalty Ounces
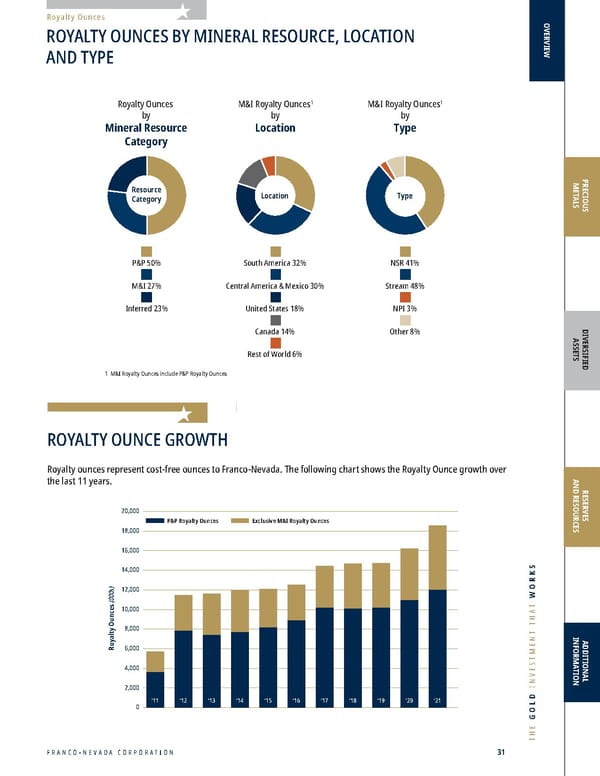
FRANCO-NEVADA CORPORATION 31 THE GOLD INVESTMENT THAT WORKS OVERVIEW PRECIOUS METALS DIVERSIFIED ASSETS RESERVES AND RESOURCES ADDITIONAL INFORMATION Royalty Ounces ROYALTY OUNCES BY MINERAL RESOURCE, LOCATION AND TYPE ROYALTY OUNCE GROWTH Royalty ounces represent cost-free ounces to Franco-Nevada. The following chart shows the Royalty Ounce growth over the last 11 years. ‘13 ‘12 ‘14 ‘15 ‘18 ‘16 ‘17 ‘19 ‘20 Royalty Ounces (000s) P&P Royalty Ounces ‘11 Exclusive M&I Royalty Ounces 20,000 18,000 16,000 14,000 12,000 10,000 8,000 6,000 4,000 2,000 0 ‘21 Royalty Ounces by Mineral Resource Category M&I Royalty Ounces 1 by Location M&I Royalty Ounces 1 by Type South America 32% Central America & Mexico 30% United States 18% Canada 14% Rest of World 6% P&P 50% M&I 27% Inferred 23% NSR 41% Stream 48% NPI 3% 1 M&I Royalty Ounces include P&P Royalty Ounces Other 8% Type Resource Category Location
2022 ASSET HANDBOOK 32 FNV TSX NYSE OVERVIEW Royalty Ounces Royalty Ounces 1,2 Asset T ype P &P (000s) M&I 3 (000s) Inf (000s) Precious Metals South America Candelaria Str eam 851 1,586 125 Antapaccay Str eam 440 868 72 Antamina Str eam 201 585 560 Condestable Str eam n/a 180 89 Cerro Moro NSR 15 18 6 Salares Norte NSR 40 44 1 Cascabel (Alpala) 4 NSR – 621 99 Posse (Mara Rosa) NSR 9 12 – CentroGold (Gurupi) NSR – 13 4 Calcatreu NSR – 17 9 San Jorge NSR – 91 4 Central America & Mexico Cobre Panama Str eam 4,743 4,973 769 Guadalupe - Palmarejo Str eam 211 467 60 United States Stillwater NSR 1,237 2,040 2,021 Carlin Trend NSR/NPI 188 324 79 Marigold NSR 106 154 8 Bald Mountain NSR 16 139 23 Mesquite NSR 8 31 15 Castle Mountain NSR 110 157 43 Fire Creek/Midas NSR – 3 84 Hollister NSR – 2 8 Stibnite Gold NSR 82 103 21 Canada Detour Lake NSR 301 595 24 Sudbury Str eam 24 24 – Hemlo NSR/NPI 54 127 40 Brucejack NSR 47 86 37 Kirkland Lake NSR/NPI 28 66 70 Dublin Gulch (Eagle) NSR 31 44 4 Musselwhite NPI 38 47 9 Timmins West NSR 12 15 1 Canadian Malartic NSR 5 13 32 Island Gold NSR 7 9 19 Golden Highway - Holt Complex NSR – 131 86 Golden Highway - Hislop NSR – 7 4 Golden Highway - Aquarius NSR – 22 – Greenstone (Hardrock) NSR 166 213 93 Valentine Lake NSR 32 47 25 Eskay Creek NSR 39 52 3 Red Lake (Bateman) NSR 10 15 5 Courageous Lake NSR 66 81 40 Goldfields NSR – 20 4 Monument Bay NSR – 44 53 Red Mountain NSR 5 8 1 Fenelon-Martiniere NSR – 32 20 Marathon (Sally) NSR – 9 4 1 For information r egarding the calculation of each Royalty Ounce, please refer to the individual asset write-ups. We have assumed $1,800/oz Au, $23/oz Ag, $1,000/oz Pt, $2,100/oz Pd, $3.50/lb copper, $9.00/lb nickel, $0.95/lb ferrochrome and $125/t Fe 62% CFR China for our calculations 2 Metallur gical deductions have not been made to the Mineral Reserves and Mineral Resources shown in order to estimate metal produced 3 M&I Ro yalty Ounces include P&P Royalty Ounces. Vale S.A. only discloses Mineral Reserves and, for the individual Vale (Northern & Southeastern System) and Sossego Royalty Ounces, it is assumed that M&I Royalty Ounces only include P&P Royalty Ounces 4 Copper Ro yalty Ounces assume NSR deductions of 15% (for Sossego, please refer to the Vale asset write-up); Nickel Royalty Ounces and Ferrochrome Royalty Ounces assume NSR deductions of 30%. Please also refer to the individual Vale (Northern & Southeastern System) and LIORC asset write-ups for the deductions applied to the Iron Ore Royalty Ounces
FRANCO-NEVADA CORPORATION 33 THE GOLD INVESTMENT THAT WORKS OVERVIEW PRECIOUS METALS DIVERSIFIED ASSETS RESERVES AND RESOURCES ADDITIONAL INFORMATION Royalty Ounces Compared to a gold exchange traded product, an investment in Franco-Nevada provides the opportunity to acquire gold exposure at a discount, along with the benefits of a meaningful yield and gold exploration optionality. Assuming an $1,800 per ounce gold price implies an undiscounted value of $21.5 billion for our attributable Mineral Reserve Royalty Ounces and $33.4 billion for our attributable M&I (inclusive) Mineral Resource Royalty Ounces. By contrast, our market capitalization at December 31, 2021 was $26.5 billion. We only estimate Royalty Ounces on our 78 most material mining projects. There are a further 244 advanced and exploration projects not included in the estimates that add considerable optionality for further ounces in the future. Our experience is that each year some of these projects will advance enough to be included as Royalty Ounces. Furthermore, we do not calculate Royalty Ounces for our Diversified Energy assets, comprised principally of oil and gas assets. In 2021, these assets comprised 16% of Franco-Nevada’s overall revenue. These revenues were more than sufficient to offset our income taxes paid (7% of revenue) and general and administrative expenses (2.4% of revenue). $33.4 billion Undiscounted Value of M&I (inclusive) Mineral Resource Royalty Ounces Royalty Ounces 1,2 Asset T ype P &P (000s) M&I 3 (000s) Inf (000s) Precious Metals Rest of World MWS Str eam 54 54 – Sabodala Str eam 75 112 35 Tasiast NSR 128 180 19 Subika (Ahafo) NSR 82 80 15 Karma Str eam 6 74 26 Duketon NSR 37 72 11 Edikan NSR 20 35 5 Matilda (Wiluna) NSR 46 128 71 South Kalgoorlie NSR 4 9 4 Kiziltepe NSR 2 3 2 Sissingué NSR 1 1 – Pandora NPI 30 258 33 Yandal (Bronzewing) NSR 16 26 5 Aphrodite NSR 14 29 13 Séguéla NSR 13 16 1 Perama Hill NSR 25 27 16 Agi Dagi NSR 23 44 6 Precious Metals Royalty Ounces 9,697 15,280 4,936 Diversified Mining Vale (Northern & Southeastern System) 4 Other 1,136 1,136 n/a Sossego 4 Other 5 5 n/a LIORC 4 Other 207 349 162 NuevaUnión (Relincho) 4 NSR 250 349 143 Taca Taca 4 NSR 359 437 100 Falcondo 4 NPI 84 95 6 Rosemont/Copper World 4 NSR 181 372 52 Robinson 4 NSR 5 18 1 Ring of Fire 4 NSR – 203 58 Eagle’s Nest 4 NSR 23 24 19 Crawford 4 NSR – 261 183 Mt Keith 4 NSR/NPI 19 42 5 Diversified Royalty Ounces 2,270 3,292 727 Total Royalty Ounces 11,967 18,572 5,663 * Refer to footnotes on page 32
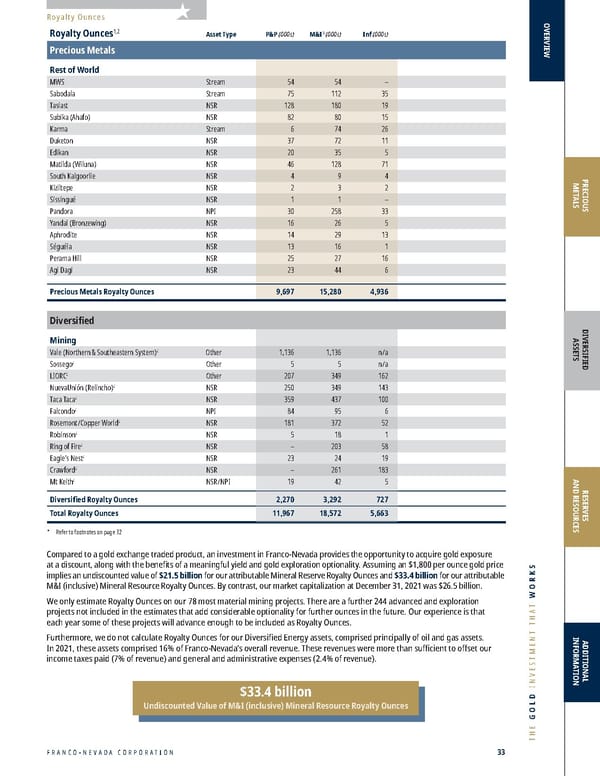
2022 ASSET HANDBOOK 34 FNV TSX NYSE OVERVIEW Royalty Ounces EXAMPLE ECONOMICS OF A ROYALTY VERSUS A STREAM The example below compares the value per ounce to Franco-Nevada of a 4% NSR, a 4% stream or a 4% NPI or WI. Assume for one ounce of gold, a sales price of $1,800, a “stream cost” of $400 per ounce and that the “all-in sustaining cost” 1 of the mine is $1,026 per ounce. Developed NSR Str eam NPI or WI 1 One ounce sold at $ 1,800 $ 1,800 $ 1,800 Applicable cost $ – $ 400 $ 1,026 Margin for AISC calculation $ 1,800 $ 1,400 $ 774 NSR, Stream or NPI % 4% 4% 4% Revenue per ounce to FNV $ 72 $ 56 $ 31 NSR equivalent 100% 78% 43% Alternatively – Ounces required to equal a 1% NSR 1.0 o z 1.3 o z 2.3 o z 1 For applicable costs for a developed NPI or WI, Franco-Nevada is, for illustrative purposes, assuming Barrick Gold Corporation’s (“Barrick”) 2021 all-in sustaining cash cost measur e, as Barrick is the operator of two assets at which Franco-Nevada has NPI interests. Based on the above economics, a comparable percentage NSR is 2.3 times more valuable than an equivalent Developed NPI or WI and almost 1.3 times more valuable than a stream interest. The NSR provides the highest margins and most downside protection to changes in the commodity price. The stream provides commodity price leverage similar to a low cost operating company with certainty as to future costs. The NPI or WI provides the most leverage to commodity price. A NSR provides the highest margins and most downside protection A Stream provides leverage to changes in the commodity price A NPI or WI provides the most leverage to commodity price. “ ” Duketon Mine, Australia
FRANCO-NEVADA CORPORATION 35 THE GOLD INVESTMENT THAT WORKS Precious Metals Assets 38 South America 48 Central America and Mexico 52 United States 66 Canada 84 Rest of World 97 Precious Metals Exploration Assets PRECIOUS METALS A NSR provides the highest margins and most downside protection A Stream provides leverage to changes in the commodity price A NPI or WI provides the most leverage to commodity price.
2022 ASSET HANDBOOK 36 FNV TSX NYSE PRECIOUS METALS South America Candelaria (Au & Ag) 39 Antapaccay (Au & Ag) 40 Antamina (Ag) 41 Condestable (Au & Ag) 42 Cerro Moro (Au & Ag) 43 Salares Norte (Au & Ag) 44 Cascabel (Alpala) (Au) 45 Posse (Mara Rosa) (Au & Ag) 46 CentroGold (Gurupi) (Au) 46 Calcatreu (Au & Ag) 47 San Jorge (Au) 47 Central America and Mexico Cobre Panama (Au & Ag) 49 Guadalupe-Palmarejo (Au) 51 United States Stillwater (PGM) 53 Goldstrike (Au) 54 Gold Quarry (Au) 55 Marigold (Au) 56 Bald Mountain (Au) 58 South Arturo (Au) 59 Mesquite (Au) 60 Castle Mountain (Au) 61 Fire Creek/Midas (Au & Ag) 62 Hollister (Au) 63 Stibnite Gold (Au) 64 Sterling (Au) 65 Granite Creek (Pinson) (Au) 65 Canada Detour Lake (Au) 67 Sudbury (PGM & Au) 68 Hemlo (Au) 69 Brucejack (Au & Ag) 70 Kirkland Lake (Au) 71 Dublin Gulch (Eagle) (Au) 72 Musselwhite (Au) 73 Timmins West (Au) 74 Canadian Malartic (Au) 75 Island Gold (Au) 76 Golden Highway (Au) 77 Greenstone (Hardrock) (Au) 78 Valentine Lake (Au) 79 Eskay Creek (Au & Ag) 80 Red Lake (Bateman) (Au) 80 Courageous Lake (Au) 81 Goldfields (Au) 81 Monument Bay (Au) 82 Red Mountain (Au) 82 Cariboo (Au) 83 Rest of World MWS (Au) 85 Sabodala (Au) 86 Tasiast (Au) 87 Subika (Ahafo) (Au) 88 Karma (Au) 89 Duketon (Au) 90 Edikan (Au) 91 Matilda (Wiluna) (Au) 92 South Kalgoorlie (Au) 92 Agnew (Vivien) (Au) 93 Kiziltepe (Au & Ag) 93 Sissingué (Au) 94 Pandora (PGM) 94 Yandal (Bronzewing) (Au) 95 Aphrodite (Au) 95 Séguéla (Au) 96 Perama Hill (Au) 96 Precious Metals Explor ation Assets 97 Iron Ore Vale (Iron Ore, Cu, Au & Other) 104 LIORC (Iron Ore) 106 Other Mining NuevaUnión (Relincho) (Cu, Au, Mo) 107 Taca Taca (Cu, Au, Mo) 108 Milpillas (Cu) 109 Falcondo (Ni) 109 Rosemont/Copper World (Cu, Mo, Ag, Au) 110 Robinson (Cu, Au) 111 EaglePicher (De) 111 Ring of Fire (Cr, Ni, Cu, PGM) 112 Mt Keith (Ni) 113 Flying Fox (Ni) 114 Diversified Explor ation Assets 114 U.S. Energy Marcellus 118 Haynesville 119 SCOOP/STACK 120 Permian Basin 121 Canadian Energy Weyburn Unit 122 Orion 123 Energy Exploration Assets 126 Precious Metals Diversified PRECIOUS METALS/DIVERSIFIED Asset Index Precious Metals
FRANCO-NEVADA CORPORATION 37 THE GOLD INVESTMENT THAT WORKS PRECIOUS METALS The description and depiction of our assets in this Asset Handbook has been simplified for presentation purposes. More detailed and current information may be available in our previous and subsequent disclosure and on our website. Mineral Reserves and Mineral Resources information for 2020 and 2019 is provided for comparative purposes only. For a detailed breakdown of the 2020 and 2019 Mineral Reserves and Mineral Resources, please refer to our AIF for each of the years ended December 31, 2020 and December 31, 2019, respectively available on SEDAR at www.sedar.com. DIVERSIFIED ASSETS RESERVES AND RESOURCES ADDITIONAL INFORMATION Precious Metals Diversified PRECIOUS METALS/DIVERSIFIED Alphabetical Asset Index Diversified Assets Agnew (Vivien) (Au) 93 Antamina (Ag) 41 Antapaccay (Au & Ag) 40 Aphrodite (Au) 95 Bald Mountain (Au) 58 Brucejack (Au & Ag) 70 Calcatreu (Au & Ag) 47 Canadian Malartic (Au) 75 Candelaria (Au & Ag) 39 Cariboo (Au) 83 Cascabel (Alpala) (Au) 45 Castle Mountain (Au) 61 CentroGold (Gurupi) (Au) 46 Cerro Moro (Au & Ag) 43 Cobre Panama (Au & Ag) 49 Condestable (Au & Ag) 42 Courageous Lake (Au) 81 Detour Lake (Au) 67 Dublin Gulch (Eagle) (Au) 72 Duketon (Au) 90 Edikan (Au) 91 Eskay Creek (Au & Ag) 80 Fire Creek/Midas (Au & Ag) 62 Gold Quarry (Au) 55 Golden Highway (Au) 77 Goldfields (Au) 81 Goldstrike (Au) 54 Granite Creek (Pinson) (Au) 65 Greenstone (Hardrock) (Au) 78 Guadalupe-Palmarejo (Au) 51 Hemlo (Au) 69 Hollister (Au) 63 Island Gold (Au) 76 Karma (Au) 89 Kirkland Lake (Au) 71 Kiziltepe (Au & Ag) 93 Marigold (Au) 56 Matilda (Wiluna) (Au) 92 Mesquite (Au) 60 Monument Bay (Au) 82 Musselwhite (Au) 73 MWS (Au) 85 Pandora (PGM) 94 Perama Hill (Au) 96 Posse (Mara Rosa) (Au & Ag) 46 Precious Metals Explor ation Assets 97 Red Lake (Bateman) (Au) 80 Red Mountain (Au) 82 Sabodala (Au) 86 Salares Norte (Au & Ag) 44 San Jorge (Au) 47 Séguéla (Au) 96 Sissingué (Au) 94 South Arturo (Au) 59 South Kalgoorlie (Au) 92 Sterling (Au) 65 Stibnite Gold (Au) 64 Stillwater (PGM) 53 Subika (Ahafo) (Au) 88 Sudbury (PGM & Au) 68 Tasiast (Au) 87 Timmins West (Au) 74 Valentine Lake (Au) 79 Yandal (Bronzewing) (Au) 95 Diversified Exploration Assets 114 EaglePicher (De) 111 Energy Exploration Assets 126 Falcondo (Ni) 109 Flying Fox (Ni) 114 Haynesville 119 LIORC (Iron Ore) 106 Marcellus 118 Milpillas (Cu) 109 Mt Keith (Ni) 113 NuevaUnión (Relincho) (Cu, Au, Mo) 107 Orion 123 Permian Basin 121 Ring of Fire (Cr, Ni, Cu, PGM) 112 Robinson (Cu, Au) 111 Rosemont/Copper World (Cu, Mo, Ag, Au) 110 SCOOP/STACK 120 Taca Taca (Cu, Au, Mo) 108 Vale (Iron Ore, Cu, Au & Other) 104 Weyburn Unit 122
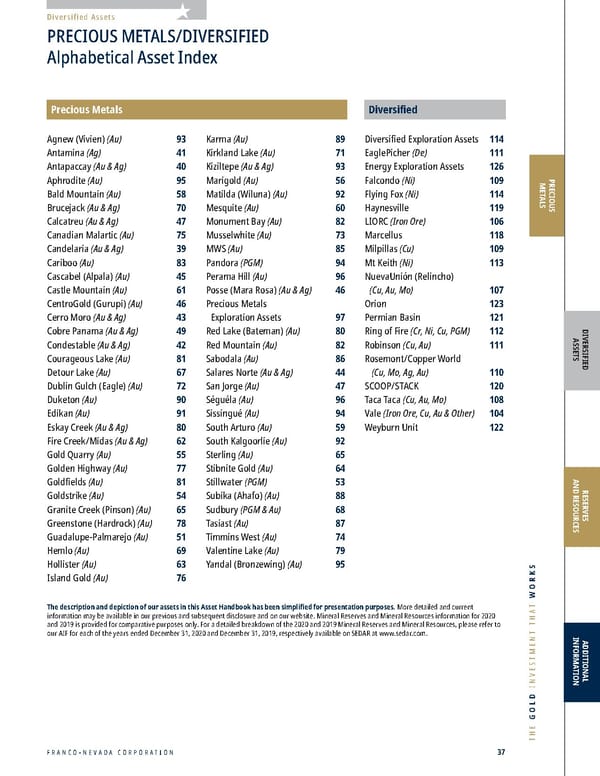
2022 ASSET HANDBOOK 38 FNV TSX NYSE Millmerran Red October Henty Mt Keith Duketon Yandal (Bronzewing/Julius) King Vol Bowen Basin South Kalgoorlie (Mt Martin) Flying Fox Australia Subika (Ahafo) Tasiast Sabodala Edikan MWS Perama Hill Kiziltepe Karma Sissingue Pandora Franco-Nevada Australia Office CentroGold (Gurupi) Cerro Moro San Jorge Antamina Salares Norte/ Rio Baker Antapaccay Candelaria Calcatreu Agate Creek White Dam Condestable Séguéla Edna May Higginsville (Lake Cowan) Aphrodite Matilda (Wiluna) Agnew (Vivien) South Kalgoorlie (New Celebration/ Mt Marion Lithium) Cue Gold (Day Dawn) Agi Dagi ̆ ̆ Producing Advanced Producing (Energy) Cascabel (Alpala) Posse (Mara Rosa) Producing Advanced PRECIOUS METALS SOUTH AMERICA
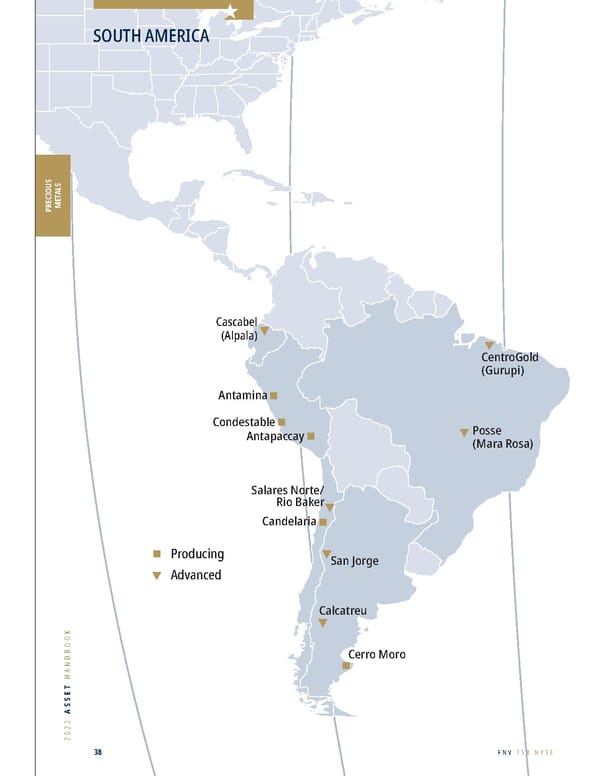
FRANCO-NEVADA CORPORATION 39 THE GOLD INVESTMENT THAT WORKS N Kilometres 0 2.5 Candelaria Gold and Silver Stream Candelaria Mining Property Area of Interest Ojos del Salado Mining Property Tierra Amarilla Santos Mine Copiapo Candelaria North (U/G) Alcaparrosa Mine Candelaria Pit Candelaria South (U/G) La Espanola PRECIOUS METALS In November 2014, Franco-Nevada (Barbados) Corporation, a subsidiary of Franco-Nevada, acquired a gold and silver stream on production from the Candelaria operation in Chile. Lundin Mining Corporation (“Lundin”) is the operator of the project and owns 80% of the asset with the balance owned by Sumitomo Corporation and its affiliates. Franco-Nevada provided an up-front deposit of $655 million to acquire the gold and silver stream from what is primarily a copper mine. The funds were used to finance a portion of the cost paid by Lundin to acquire the asset from Freeport-McMoRan Inc. Candelaria is an established mining operation and the transaction was the first material instance of a royalty/streaming company partnering with an operating company to purchase a producing asset. The str eam covers the current property position of approximately 150 km 2 . An additional defined area of interest effectively doubles the property position. Should Lundin acquire properties located within the area of interest, Franco-Nevada has the option to purchase a gold and silver stream which will apply to the additional ore from such properties. The str eam covers 68% of the payable gold and silver from 100% of the mine which reduces to 40% after 720,000 ounces of gold and 12 million ounces of silver have been delivered to Franco-Nevada, which are currently expected to occur in late 2026 and late 2027, respectively. Cumulatively, 427,690 ounces of gold and 6.8 million ounces of silver have been delivered since acquisition until December 31, 2021. Franco-Nevada pays an ongoing price equal to the lesser of $420.40 per ounce of gold and $4.20 per ounce of silver or the then prevailing spot price for gold and silver 2021 2020 2019 Revenue to Franco-Nevada ($ million) $ 116.5 $ 106.8 $ 103.1 P&P Reserves (koz Au) 1 2,700 2,800 2,700 M&I Resource (koz Au) 1 5,600 5,600 4,900 Inferred Resource (koz Au) 1 500 300 300 P&P Reserves (moz Ag) 1 39.0 39.0 38.0 M&I Resource (moz Ag) 1 83.0 78.0 66.0 Inferred Resource (moz Ag) 1 7.0 4.0 4.0 P&P Royalty Ounces (000s) 2 851 920 840 M&I Royalty Ounces (000s) 1, 2 1,586 1,629 1,338 Inf Royalty Ounces (000s) 2 125 75 68 1 Please r efer to the tables on pages 128-136 for a breakout of grade and tonnages by Mineral Resource category; all M&I categories are inclusive of Mineral Reserves 2 For Ro yalty Ounce calculation, Franco-Nevada estimates P&P Royalty Ounces include payable metal of the balance of the 720,000 ounces of gold and 12 million ounces of silver remaining and the balance of P&P Reserves subject to the lower stream percentage. For M&I Royalty Ounces, Franco-Nevada has assumed the P&P Royalty Ounces with the balance of M&I Resources subject to the lower stream percentage. For Inf Royalty Ounces, Franco-Nevada assumes Inferred Mineral Resources are subject to the lower stream percentage. Silver is converted to Royalty Ounces assuming $1,800/oz gold and $23.00/oz silver ($1,750/oz gold and $25.00/oz silver in 2020, $1,400/oz gold and $18.00/oz silver in 2019). The stream interest has been factored by 77% to reflect $1,800 per ounce gold and $420.40 per ounce ongoing payments (76% in 2020, 71% in 2019) for each ounce delivered under the stream. This price escalates by 1% per annum in October of each year. The Candelaria mine was disco vered in 1987 and the open pit has been in operation since 1993. The operation also includes the Candelaria North and South, Santos and Alcaparrosa underground mines. Lundin has made a significant investment in exploration at Candelaria. With the exploration success, Lundin has extended the go forward mine life from 2028, when it acquired Candelaria, to 2044. Lundin has successfully added to the Mineral Reserves and Mineral Resources at the four underground mines and has discovered the La Española open-pit deposit which is located partly on the stream concession and partly on ground covered by Franco-Nevada’s area of interest. Fr anco-Nevada sold 65,034 GEOs from the mine in 2021, compared with 59,655 GEOs in 2020. In 2022, Franco-Nevada expects sales from its Candelaria stream to be between 60,000 and 70,000 GEOs. DIVERSIFIED ASSETS RESERVES AND RESOURCES ADDITIONAL INFORMATION Candelaria Au & Ag Chile, South America Operator: Lundin Mining Corporation Stream: Gold and Silver Stream Precious Metals South America Updated plan extends life of mine to 2040 Successfully increased reserves and resources at four underground mines; demonstrating continued strong exploration potential Pacific Ocean ARGENTINA BOLIVIA PERU BRAZIL CHILE Candelaria Millmerran Red October Henty Mt Keith Duketon Yandal (Bronzewing/Julius) King Vol Bowen Basin South Kalgoorlie (Mt Martin) Flying Fox Australia Subika (Ahafo) Tasiast Sabodala Edikan MWS Perama Hill Kiziltepe Karma Sissingue Pandora Franco-Nevada Australia Office CentroGold (Gurupi) Cerro Moro San Jorge Antamina Salares Norte/ Rio Baker Antapaccay Candelaria Calcatreu Agate Creek White Dam Condestable Séguéla Edna May Higginsville (Lake Cowan) Aphrodite Matilda (Wiluna) Agnew (Vivien) South Kalgoorlie (New Celebration/ Mt Marion Lithium) Cue Gold (Day Dawn) Agi Dagi ̆ ̆ Producing Advanced Producing (Energy) Cascabel (Alpala) Posse (Mara Rosa) Producing Advanced Lundin Mining Corporation Candelaria, Chile
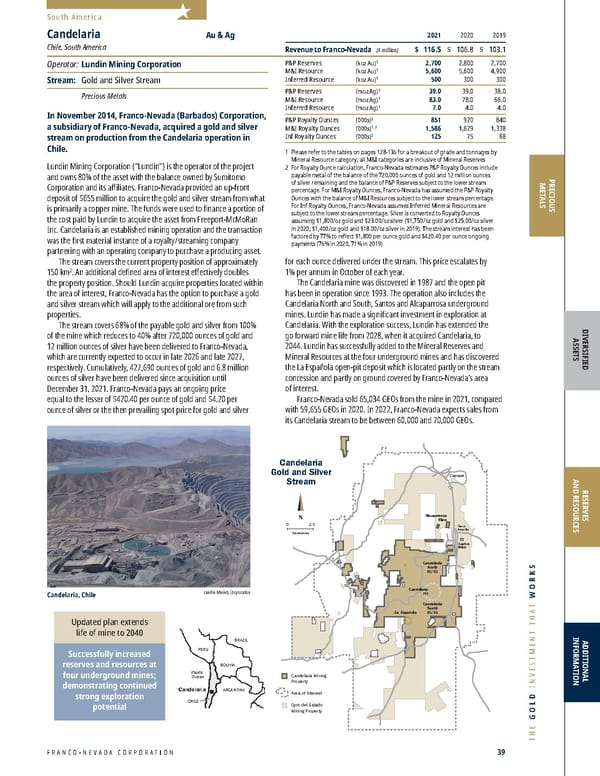
2022 ASSET HANDBOOK 40 FNV TSX NYSE South America In February 2016, Franco-Nevada (Barbados) Corporation, a subsidiary of Franco-Nevada, acquired a precious metals stream on production from the Antapaccay mine for $500 million from Glencore plc (“Glencore”) and its subsidiaries. Antapaccay is located within the province of Espinar in Southern Peru – a district with a long mining history. The property also hosts the historic Tintaya open-pit mine and related infrastructure which began operating in 1984. Glencore (Xstrata) invested in excess of $1.5 billion of initial capital to build and commission the Antapaccay open-pit mine and plant, which commenced operations in 2012. Under the str eaming agreement, gold and silver deliveries are initially referenced to copper in concentrate shipped. Franco-Nevada will receive 300 ounces of gold and 4,700 ounces of silver for each 1,000 tonnes of copper in concentrate shipped, until 630,000 ounces of gold and 10 million ounces of silver have been delivered, which is currently expected to occur in 2028. Cumulatively, 350,840 ounces of gold and 5.5 million ounces of silver have been delivered since acquisition until December 31, 2021. Thereafter, Franco-Nevada will receive 30% of the gold and silver shipped. Franco-Nevada will initially pay an on-going price of 20% of the spot price of gold and silver until 750,000 ounces of refined gold and 12.8 million ounces of refined silver have been delivered. Thereafter, the on-going price will increase to 30% of the spot price of gold and silver. The str eam is referenced to the entire Antapaccay concession covering approximately 997 km 2 . Glencore is considering developing the Coroccohuayco deposit which is located within 10 km of the 2021 2020 2019 Revenue to Franco-Nevada ($ million) $ 111.6 $ 118.5 $ 100.4 P&P Reserves (koz Au) 1 1,222 1,204 1,892 M&I Resource (koz Au) 1 3,279 3,161 3,082 Inferred Resource (koz Au) 1 383 201 265 P&P Reserves (moz Ag) 1 17.6 17.2 38.3 M&I Resource (moz Ag) 1 70.6 65.4 66.7 Inferred Resource (moz Ag) 1 6.2 2.5 3.7 P&P Royalty Ounces (000s) 2 440 469 652 M&I Royalty Ounces (000s) 1, 2 868 861 889 Inf Royalty Ounces (000s) 2 72 34 47 1 Please r efer to the tables on pages 128-136 for a breakout of grade and tonnages by Mineral Resource category; all M&I categories are inclusive of Mineral Reserves 2 For Ro yalty Ounce calculation, Franco-Nevada estimates P&P Royalty Ounces include payable metal of the remaining deliveries before the 630,000 ounces of gold and 10 million ounces of silver hurdle with the balance of Mineral Reserves subject to a 30% stream. For M&I Royalty Ounces, Franco-Nevada assumes the P&P Royalty Ounces with the balance of M&I Resources subject to the 30% stream. For Inferred Royalty Ounces, Franco-Nevada assumes Inferred Mineral Resources are subject to the 30% stream. Silver has been converted to Royalty Ounces assuming $1,800/oz gold and $23.00/oz silver ($1,750/oz gold and $25.00/oz silver in 2020, $1,400/oz gold and $18.00/oz silver in 2019). The stream interest has been factored by different ongoing payments of 20% of the spot price of gold and silver on the first 750,000 ounces of gold and 12.8 million ounces of silver and 30% of the spot price thereafter Antapaccay plant. The project has been rescoped as an open pit with mine planning currently at the PFS level. Coroccohuayco hosts M&I Mineral Resources of 643 million tonnes with a copper grade that is approximately 50% higher than the Antapaccay Mineral Reserves. In addition, there are a number of large-scale regional targets and prospects on the Antapaccay concessions. Fr anco-Nevada sold 62,411 GEOs from the mine in 2021, compared with 65,901 GEOs in 2020, and in 2022 expects sales from its Antapaccay stream to be between 47,500 and 57,500 GEOs due to expected lower grades partly due to a planned pit lay-back. Antapaccay has a planned mine life to 2033 which would be further extended by any development of Coroccohuayco. Antapaccay Au & Ag Peru, South America Operator: Glencore plc Stream: Gold and Silver Stream Precious Metals Gold and silver deliveries initially referenced to copper in concentrate shipped Potential for Coroccohuayco to extend mine life Land package of 997 km 2 offers a number of large-scale regional targets PRECIOUS METALS Antapaccay Precious Metals Stream Not included Antapaccay Pit Coroccohuayco Km 0 10 Antapaccay Concession Area Antapaccay Concession area covers ~997 km 2 * Tintaya Pit/ Tailings Storage Antapaccay Plant Tintaya Plant 8 Km Pacific Ocean ARGENTINA BOLIVIA PERU BRAZIL COLOMBIA EQUADOR CHILE Antapaccay Antapaccay, Peru
FRANCO-NEVADA CORPORATION 41 THE GOLD INVESTMENT THAT WORKS In October 2015, Franco-Nevada acquired a silver stream for $610 million on production from the Antamina mine in Peru from Teck Resources Limited (“Teck”). Teck has a 22.50% interest in Compañía Minera Antamina S.A. (“CMA”), the Antamina joint venture company, along with partners BHP Billiton Plc (33.75%), Glencore (33.75%) and Mitsubishi Corporation (10.00%). Antamina is an established mine that commenced operations in 2001 and is one of the lowest cost copper operations globally. Silver sold for 2021 was 3.8 million ounces for Fr anco-Nevada’s attributable production under the stream, with 2.8 million ounces sold in 2020. Antamina experienced a temporary shutdown due to COVID-19 in 2020. Franco-Nevada expects attributable production in 2022 to be towards the higher end of our long-term expected annual range of 2.8 million to 3.2 million silver ounces. The stream is based on recovered silver from Teck’s attributable 22.50% interest in the Antamina mine, subject to a fixed silver payability of 90%. Franco-Nevada pays 5% of the spot silver price for each ounce of silver delivered under the stream. The stream will reduce by one-third after 86 million ounces of silver have been delivered. A total of 21.8 million cumulative ounces of silver have been delivered to Franco-Nevada as of December 31, 2021. 2021 2020 2019 Revenue to Franco-Nevada ($ million) $ 94.1 $ 57 $ 44.9 P&P Reserves (moz Ag) 1 107.0 118.3 135.1 M&I Resource (moz Ag) 1 324.9 342.5 334.7 Inferred Resource (moz Ag) 1 447.7 460.7 463.6 P&P Royalty Ounces (000s) 2 201 231 237 M&I Royalty Ounces (000s) 1, 2 585 642 575 Inf Royalty Ounces (000s) 2 560 599 543 1 Please r efer to the tables on pages 128-136 for a breakout of grade and tonnages by Mineral Resource category; all M&I categories are inclusive of Mineral Reserves 2 For Ro yalty Ounce calculation, Franco-Nevada assumes 22.5% of Teck’s interest in Antamina is subject to our stream interest and that the stream reduces by 33% once 86 million silver ounces have been delivered. Silver has been converted to Royalty Ounces assuming $1,800/oz gold and $23.00/oz ($1,750/oz gold and $25.00/oz in 2020, $1,400/oz gold and $18.00/oz in 2019). The stream interest has been factored by ongoing payments of 5% of the spot price of silver Antamina Ag Peru, South America Operator: Teck Resources Limited (owns 22.50%) Stream: Silver Stream Precious Metals South America High grade copper/zinc orebody One of the lowest cost copper operations globally Large, high grade Inferred Mineral Resource South America Antamina Paramonga Pativilca Lima Barranca Huacho Huaral Chancay Pto. Supe Cutatambo Autopista Panamericana Norte Autopista Panamericana Norte Cajacay Chasquitambo Conococha Carretera Pativilca-Huarez Huarmey Punta Lobitos CMA Puerto Minero Aquia Chiquian Catac Pachacoto Recuay Huaraz Huallanca Huanzala Yanashall Machac Huari San Marcos Chavui De Huantar PARQUE NACIONAL HUASCARAN Subestacion Linea de Transmision Electrica CMA Pipeline PERU Pacific Ocean N Miles 0 60 Antamina Silver Stream Inclusive of Miner al Reserves, the mine contains total Measured and Indicated Mineral Resources of approximately 925 million tonnes of ore (with a silver grade of 10.9 g/t) and an Inferred Mineral Resource of 1.26 billion tonnes of ore (with a silver grade of 11.0 g/t). Total Mineral Reserves are 336 million tonnes of ore (with a silver grade of 9.9 g/t), which are currently constrained by tailings disposal capacity. Based on currently permitted tailings storage capacity, the mine life is expected to continue until 2028. CMA is currently conducting engineering studies for additional tailings storage options and alternative mine plans that could result in significant mine life extensions. Any mine life extension will require a modification of Antamina’s current Environmental Impact Assessment certificate, a process that began in October 2019 with the submission of the study area and common terms of reference to Peruvian regulators for a mine life extension to 2036. A decision in respect of the requested modification is expected in 2023. Historically, a high level of Inferred Mineral Resources have converted to Measured and Indicated Mineral Resources and ultimately to Mineral Reserves. Beyond the known Mineral Reserves and Mineral Resources, Antamina hosts additional potential open-pit and bulk/selective underground targets. There is also regional exploration potential over a large, prospective land package greater than 700 km 2 . PRECIOUS METALS DIVERSIFIED ASSETS RESERVES AND RESOURCES ADDITIONAL INFORMATION Antamina, Peru
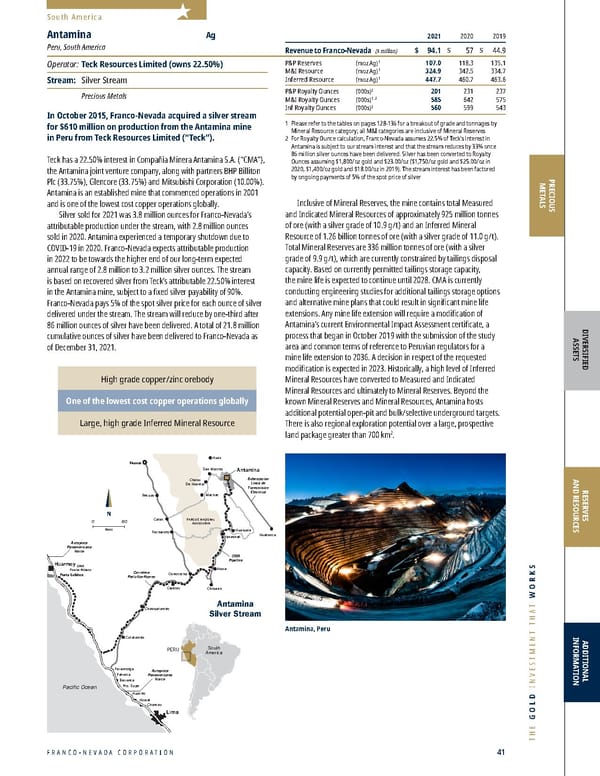
2022 ASSET HANDBOOK 42 FNV TSX NYSE Santiago Antofagasta Arequipa Cusco Mina Justa Cerro Pelado Santo Domingo Teresa de Colm’o Punta del Cobre Mantoverde El Espino Panulcillo IOCG Deposit Lima La Paz Salta N 0 250 Kilometers Condestable Candelaria Cretaceous IOCG Belt IOCG Mine (FNV Stream) Pacific Ocean Bolivia Argentina Chile Peru Condestable UG Surface Facilities Raul UG V inchos UG Pacific Ocean N 0 5 Kilometers Condestable Gold and Silver Stream Condestable Mining Property 102 km to Lima Pan American Hwy On March 8, 2021, Franco-Nevada (Barbados) Corporation, a subsidiary of Franco-Nevada, closed a precious metals stream on production from the Condestable mine in Peru, for an up-front deposit of $165 million. The Condestable mine is located approximately 90 km south of Lima, Peru, and is owned and operated by a majority-owned subsidiary of Southern Peaks Mining LP (“SPM”), a private company . The Condestable mine has a demonstrated operating track record of over 50 years with a proven history of resource conversion. For the first 5 years of the str eaming agreement, commencing on January 1, 2021 and ending December 31, 2025, Franco-Nevada will receive 8,760 ounces of gold and 291,000 ounces of silver annually until a total of 43,800 ounces of gold and 1,455,000 ounces of silver have been delivered (the “Fixed Deliveries”). Thereafter, Franco-Nevada will receive 63% of the contained gold and contained silver produced until a cumulative total of 87,600 ounces of gold and 2,910,000 ounces of silver have been delivered (the “Variable Phase 1 Deliveries”). The stream then reduces to 25% over the remaining life of mine (the “Variable Phase 2 Deliveries”). Franco-Nevada will pay 20% of the spot price for gold and silver for each ounce delivered under the stream (the “Ongoing Payment”). The stream has an effective date of January 1, 2021, with the first quarterly delivery received on March 15, 2021. For a period of four years fr om closing, subject to certain restrictions, a subsidiary of SPM may, at its option, make a one-time special delivery comprising the number of ounces of refined gold equal to $118.8 million at the then current spot price subject to the Ongoing Payment, to achieve the early payment of the Fixed Deliveries and Variable Phase 1 Deliveries. The Variable Phase 2 Deliveries would commence immediately thereafter. The str eam is referenced to the entire Condestable concessions covering approximately 450 km 2 with excellent near mine exploration upside. SPM is currently ramping up processing capacity at the Condestable mine from 7,000 tpd to 8,400 tpd and is advancing a feasibility study on additional plant capacity expansion to 10,000 tpd. 2021 2020 2019 Revenue to Franco-Nevada ($ million) $ 22.5 $ – $ – P&P Reserves (koz Au) 1 170 n/a – M&I Resource (koz Au) 1 701 711 – Inferred Resource (koz Au) 1 480 481 – P&P Reserves (moz Ag) 1 5.2 n/a – M&I Resource (moz Ag) 1 17.6 17.9 – Inferred Resource (moz Ag) 1 12.3 12.3 – P&P Royalty Ounces (000s) 2 n/a n/a – M&I Royalty Ounces (000s) 1, 2 180 188 – Inf Royalty Ounces (000s) 2 89 92 – 1 Please r efer to the tables on pages 128-136 for a breakout of grade and tonnages by Mineral Resource category; all M&I categories are inclusive of Mineral Reserves 2 For Ro yalty Ounce calculation, Franco-Nevada estimates fixed deliveries for M&I Royalty Ounces of 8,760 ounces of gold and 291,000 ounces of silver per year until December 2025; then, 63% of gold and silver until 87,600 ounces of gold and 2,910,000 ounces of silver are delivered, respectively; thereafter, 25% of gold and silver ounces are subject to the stream. For Inferred Royalty Ounces, Franco-Nevada assumes 25% of gold and silver from Inferred Mineral Resources (25% in 2020) are subject to the stream. Silver has been converted to Royalty Ounces assuming $1,800/oz gold and $23.00/oz ($1,750/oz gold and $25.00/oz in 2020). The stream interest has been factored by ongoing payments of 20% of the spot price of gold and silver Condestable Au & Ag Peru, South America Operator: Southern Peaks Mining LP Stream: Gold and Silver Stream Precious Metals Proven operation with excellent potential for expansions and mine life extension (over 50-year operating history) Large, prospective land package of approximately 450 km 2 Santiago Antofagasta Arequipa Cusco Mina Justa Cerro Pelado Santo Domingo Teresa de Colm’o Punta del Cobre Mantoverde El Espino Panulcillo IOCG Deposit Lima La Paz Salta N 0 250 Kilometers Condestable Candelaria Cretaceous IOCG Belt IOCG Mine (FNV Stream) Pacific Ocean Bolivia Argentina Chile Peru Condestable UG Surface Facilities Raul UG V inchos UG Pacific Ocean N 0 5 Kilometers Condestable Gold and Silver Stream Condestable Mining Property 102 km to Lima Pan American Hwy South America PRECIOUS METALS Condestable, Peru
FRANCO-NEVADA CORPORATION 43 THE GOLD INVESTMENT THAT WORKS Cerro Moro Royalty Area 2% NSR Royalty Claim Area Not Included Under 2% NSR N Kilometres 0 5 Michelle Zoe Deborah Martina Tres Lomas Esperanza Loma Escondida N Buenos Aires Cerro Moro CHILE ARGENTINA BRAZIL BOLIVIA URUGUAY PARAGUAY Carla Elsa Escondida Nini Nini Ext Natalia Natalia NW PLANT Franco-Nevada has a 2% NSR on the Cerro Moro mine operated by Yamana Gold Inc. (“Yamana”) in Santa Cruz province, Argentina. The royalty covers approximately 160 km 2 of the property including a significant portion of the mineral resources which are contained in high-grade epithermal gold and silver veins. Construction at Cerr o Moro was completed in 2018 with commercial production being declared in June 2018. For 2021, actual production was 79,988 ounces of gold and 5.582 million ounces of silver. Production benefitted from access to additional mining faces, which supported an increase in mill feed coming from higher-grade underground ore. 2022 production at Cerro Moro is expected to be 95,000 ounces of gold, with silver production expected to be 5.3 million ounces of silver. Yamana’s long-term plan at Cerro Moro is to create ten-years of sustainable production of at least 160,000 gold equivalent ounces 1 per year. Y amana continues to report exploration success and mine life extension in its 10-year outlook for Cerro Moro. If Yamana implements both a plant expansion and added heap leach project, along with conversion of known exploration targets to mineral resources, it is anticipated that Cerro Moro could produce at least 200,000 gold equivalent ounces 1 per year. Yamana has initiated an infill drilling program to expand and define the most promising lower-grade, heap leach targets. New mineral reserves added in 2021 at a higher average gold to silver ratio, as well as higher grade silver targets, will be followed up with drilling in 2022. 1 Please r efer to Yamana’s public disclosures for further details on its definition of gold equivalent ounces. 2021 2020 2019 Revenue to Franco-Nevada ($ million) $ 4.9 $ 4.1 $ 5.1 P&P Reserves (koz Au) 2 457 431 529 M&I Resource (koz Au) 2 574 521 706 Inferred Resource (koz Au) 2 226 254 273 P&P Reserves (moz Ag) 2 22.2 23.9 30.5 M&I Resource (moz Ag) 2 30.0 30.1 44.3 Inferred Resource (moz Ag) 2 8.2 8.8 15.5 P&P Royalty Ounces (000s) 3 15 15 18 M&I Royalty Ounces (000s) 2, 3 18 18 24 Inf Royalty Ounces (000s) 3 6 7 9 2 Please r efer to the tables on pages 128-136 for a breakout of grade and tonnages by Mineral Resource category; all M&I categories are inclusive of Mineral Reserves 3 For Ro yalty Ounce calculation, Franco-Nevada estimates 100% of the Mineral Reserves, 95% of the M&I Mineral Resources (95% in 2020, 95% in 2019) and 95% of the Inferred Mineral Resources (95% in 2020, 95% in 2019) are subject to our royalty interest and estimates a rate of 2.0% is applicable. Silver has been converted assuming $1,800/oz gold and $22.00/oz silver ($1,750/oz gold and $25.00/oz silver in 2020, $1,400/oz gold and $18.00/oz silver in 2019) Cerro Moro Au & Ag Argentina, South America Operator: Yamana Gold Inc. Royalty: NSR: 2% Precious Metals South America PRECIOUS METALS DIVERSIFIED ASSETS RESERVES AND RESOURCES ADDITIONAL INFORMATION High grade gold/silver deposit with expansion potential Significant near-mine and regional exploration targets Cerro Moro, Argentina
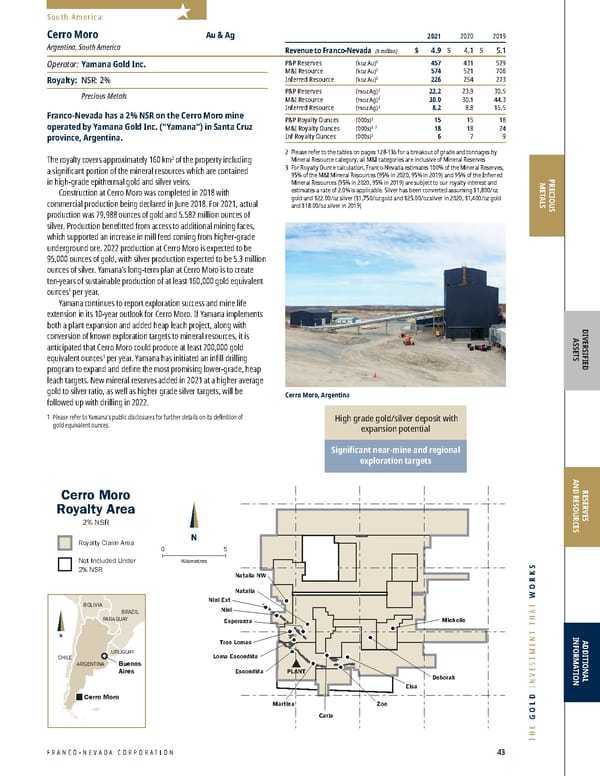
2022 ASSET HANDBOOK 44 FNV TSX NYSE In early 2019, Franco-Nevada acquired an existing 2% NSR on the Salares Norte project being advanced by Gold Fields Limited (“Gold Fields”) in the Atacama region of Northern Chile. The royalty is subject to a 1% buyback by Gold Fields within 24 months of announcing commercial production, for $6.0 million. In September 2020, Franco-Nevada acquired an additional 2% NSR on all mineral production from Gold Fields’ Rio Baker concessions for $5.0 million in cash with contingent payments of up to $8.0 million. The Rio Baker claims cover the North-West extension of the Salares Norte deposit and the royalty acquisition provided Franco-Nevada with exposure to 100% of the Salares Norte project. Salar es Norte is a blind epithermal gold and silver deposit and represents one of Gold Fields’ key development projects. Gold Fields’ 2019 feasibility study for the project included a Mineral Reserve containing 3.5 million ounces of gold and 39.3 million ounces of silver (21.1 million tonnes grading 5.1 g/t gold and 57.9 g/t silver). The feasibility study envisaged an open-pit mining operation with an initial mine life of 11.5 years, producing 450,000 ounces of gold equivalent 1 per year for the first 7 years. Construction of the Salar es Norte mine commenced in 2020 and pre-stripping of the pit and construction of the processing plant started in January 2021. Gold Fields reported that the project remains on schedule for first production in the first quarter of 2023 and expects to continue exploring near-mine potential and to test district potential. In February 2022, Gold Fields announced that it forecasts production to build up to 203,000 ounces of gold equivalent 1 in 2023 and 550,000 ounces of gold equivalent 1 in 2024. 1 Please r efer to Gold Fields’ public disclosures for further details on its definition of gold equivalent. 2021 2020 2019 Revenue to Franco-Nevada ($ million) $ – $ – $ – P&P Reserves (koz Au) 2 3,476 3,476 3,476 M&I Resource (koz Au) 2 3,804 3,804 3,800 Inferred Resource (koz Au) 2 109 109 110 P&P Reserves (moz Ag) 2 39.3 39.3 39.3 M&I Resource (moz Ag) 2 42.9 42.9 42.9 Inferred Resource (moz Ag) 2 0.7 0.7 0.8 P&P Royalty Ounces (000s) 3 40 81 80 M&I Royalty Ounces (000s) 2, 3 44 88 87 Inf Royalty Ounces (000s) 3 1 2 2 2 Please r efer to the tables on pages 128-136 for a breakout of grade and tonnages by Mineral Resource category; all M&I categories are inclusive of Mineral Reserves 3 For Ro yalty Ounce calculation, Franco-Nevada estimates 100% of the Mineral Reserves & Mineral Resources (100% in 2020, 100% in 2019) are subject to our royalty interest and estimates a rate of 1.0% (2.0% in 2020, 2.0% in 2019) in anticipation that Gold Fields exercises its right to repurchase 1.0% of the 2.0% NSR. Silver has been converted assuming $1,800/oz gold and $23.00/oz silver ($1,750/oz gold and $25.00/oz silver in 2020, $1,400/oz gold and $18.00/oz silver in 2019) Salares Norte Au & Ag Chile, South America Operator: Gold Fields Limited Royalty: NSR: 1-2% Precious Metals Production remains on schedule for Q1 2023 Feasibility report estimates initial 11.5-year mine life Positive near-mine exploration serves to potentially extend mine Brecha Principal N Salares Norte Royalty Area Agua Amarga Salares Norte Rio Baker 0.5 Kilometre 0 1 High-grade gold sub-domains 2017 EIA pit outline Main low-grade domains Antofagasta La Serena Santiago Copiapo Relincho CHILE ARGENTINA BOLIVIA PERU Vizcachitas San Jorge Taca Taca Salares Norte South America PRECIOUS METALS Salares Norte, Chile
FRANCO-NEVADA CORPORATION 45 THE GOLD INVESTMENT THAT WORKS In 2020, Franco-Nevada acquired a 1% NSR on the Alpala copper-gold-silver project located in northern Ecuador being advanced by SolGold plc (“SolGold”). Alpala is a copper-gold porphyry deposit and represents one of the largest copper-gold projects being advanced globally. The royalty covers nearly 50 km 2 of the Cascabel mining concessions including the Alpala and the Tandayama-America (“TAM”) deposit. The Cascabel pr oject is owned by Exploraciones Novamining SA, which is held 85% by SolGold and 15% by Cornerstone Capital Resource Inc. The royalty is in reference to all minerals produced with the option by Franco-Nevada to convert the royalty to a gold NSR for a period of time once Alpala is producing. Franco-Nevada is further entitled to receive certain minimum royalty payments starting in 2028. The royalty agreement includes an option to buy back 50% of the royalty for a period of time. SolGold completed a pr eliminary economic assessment on Alpala in 2019 and is currently advancing a prefeasibility study on the Cascabel project which it expects to release in Q2 2022. The Measured and Indicated Mineral Resource in the preliminary economic assessment include a high-grade core containing 12.3 million ounces of gold, 3.8 million tonnes of copper, and 33.3 million ounces of silver (442 million tonnes grading 0.86 g/t Au, 0.87% Cu, and 2.34 g/t Ag). In total, the Measured and Indicated Mineral Resources contain 21.7 million ounces of gold, 9.9 million tonnes of copper, and 92.2 million ounces of silver (2,663 million tonnes grading 0.25 g/t gold, 0.37% Cu and 1.08 g/t silver). The preliminary economic assessment study contemplates a large-scale underground block cave operation with an initial mine life of more than 50 years, producing 207,000 tonnes of copper, 438,000 ounces of gold, and 1.4 million ounces of silver per year for the first 25 years (under the 50 Mtpa mining scenario). The upcoming pr efeasibility study is expected to consider a lower throughput, but higher-grade operation, while maintaining expansion potential to optimize the upfront capital and construction schedules. Explor ation has yielded encouraging results on the broader Cascabel concessions with the identification of a highly mineralized 2021 2020 2019 Revenue to Franco-Nevada ($ million) $ – $ – $ – P&P Reserves (Mlbs Cu) 1 – – – M&I Resource (Mlbs Cu) 1 22,994 21,826 – Inferred Resource (Mlbs Cu) 1 4,012 2,866 – P&P Reserves (koz Au) 1 – – – M&I Resource (koz Au) 1 22,900 21,700 – Inferred Resource (koz Au) 1 3,140 1,900 – P&P Reserves (moz Ag) 1 – – – M&I Resource (moz Ag) 1 92.2 92.2 – Inferred Resource (moz Ag) 1 10.6 10.6 – P&P Royalty Ounces (millions) 2 – – – M&I Royalty Ounces (millions) 1, 2 621 601 – Inf Royalty Ounces (millions) 2 99 69 – 1 Please r efer to the tables on pages 128-136 for a breakout of grade and tonnages by Mineral Resource category; all M&I categories are inclusive of Mineral Reserves 2 For Ro yalty Ounce calculation, Franco-Nevada estimates 100% of the Mineral Reserves and Mineral Resources are subject to our royalty interest and estimates a rate of 1.0% (0.85% for copper Royalty Ounces which factors a NSR smelting charge of 15%). Copper has been converted to Royalty Ounces assuming $3.50 per pound and silver has been converted to Royalty Ounces assuming $1,800/oz gold and $23.00/oz silver ($1,750/oz gold and $25.00/oz silver in 2020) Cascabel (Alpala) Au Ecuador, South America Operator: SolGold plc Royalty: NSR: 1% Precious Metals South America PRECIOUS METALS DIVERSIFIED ASSETS RESERVES AND RESOURCES ADDITIONAL INFORMATION system at TAM, located approximately 3 km north of the Alpala deposit, and covered by the Franco-Nevada royalty. SolGold declared a maiden mineral resource at TAM in October 2021 comprising 233.0 million tonnes at 0.33% copper equivalent containing 0.53 million tonnes of copper and 1.20 million ounces of gold in the Indicated category , plus 197.0 million tonnes at 0.39% copper equivalent containing 0.52 million tonnes of copper and 1.24 million ounces of gold in the Inferred category. The TAM deposit has open-pit mining potential. The Alpala underground project is a long lead time project with full production not expected until after 2030. Access to open pit material may enable initial production to potentially start as early as 2026. Cascabel (Alpala), Ecuador One of the largest copper-gold development projects in the world Prefeasibility study expected in Q2 2022 Alpala Northwest High-grade core Alpala Upper Zone Alpala Deeps >0.15% CuEq >0.7% CuEq >1.5% CUEq Cascabel (Alpala) Cross Section Looking West N 0 1 Kilometer Hwy Transverse Frontier 0.1% Copper Equivalent 0.4% Copper Equivalent 1.0% Copper Equivalent Tracks Royalty Claim Area Alpala Rocafuerte Alpala Camp Tandayama America Aguinaga 1.0% CuEq 0.1% CuEq 0.4% CuEq 0.1% CuEq 0.1% CuEq Site Office Cascabel (Alpala) 1% NSR Area
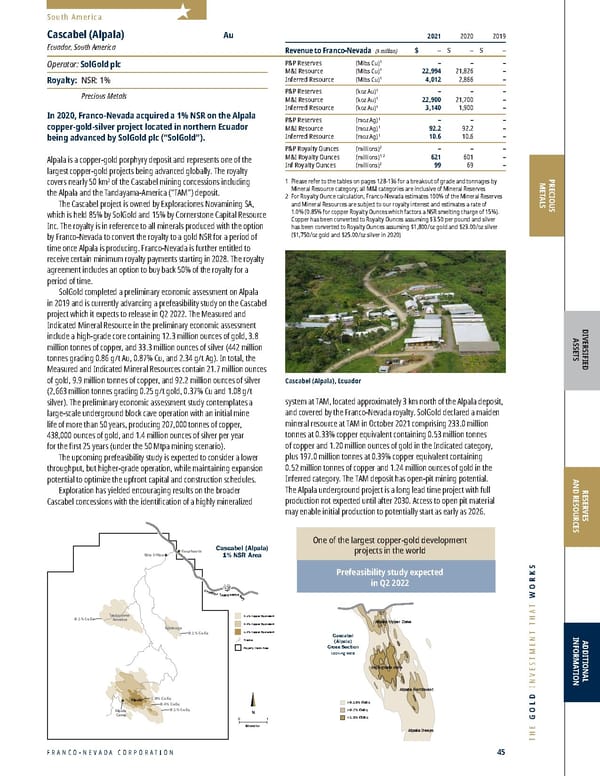
2022 ASSET HANDBOOK 46 FNV TSX NYSE Other South America Assets South America Precious Metals Please refer to the tables on pages 128-136 for a breakout of grade and tonnages by Mineral Resource category. Franco-Nevada holds a 1% NSR royalty on the Posse open-pit project located in Mara Rosa in the State of Goiás, Brazil. Hochschild Mining Plc (“Hochschild”) acquired the project through its acquisition of Amarillo Gold Corporation (“Amarillo”) in April 2022. Hochschild has revised the August 2020 feasibility study prepared by Amarillo and the updated mine plan forecasts a 10-year mine life with average annual gold production of 80,000 ounces of gold per year with 100,000 ounces of gold per year over the first 4 years of production. The brownfield project benefits from existing infrastructure and received the License to Install from state regulators in February 2021 and approval for a power line in October 2021. Hochschild is targeting for construction to start in 2022, with production commencing in 2024. For Royalty Ounce calculation, Franco-Nevada estimates 100% of Mineral Reserves and Mineral Resources are subject to our royalty interest and estimates an average rate of 1.0% is applicable Posse (Mara Rosa) Au Brazil, South America Operator: Hochschild Mining Plc Royalty: NSR: 1% Precious Metals Franco-Nevada holds a sliding scale NSR royalty (1% at greater than $400 per ounce gold) on the CentroGold (Gurupi) project located in the State of Maranhão in northern Brazil. Oz Minerals Limited (“Oz Minerals”) acquired the previous operator, Avanco Resources Limited (“Avanco”), in 2018. Avanco completed a 100% earn-in agreement on the project with Jaguar Mining Inc. in October 2017. In July 2019, Oz Minerals released an updated prefeasibility study on the project which envisioned a 10-year mine life with average annual gold production of 100,000-120,000 ounces of gold per year with 190,000-210,000 ounces of gold per year in the first 2 years of production. There is currently a mining license injunction for the property but Oz Minerals is continuing with a community engagement program and is focused on permitting and relocation activities. The relocation plan required for progressing the court injunction removal has been completed and was submitted to the National Institute of Colonization and Agrarian Reform (INCRA). Oz Minerals has stated that a resource update, feasibility study and regional exploration will commence following the removal of the injunction. For Royalty Ounce calculation, Franco-Nevada estimates 100% of Mineral Reserves and Mineral Resources are subject to our royalty interest and estimates an average rate of 1.0% is applicable CentroGold (Gurupi) Au Brazil, South America Operator: Oz Minerals Limited Royalty: NSR: 0-1% Precious Metals South America PRECIOUS METALS
FRANCO-NEVADA CORPORATION 47 THE GOLD INVESTMENT THAT WORKS Other South America Assets South America Precious Metals Please refer to the tables on pages 128-136 for a breakout of grade and tonnages by Mineral Resource category. Franco-Nevada has a 2.5% NSR on the Calcatreu property in Argentina. Calcatreu is an epithermal gold-silver deposit located in the Province of Rio Negro. In December 2017, Patagonia Gold PLC (“Patagonia”) acquired the property from Pan American Silver Corp. (“Pan American Silver”). The Calcatreu deposit contains an Indicated Mineral Resource of 669,000 ounces of gold and 6.3 million ounces of silver (9.8 million tonnes grading 2.11 g/t gold and 19.83 g/t silver) and an Inferred Mineral Resource of 348,000 ounces of gold and 3.4 million ounces of silver (8.1 million tonnes grading 1.34 g/t gold and 13.09 g/t silver). Field work for a baseline environmental study continued in 2021, along with drilling, surface exploration and geophysics. Additional work, including new trenching and sampling, is planned to follow-up on positive geochemical results and a new ground magnetic survey was conducted in the southern part of the project. Exploration activities on the property have continued to move the project forward in 2021 and Patagonia's objective is for the completion of a prefeasibility study in 2022. For Royalty Ounce calculation, Franco-Nevada estimates 100% of Mineral Reserves and Mineral Resources are subject to our royalty interest and estimates an average rate of 2.5% is applicable Calcatreu Au & Ag Argentina, South America Operator: Patagonia Gold PLC Royalty: NSR: 2.5% Precious Metals San Jorge is a copper-gold porphyry project located in the Province of Mendoza, Argentina. Although the project is currently on care and maintenance, under the revised terms of the royalty agreement Franco-Nevada received annual payments of $1.25 million per year for a 10-year period which ended in 2021, with a subsequent 7.5% NSR on all gold produced from the property. Aterra Investments Ltd. and Solway Industries Ltd. acquired the property from Coro Mining Corp. in April 2015. Franco-Nevada acquired the royalty on the San Jorge property through its acquisition of Lumina Royalty Corp. in December 2011. For Royalty Ounce calculation, Franco-Nevada estimates 100% of Mineral Reserves and Mineral Resources are subject to our royalty interest and estimates an average rate of 7.5% is applicable San Jorge Au Argentina, South America Operator: Aterra Investments Ltd. and Solway Industries Ltd. Royalty: NSR: 7.5% Precious Metals South America PRECIOUS METALS DIVERSIFIED ASSETS RESERVES AND RESOURCES ADDITIONAL INFORMATION
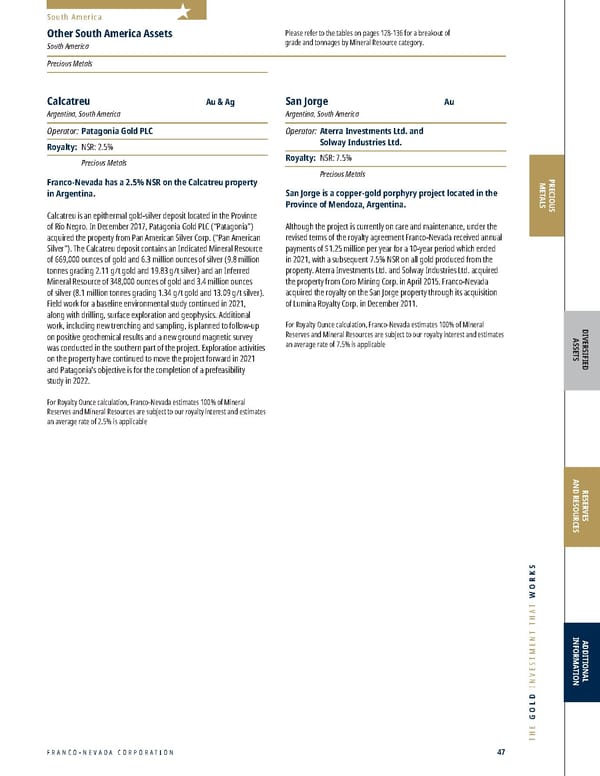
2022 ASSET HANDBOOK 48 FNV TSX NYSE Millmerran Red October Henty Mt Keith Duketon Yandal (Bronzewing/Julius) King Vol Bowen Basin South Kalgoorlie (Mt Martin) Flying Fox Australia Subika (Ahafo) Tasiast Sabodala Edikan MWS Perama Hill Kiziltepe Karma Sissingue Pandora Franco-Nevada Australia Office Agate Creek White Dam Séguéla Edna May Higginsville (Lake Cowan) Aphrodite Matilda (Wiluna) Agnew (Vivien) South Kalgoorlie (New Celebration/ Mt Marion Lithium) Cue Gold (Day Dawn) Agi Dagi ̆ ̆ Producing Advanced Producing (Energy) Cobre Panama Guadalupe-Palmarejo Producing PRECIOUS METALS CENTRAL AMERICA AND MEXICO
FRANCO-NEVADA CORPORATION 49 THE GOLD INVESTMENT THAT WORKS PRECIOUS METALS Camp Caribbean Sea Punta Rincón River Caimito N 4 km Cobre Panama Plant Site Concession Boundary Power Transmission 230 kv line Property located approximately 20 km from Caribbean Sea * Cobre Panama Project Panama City Panama Canal Pacific Ocean Caribbean Sea Port and Powerplant Balboa Pit Colina Pit Valle Grande Pit Botija Pit Brazo Pit Medio Pit Botija Abajo Pit 2021 2020 2019 Revenue to Franco-Nevada ($ million) $ 235.0 $ 135.4 $ 64.7 P&P Reserves (koz Au) 1, 2 7,104 7,298 7,120 M&I Resource (koz Au) 1, 2 7,396 7,318 7,658 Inferred Resource (koz Au) 1, 2 1,301 1,133 1,307 P&P Reserves (moz Ag) 1, 2 133.0 135.5 138.9 M&I Resource (moz Ag) 1, 2 152.9 153.5 157.1 Inferred Resource (moz Ag) 1, 2 38.1 36.4 38.2 P&P Royalty Ounces (000s) 2, 3 4,743 4,893 4,575 M&I Royalty Ounces (000s) 1, 2, 3 4,973 5,010 4,906 Inf Royalty Ounces (000s) 2, 3 769 706 772 1 Please r efer to the tables on pages 128-136 for a breakout of grade and tonnages by Mineral Resource category; all M&I categories are inclusive of Mineral Reserves 2 Miner al Reserves and Mineral Resources and the related Royalty Ounces are based on publicly disclosed information as of March 11, 2022 and do not reflect First Quantum’s updated estimate 3 For Ro yalty Ounce calculation, Franco-Nevada assumes 88% of the Mineral Reserves and Mineral Resources are subject to our stream interest. Silver has been converted into Royalty Ounces assuming $1,800/oz gold and $23.00/oz silver ($1,750/oz gold and $25.00/silver in 2020, $1,400/oz gold and $18.00/oz silver in 2019) and a 62% (62% in 2020, 60% in 2019) factor has been applied to obtain a Royalty Ounce for the P&P category, a 61% (62% in 2020, 59% in 2019) factor has been applied for Royalty Ounces in the M&I category and a 50% factor has been applied for Royalty Ounces in the Inferred category until the mill throughput reached 58 Mtpa, Franco-Nevada was entitled to a 5% return on its capital invested. The return will be achieved by a $100 per gold ounce discount in the ongoing price for the initial ounces acquired. Throughput in 2021 was 81 Mtpa and the plant has since been operating at the annualized rate of 85 Mtpa for several months. First Quantum is executing the 100 Mtpa expansion project at Cobre Panama (“CP100”), with completion of construction works and commencement of commissioning targeted for the first quarter of 2023. This will allow for a ramp-up of production over the course of the year, achieving a throughput rate of 100 Mtpa by the end of 2023. Cobre Panama has a planned mine life in excess of 35 years. The delivery of pr ecious metals to Franco-Nevada is indexed to the copper in concentrate shipped. Franco-Nevada sold 131,062 GEOs from the mine in 2021, compared to 76,348 GEOs in 2020. In 2022, Franco-Nevada expects GEO sales from its Cobre Panama stream to be between 120,000 and 140,000 GEOs, relatively consistent with 2021. With r espect to the ongoing Law 9 discussions, First Quantum reported that the Government of Panama tabled a new proposal, namely that the Government should receive $375 million in benefits per year from Cobre Panama and that the existing revenue royalty payable to the Government will be replaced by a gross profit royalty. The parties continue to finalize the details behind these proposed principles. Franco-Nevada does not expect the current proposal to have a material impact on future deliveries pursuant to its stream agreement. On Mar ch 28, 2022, First Quantum released its updated Annual Information Form including updated Mineral Reserves and Mineral Resources for Cobre Panama as at December 31, 2021. Mineral Reserves of 6,861,000 gold ounces and 128,810,000 silver ounces were reported (2,935.9 million tonnes grading 0.07 g/t Au and 1.36 g/t Ag), with M&I Resources inclusive of Reserves of 7,159,000 gold ounces and 149,182,000 silver ounces (3,471.6 million tonnes grading 0.06 g/t Au and 1.34 g/t Ag), and Inferred Resources of 1,296,000 gold ounces and 37,990,000 silver ounces (1,090.4 million tonnes grading 0.04 g/t Au and 1.08 g/t Ag). Continued on next page DIVERSIFIED ASSETS RESERVES AND RESOURCES ADDITIONAL INFORMATION Cobre Panama Au & Ag Panama, Central America & Mexico Operator: First Quantum Minerals Ltd. Stream: Gold and Silver Stream Precious Metals Cobre Panama is one of the world’s largest copper-gold- silver porphyry deposits in operation and is 90% owned by First Quantum Minerals Ltd. (“First Quantum”) and 10% by Korea Resources Corp. (“KORES”). Franco-Nevada (Barbados) Corporation, a subsidiary of Franco-Nevada, contributed a total of $1.36 billion to the construction of Cobr e Panama. Franco-Nevada has two precious metals streams with slightly different terms: • Fix ed Payment Stream - Effective since 2015 and applies to First Quantum’s original 80% interest in Cobre Panama. • Floating Payment Str eam - Effective March 2018, Franco-Nevada (Barbados) Corporation added a new precious metals stream which increased its coverage to 100% of the ownership of the Cobre Panama operation. The Floating Payment Stream applies to First Quantum 's 10% indirect interest acquired from LS-Nikko Copper Inc. and KORES’ 10% indirect interest. The amount of pr ecious metals deliverable under both the Fixed Payment Stream and Floating Payment Stream is currently indexed to the copper in concentrate shipped until certain specified thresholds of gold and silver deliveries are met, currently expected to occur in 2028. The main difference between the Fixed Payment Stream and Floating Payment Stream is the ongoing price per ounce paid. As of November 2021, the current ongoing payment of the Fixed Payment Stream is fixed per ounce payments of $443.93/oz gold and $6.66/oz silver with a 1.5% annual inflation factor. The Floating Payment Stream ongoing price per ounce for deliveries is 20% of the spot price for the curr ent Mineral Reserve life and higher thereafter. First Quantum intr oduced first ore into the milling circuit on February 11, 2019 at Cobre Panama and the project achieved commercial production on September 1, 2019. From January 1, 2019 Expansion to achieve target throughput of 100 Mtpa during 2023 Concession covers an area of approximately 130 km 2 Low-cost operation close to tidewater Central America and Mexico Millmerran Red October Henty Mt Keith Duketon Yandal (Bronzewing/Julius) King Vol Bowen Basin South Kalgoorlie (Mt Martin) Flying Fox Australia Subika (Ahafo) Tasiast Sabodala Edikan MWS Perama Hill Kiziltepe Karma Sissingue Pandora Franco-Nevada Australia Office Agate Creek White Dam Séguéla Edna May Higginsville (Lake Cowan) Aphrodite Matilda (Wiluna) Agnew (Vivien) South Kalgoorlie (New Celebration/ Mt Marion Lithium) Cue Gold (Day Dawn) Agi Dagi ̆ ̆ Producing Advanced Producing (Energy) Cobre Panama Guadalupe-Palmarejo Producing
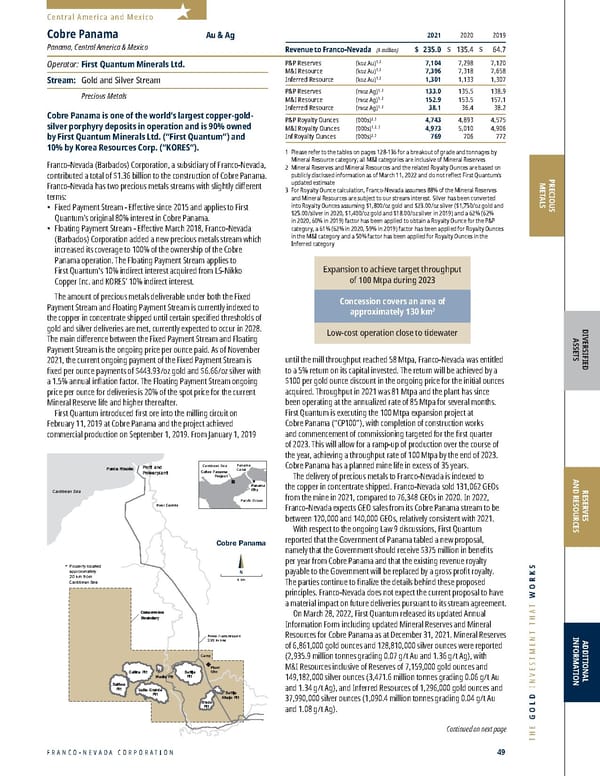
2022 ASSET HANDBOOK 50 FNV TSX NYSE Central America and Mexico PRECIOUS METALS Cobre Panama is one of the world’s largest copper-gold- silver porphyry deposits in operation. Franco-Nevada contributed a total of $1.36 billion to its construction and has two precious metals streams. “ ” Continued from page 49 Cobre Panama, Panama
FRANCO-NEVADA CORPORATION 51 THE GOLD INVESTMENT THAT WORKS Guadalupe-Palmarejo Gold Stream Palmarejo Agua Salada Mill Guadalupe Mine Complex Independencia East Km 0 4 Perimeter of gold stream property La Nación La Bavisa Independencia West Zapata La Patria Independencia Mine Complex Non-stream ground 1 Please r efer to the tables on pages 128-136 for a breakout of grade and tonnages by Mineral Resource category; all M&I categories are inclusive of Mineral Reserves 2 For Ro yalty Ounce calculation, Franco-Nevada estimates 86% of the Mineral Reserves (84% in 2020, 81% in 2019), 90% of the exclusive M&I Mineral Resource (89% in 2020, 96% in 2019) and 88% of the Inferred Mineral Resource (87% in 2020, 88% in 2019) are subject to our 50% stream interest. The stream interest has been factored by 56% to reflect $1,800 per ounce gold ($1,750/oz gold in 2020, $1,400/oz gold in 2019) and $800 per ounce ongoing payments (54% in 2020, 43% in 2019) Guadalupe-Palmarejo Au Mexico, Central America & Mexico Operator: Coeur Mining, Inc. Stream: 50% Gold Stream Precious Metals Since January 2009, Franco-Nevada has received 50% of the gold produced from the Palmarejo operation located in Chihuahua Province, Mexico which is owned and operated by Coeur Mining, Inc. (“Coeur”). Palmarejo is a silver project with a considerable gold by-product. In June 2014, Fr anco-Nevada (Barbados) Corporation, a subsidiary of Franco-Nevada, entered into a new 50% gold stream with Coeur on the Palmarejo project with ongoing payments equal to the lesser of $800 per ounce (no inflation provision) and the then prevailing spot price for gold for each ounce delivered under the new gold stream agreement. The new agreement improved mine economics for Coeur and helped extend the mine life of the entire Palmarejo operation. The agreement applies to a land position totaling over 1,200 km 2 . Franco-Nevada provided an upfront $22 million deposit which was used to partially fund the development of the Guadalupe underground mine on the Palmarejo property. In the third quarter of 2016, the original stream agreement terminated once Coeur delivered the minimum ounce obligation of 400,000 ounces under that agreement. Fr anco-Nevada sold 46,506 ounces of gold from the mine in 2021, compared to 44,696 ounces of gold in 2020. Franco-Nevada estimates that over 80% of the existing Mineral Reserves and Mineral Resources are covered by the stream agreement. Production from the La Nación deposit, which straddles the stream ground border and is located between the Independencia and Guadalupe underground mines, started in early Q3 2019 with the majority of Mineral Reserves from La Nación falling on stream ground. Coeur drilled appr oximately 74,200 meters at the Palmarejo property in 2021, conducting infill drilling at Guadalupe and Independencia as well as targeting zones of mineralization near both mine complexes. 2021 2020 2019 Revenue to Franco-Nevada ($ million) $ 83.4 $ 79.0 $ 49.7 P&P Reserves (koz Au) 1 884 849 693 M&I Resource (koz Au) 1 1,931 1,462 1,118 Inferred Resource (koz Au) 1 246 280 367 P&P Royalty Ounces (000s) 2 211 194 120 M&I Royalty Ounces (000s) 1, 2 467 342 207 Inf Royalty Ounces (000s) 2 60 66 69 Exploration success has grown Mineral Reserves and Mineral Resources Mineral Reserves growing by approximately 4% in 2021 versus previous 2020 estimate, net of depletion Pacific Ocean NM TX CA AZ MEXICO Guadalupe- Palmarejo PRECIOUS METALS DIVERSIFIED ASSETS RESERVES AND RESOURCES ADDITIONAL INFORMATION Central America and Mexico Guadalupe-Palmarejo, Mexico
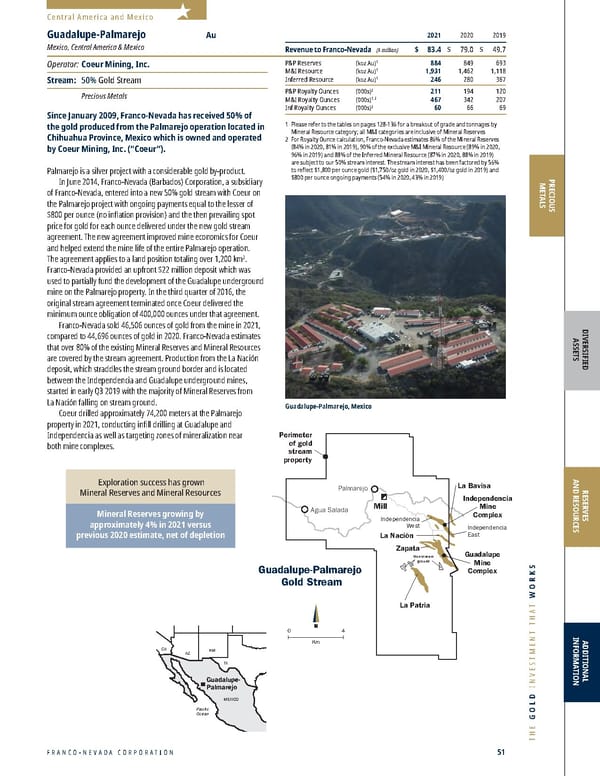
2022 ASSET HANDBOOK 52 FNV TSX NYSE Millmerran Red October Henty Mt Keith Duketon Yandal (Bronzewing/Julius) King Vol Bowen Basin South Kalgoorlie (Mt Martin) Flying Fox Sterling Robinson Fire Creek Bald Mountain Marigold Midas Goldstrike Gold Quarry South Arturo Hollister Nevada Australia Subika (Ahafo) Tasiast Sabodala Edikan MWS Perama Hill Kiziltepe Karma Sissingue Pandora Castle Mountain Mesquite Nevada Stibnite Gold Franco-Nevada Australia Office Agate Creek White Dam Séguéla Edna May Higginsville (Lake Cowan) Aphrodite Matilda (Wiluna) Agnew (Vivien) South Kalgoorlie (New Celebration/ Mt Marion Lithium) Cue Gold (Day Dawn) Agi Dagi ̆ ̆ Producing Advanced Producing (Energy) Stillwater Granite Creek (Pinson) Producing Advanced PRECIOUS METALS UNITED STATES
FRANCO-NEVADA CORPORATION 53 THE GOLD INVESTMENT THAT WORKS N Stillwater Complex (Plan View) 5% NSR Franco-Nevada Royalty Land Franco- Nevada Royalty Franco- Nevada Royalty East Boulder Portal Site East Boulder Adit Stillwater Mill Site Camp Lake Boulder River East Boulder River Dr y Fork Creek Lewis Gulch West Fork Stillwater Stillwater River Limit of Claims Sweetgrass Co. Park Co. Stillwater Co. Sweetgrass Co. 1 Mile County line Stillwater Complex (Long Section) Not to scale Current and future planned production layouts Non-Royalty mill area Blitz Stillwater Mine East Boulder Mine Stillwater Wyoming Washington BC AB SK MB North Dakota Nebraska Nevada Oregon Idaho Utah California Colorado Montana South Dakota Millmerran Red October Henty Mt Keith Duketon Yandal (Bronzewing/Julius) King Vol Bowen Basin South Kalgoorlie (Mt Martin) Flying Fox Sterling Robinson Fire Creek Bald Mountain Marigold Midas Goldstrike Gold Quarry South Arturo Hollister Nevada Australia Subika (Ahafo) Tasiast Sabodala Edikan MWS Perama Hill Kiziltepe Karma Sissingue Pandora Castle Mountain Mesquite Nevada Stibnite Gold Franco-Nevada Australia Office Agate Creek White Dam Séguéla Edna May Higginsville (Lake Cowan) Aphrodite Matilda (Wiluna) Agnew (Vivien) South Kalgoorlie (New Celebration/ Mt Marion Lithium) Cue Gold (Day Dawn) Agi Dagi ̆ ̆ Producing Advanced Producing (Energy) Stillwater Granite Creek (Pinson) Producing Advanced PRECIOUS METALS DIVERSIFIED ASSETS RESERVES AND RESOURCES ADDITIONAL INFORMATION United States 2021 2020 2019 Revenue to Franco-Nevada ($ million) $ 57.8 $ 50.9 $ 39.8 P&P Reserves (koz PGM) 1 27,300 26,883 25,614 M&I Resource (koz PGM) 1 45,000 35,747 33,950 Inferred Resource (koz PGM) 1 44,600 45,327 45,910 P&P Royalty Ounces (000s) 2, 3 1,237 1,308 993 M&I Royalty Ounces (000s) 1, 3 2,040 1,739 1,316 Inf Royalty Ounces (000s) 2, 3 2,021 2,205 1,780 1 Please r efer to the tables on pages 128-136 for a breakout of grade and tonnages by Mineral Resource category; all M&I categories are inclusive of Mineral Reserves 2 For Ro yalty Ounce calculation, Franco-Nevada estimates 98% of the Mineral Reserves and Mineral Resources are subject to our royalty interest 3 Given mor e significant smelting and refining charges, Franco-Nevada estimates an average rate of 4.50% is applicable (assuming 10% for charges) and PGM ounces converted into Royalty Ounces assuming $1,000/ounce Pt and $2,100/ounce Pd ($1,100/ounce Pt and $2,200/ounce Pd in 2020, $1,050/ounce Pt and $1,300/ounce Pd in 2019) The Stillwater complex in Eastern Montana is comprised of the Stillwater mine (West and East) and East Boulder mine and is operated by Sibanye-Stillwater, following the acquisition of Stillwater Mining Company by Sibanye Gold Limited in May 2017. Production began in 1986 at the Stillwater mine and in 2002 at the East Boulder mine. Both are PGM mines with the majority of production being palladium. Fr anco-Nevada has a 5% NSR royalty on all commercially recoverable metals produced from 813 of the 995 claims that cover the Stillwater complex. The amount of the royalty is reduced by permissible “onward processing” deductions, which have averaged between 10-12% of revenue over the last several years. Based on Fr anco-Nevada’s estimates, the NSR royalty currently covers 97% of the Stillwater Mineral Reserves and 100% of the East Boulder Mineral Reserves. In recent years, the percentage of Stillwater complex production subject to Franco-Nevada’s royalty has increased well above 90% as mining moves away from the shaft area towards royalty ground. PGM pr oduction for 2021 yielded 570,400 ounces versus 603,067 ounces in 2020, which included production from Stillwater East (the Blitz project), as discussed below. Production in the second half of 2021 was affected by ongoing operational restrictions imposed after a fatal incident at the Stillwater West mine in June 2021. Factoring in these operational constraints at the Stillwater complex, 2022 PGM production is forecast to be between 550,000 to 580,000 ounces. Stillwater East (the Blitz pr oject), located east of the Stillwater mine (Stillwater West) and covered by the NSR, commenced production in October 2017. Stillwater East continues to ramp up despite various operational challenges and COVID-19 related disruptions. Production forecasts from Stillwater East are currently exceeding plan and increasing output is expected to partially offset the negative production impact at Stillwater West. When production is at steady state the run rate is expected to be approximately 300,000 ounces per annum starting in 2024. Sibanye-Stillwater estimates that the Stillwater mine has a mine life of 40 years and the East Boulder mine has a mine life of 34 years. Significant Mineral Resources have the potential to increase mine life even further in the future. Only PGM producer in the U.S. Mineral Reserves support a long mine life Significant Mineral Resource has the potential to increase mine life even further Stillwater PGM Montana, United States Operator: Sibanye-Stillwater Royalty: NSR: 5% Precious Metals Stillwater, Montana
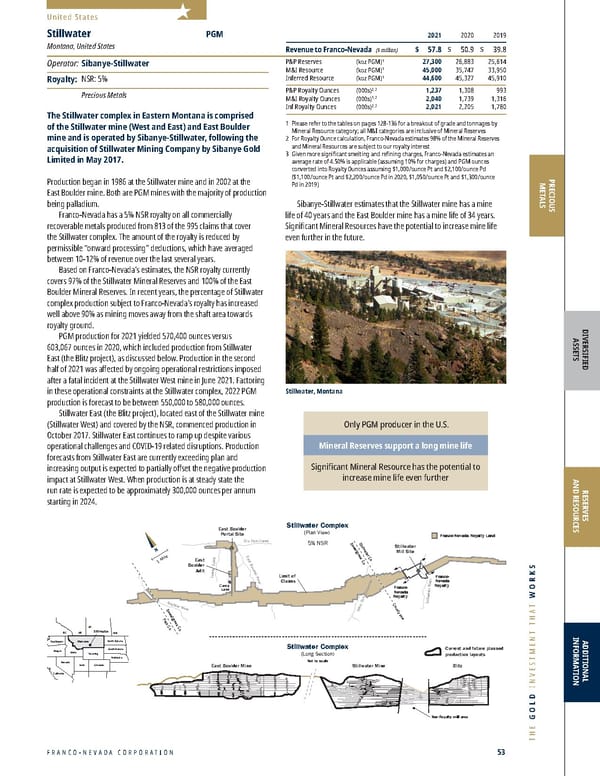
2022 ASSET HANDBOOK 54 FNV TSX NYSE PRECIOUS METALS United States Carlin Trend 2021 2020 2019 P&P Reserves (koz Au) 1, 2 17,886 19,512 21,138 M&I Resource (koz Au) 1, 2 30,894 30,894 29,268 Inferred Resource (koz Au) 1, 2 7,480 2,602 1,951 P&P Royalty Ounces (000s) 3 188 205 202 M&I Royalty Ounces (000s) 1, 3 324 324 279 Inf Royalty Ounces (000s) 3 79 27 19 Goldstrike Au 2021 2020 2019 Total NSR Revenue to FNV ($ million) $ 3.9 $ 5.2 $ 4.2 Total NPI Revenue to FNV ($ million) $ 21.4 $ 15.5 $ 17.0 Total Revenue to FNV ($ million) $ 25.3 $ 20.7 $ 21.2 P&P Reserves (koz Au) 1 n/a n/a n/a M&I Resource (koz Au) 1, 2 n/a n/a n/a Inferred Resource (koz Au) 1 n/a n/a n/a P&P Royalty Ounces (000s) 3 n/a n/a n/a M&I Royalty Ounces (000s) 2, 3 n/a n/a n/a Inf Royalty Ounces (000s) 3 n/a n/a n/a 1 Please r efer to the tables on pages 128-136 for a breakout of grade and tonnages by Mineral Resource category for Carlin Trend; all M&I categories are inclusive of Mineral Reserves 2 Under the Ne vada Gold Mines joint venture, Barrick now reports Goldstrike, Gold Quarry and South Arturo as part of the Carlin operation category. Mineral Reserves and Mineral Resources include Goldstrike, Gold Quarry and South Arturo as well as other properties where Franco-Nevada has no royalties or stream interests 3 For Ro yalty Ounce calculation, Franco-Nevada estimates 35% of the Carlin Trend Mineral Reserves and Mineral Resources are subject to our royalty interests on Goldstrike, Gold Quarry and South Arturo and estimates an average rate of 3.0% is applicable 1 Please r efer to the table above for the Carlin Trend Mineral Reserves and Mineral Resources which include Goldstrike 2 All M&I categories ar e inclusive of Mineral Reserves 3 Please r efer to the table above for the Carlin Trend Royalty Ounce calculation which includes Goldstrike Goldstrike Au Nevada, United States Operator: Nevada Gold Mines LLC Royalty: NSR: 2-4% / NPI: 2.4-6% Precious Metals Franco-Nevada holds royalties covering the majority of the Nevada Gold Mines LLC (“Nevada Gold Mines”) Goldstrike complex operated by Barrick Gold Corporation (“Barrick”). The Goldstrike complex is located on the Carlin Trend, about 60 km northwest of the town of Elko, Nevada and includes the open-pit Betze-Post mine, as well as the underground operations of Meikle and Rodeo immediately to the north. Mining activity commenced on the property in 1976 and, since 1987, has been operated by Barrick. Fr anco-Nevada holds both NSR (2-4%) and NPI (2.4-6%) royalties at Goldstrike covering over 50% of the reported Mineral Reserves. This estimate includes low-grade ore that has been stockpiled. The royalties vary depending on the claim blocks, operating costs and capital investments, as shown in the schematic. As a result, royalty payments can vary substantially on a quarterly basis. Franco-Nevada anticipates royalty production in 2022 to be similar to that of 2021. On July 1, 2019, Barrick (61.5%) and Ne wmont Corporation (“Newmont”) (38.5%) combined their significant assets across Nevada to create Nevada Gold Mines as a joint venture. Under this joint venture, Goldstrike is reported as part of the Carlin operation category by Barrick. Barrick announced 2021 production of 923,000 gold ounces from its 61.5% share of Carlin which includes Goldstrike, Gold Quarry and South Arturo as well as other properties where Franco-Nevada has no royalties interests. Nevada Gold Mines reported that repairs for a mechanical mill failure at the Goldstrike roaster, which affected Q3 2021 production, were completed by the end of September. Mitigating actions taken in Q3 2021 also included the prioritization of ore to optimize roaster throughput and recoveries, which positively impacted Q4 2021 production. Barrick has r eported 2022 production guidance of 950,000 to 1,030,000 gold ounces from its 61.5% share of Carlin. Exploration projects being contemplated to provide upside in the future include a Goldstrike underground expansion and a potential Goldstrike 6NW open-pit layback. World class gold operation Focus asset for Barrick with substantial invested capital Profit royalties provide more leverage to gold prices N Goldstrike Mine Goldstrike Open Pit Mine Goldstrike Underground Mine Meikle/Rodeo SJ 6% NPI SPLC Lease 6% NPI Post 5% NPI 4% NSR Goldstrike 5% NPI 4% NSR Bazza 2% NSR Bazza Strip 2% NSR 2.4% NPI Royal 3% NSR Extension 5% NPI 4% NSR Gold Bug 5% NPI 4% NSR Corbett 2% NSR Pandora 2% NSR Weimer 4% NSR Rodeo Creek 4% NSR Above 4600’ 1 Mile Goldstrike Pacific Ocean Oregon Idaho Utah Nevada California Arizona MEXICO Goldstrike, Nevada
FRANCO-NEVADA CORPORATION 55 THE GOLD INVESTMENT THAT WORKS PRECIOUS METALS DIVERSIFIED ASSETS RESERVES AND RESOURCES ADDITIONAL INFORMATION United States N Gold Quarry Mine 7.29% NSR Gold Quarry Open Pit 0.5 Mile Potential Greater Gold Quarry Expansion West Wall Layback 7.29% NSR Gold Quarry Pacific Ocean Oregon Idaho Utah Nevada California Arizona MEXICO 2021 2020 2019 Revenue to Franco-Nevada ($ million) $ 7.5 $ 10.7 $ 15.6 P&P Reserves (koz Au) 1 n/a n/a n/a M&I Resource (koz Au) 1, 2 n/a n/a n/a Inferred Resource (koz Au) 1 n/a n/a n/a P&P Royalty Ounces (000s) 3 n/a n/a n/a M&I Royalty Ounces (000s) 2, 3 n/a n/a n/a Inf Royalty Ounces (000s) 3 n/a n/a n/a 1 Please r efer to the table on page 54 for the Carlin Trend Mineral Reserves and Mineral Resources which include Gold Quarry. In 2018 Newmont did not disclose Mineral Reserves and Mineral Resources for individual assets in Nevada 2 All M&I categories ar e inclusive of Mineral Reserves 3 Please r efer to the table on page 54 for the Carlin Trend Royalty Ounce calculation which includes Gold Quarry Gold Quarry Au Nevada, United States Operator: Nevada Gold Mines LLC Royalty: NSR: 7.29% Precious Metals The Gold Quarry operation is part of the Nevada Gold Mines Carlin operations in north-central Nevada. It is a large open-pit mine that has been in production since 1985 supplying ore as part of an integrated mining and processing complex. In 2019, Barrick (61.5%) and Newmont (38.5%) combined their significant assets across Nevada to create Nevada Gold Mines as a joint venture. Under this joint venture, Barrick reports Gold Quarry under its Carlin operations category and Newmont reports Gold Quarry under its Nevada Gold Mines category. Fr anco-Nevada’s royalty interest covers only a portion of the Gold Quarry property, as shown in the schematic. The Gold Quarry royalty is a 7.29% NSR based on production with a minimum payment obligation. The different annual minimum royalty payments are tied to Mineral Reserves and stockpiles attributed to the Gold Quarry royalty property. Through optimized pit shells, Gold Quarry was able to deliver year-over-year total open-pit resource growth at consistent Annual minimum payment obligations Benefits from additional milling and roasting infrastructure following the formation of Nevada Gold Mines Registered on private lands grades. Notably, mineral resource estimates were further optimized based on process routing options only made possible with the multiple processing facilities available following the formation of Nevada Gold Mines. A key driver for growth at the asset is the expansion of the Gold Quarry roaster. In 2021, Franco-Nevada’s prepaid ounces delivered by Gold Quarry exceeded the Gold Quarry known Mineral Reserves resulting in lower expected future minimum payments. Going forward, Franco-Nevada expects its royalty from Gold Quarry to be 1,350 GEOs per annum based on the minimum payment obligation. Gold Quarry, Nevada
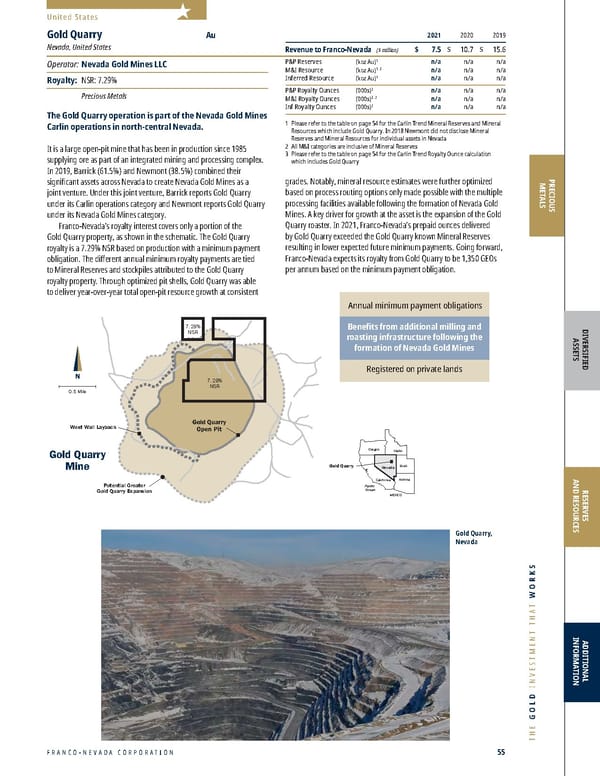
2022 ASSET HANDBOOK 56 FNV TSX NYSE United States PRECIOUS METALS 2021 2020 2019 Revenue to Franco-Nevada ($ million) $ 8.5 $ 7.1 $ 8.7 P&P Reserves (koz Au) 1 3,410 3,887 3,887 M&I Resource (koz Au) 1 5,004 4,942 4,942 Inferred Resource (koz Au) 1 252 182 182 P&P Royalty Ounces (000s) 2 106 122 122 M&I Royalty Ounces (000s) 1, 2 154 155 155 Inf Royalty Ounces (000s) 2 8 6 6 1 Please r efer to the tables on pages 128-136 for a breakout of grade and tonnages by Mineral Resource category; all M&I categories are inclusive of Mineral Reserves 2 For Ro yalty Ounce calculation, Franco-Nevada estimates 97% of the Mineral Reserves (98% in 2020, 98% in 2019), 96% of the M&I Mineral Resources (98% in 2020, 98% in 2019) and 96% of the Inferred Mineral Resources (98% in 2020, 98% in 2019) are subject to our royalty interest and estimates a rate of 3.2% is applicable Marigold Au Nevada, United States Operator: SSR Mining Inc. Royalty: NSR: 1.75-5% / GR: 0.5-4% Precious Metals The Marigold mine is located approximately 64 km southeast of Winnemucca, Nevada on the Battle Mountain-Eureka Trend and is operated by SSR Mining Inc. (“SSR Mining”). The mine has been in continuous production since 1989 and is a large run-of-mine heap leach operation with several open pits. Franco-Nevada has various royalties on the operation (1.75-5% NSR and 0.5-4% GR), as shown in the schematic, together covering a significant portion of the current Mineral Reserve base. Franco-Nevada’s original royalties were acquired in connection with its IPO and, in December 2009, additional royalties covering alternate sections were added. The mine pr oduced 235,282 ounces of gold in 2021 versus 234,000 ounces in 2020. For 2022, SSR Mining expects production to be between 215,000 to 245,000 ounces, with production of between 245,000 to 275,000 ounces in 2023. The current life of mine plan predicts an 11-year mine life, with life of mine production of 2.5 million ounces of gold and average annual production of 215,000 ounces over the next five years. Royalty payments to Franco-Nevada will fluctuate depending on the royalty ground being mined. SSR Mining’ s strategy to advance brownfields targets proximal to existing infrastructure continues to yield encouraging results and the company plans to increase its exploration drilling target in 2022 by approximately 20%. Currently, the focus will be on higher-grade oxides, resource expansion and conversion at New Millennium, Mackay, Valmy, Trenton Canyon and Buffalo Valley, the majority of which are not on Franco-Nevada royalty ground. The Marigold mine has produced in excess of four million ounces Continued resource expansion and encouraging exploration results N Valmy 5 North Deposit 8 North Deposit Terr y Pit Target Pit E. Basalt and Battle Cry Targets Antler and Basalt Pits (Backfilled) Marigold Mine Terr y Zone North 1.75% NSR 1.75% NSR 1.75% NSR 1.75% NSR 5% NSR 5% NSR 5% NSR 5% NSR 5% NSR 5% NSR 5% NSR 5% NSR 5% NSR 5% NSR 5% NSR 5% NSR 3% NSR* 3% NSR* 3% NSR* 2.5%-4% GR* 2.5%-4% GR* 2.5%-4% GR* 2.5%-4% GR* 2.5%- 4% GR* 5% NSR 1.75% NSR *December 2009 Acquisition Schematic Representation Only 1 Mile 0.5%-1.5% GR* Mackay Pit Valmy and Mud Pits Hideout 8D 8SX Pits Exploration Targets N Valmy 5 North Deposit 8 North Deposit Terr y Pit Target Pit E. Basalt and Battle Cry Targets Antler and Basalt Pits (Backfilled) Marigold Mine Terr y Zone North 1.75% NSR 1.75% NSR 1.75% NSR 1.75% NSR 5% NSR 5% NSR 5% NSR 5% NSR 5% NSR 5% NSR 5% NSR 5% NSR 5% NSR 5% NSR 5% NSR 5% NSR 3% NSR* 3% NSR* 3% NSR* 2.5%-4% GR* 2.5%-4% GR* 2.5%-4% GR* 2.5%-4% GR* 2.5%- 4% GR* 5% NSR 1.75% NSR *December 2009 Acquisition Schematic Representation Only 1 Mile 0.5%-1.5% GR* Mackay Pit Valmy and Mud Pits Hideout 8D 8SX Pits Exploration Targets Red Dot Red Dot Marigold Pacific Ocean Oregon Idaho Utah Nevada California Arizona MEXICO Marigold, Nevada
FRANCO-NEVADA CORPORATION 57 THE GOLD INVESTMENT THAT WORKS PRECIOUS METALS DIVERSIFIED ASSETS RESERVES AND RESOURCES ADDITIONAL INFORMATION United States Marigold, Nevada Bald Mountain, Nevada Bald Mountain, Nevada
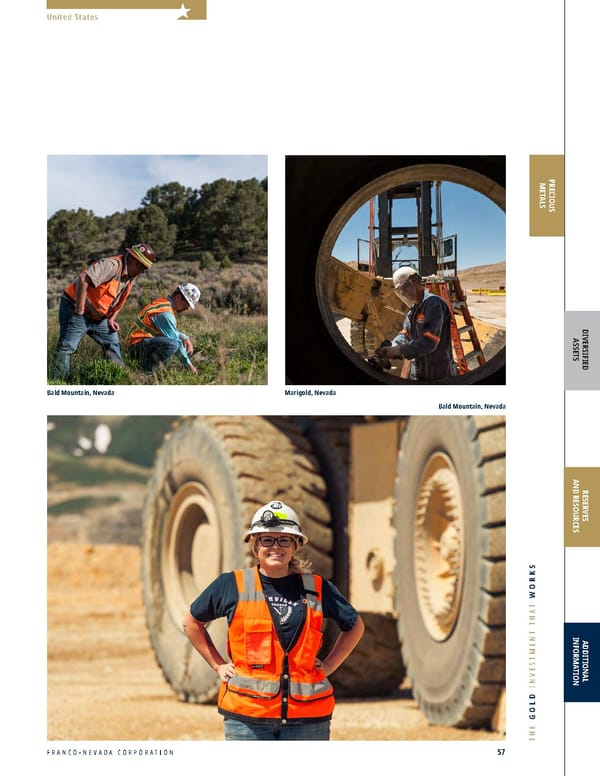
2022 ASSET HANDBOOK 58 FNV TSX NYSE Bald Mountain Mine North Block South Block Excluded from Royalty * Subject to possible reduction by third-party royalty Galaxy Poker Flats Bida Saga Yankee Targets Lux/Vantage Targets Top Sage Flats Belmont Horseshoe 4% NSR 4% NSR 4% NSR 4% NSR 4% NSR* 4% NSR* 4% NSR* 4% NSR* 4% NSR* 4% NSR* 4% NSR* 0.875 to 1.75% NSR 2.418% NSR Royale 1%-5% GR Redbird 5 1 LJ Ridge Banghart South Ridge Rat North Duke South Duke 2/3 1%-5% GR Winrock N Km 0 2 North Block South Block Bald Mountain Mine North Block South Block Excluded from Royalty * Subject to possible reduction by third-party royalty Galaxy Poker Flats Bida Saga Yankee Targets Lux/Vantage Targets Top Sage Flats Belmont Horseshoe 4% NSR 4% NSR 4% NSR 4% NSR 4% NSR* 4% NSR* 4% NSR* 4% NSR* 4% NSR* 4% NSR* 4% NSR* 0.875 to 1.75% NSR 2.418% NSR Royale 1%-5% GR Redbird 5 1 LJ Ridge Banghart South Ridge Rat North Duke South Duke 2/3 1%-5% GR Winrock N Km 0 2 North Block South Block Bald Mountain Pacific Ocean Oregon Idaho Utah Nevada California Arizona MEXICO United States PRECIOUS METALS 2021 2020 2019 Revenue to Franco-Nevada ($ million) $ 11.2 $ 11.2 $ 8.9 P&P Reserves (koz Au) 1 798 1,143 1,277 M&I Resource (koz Au) 1 4,390 4,735 5,139 Inferred Resource (koz Au) 1 669 695 808 P&P Royalty Ounces (000s) 2 16 22 25 M&I Royalty Ounces (000s) 1, 2 139 143 161 Inf Royalty Ounces (000s) 2 23 23 29 1 Please r efer to the tables on pages 128-136 for a breakout of grade and tonnages by Mineral Resource category; all M&I categories are inclusive of Mineral Reserves 2 For Ro yalty Ounce calculation, Franco-Nevada estimates 95% of Mineral Reserves (93% in 2020, 92% in 2019) and 95% of Mineral Resources (exclusive of Mineral Reserves) (93% in 2020, 98% in 2019) are subject to our royalty interest and estimates an average rate of 2.10% is applicable for Mineral Reserves and 3.60% for Mineral Resources (exclusive of Mineral Reserves) Bald Mountain Au Nevada, United States Operator: Kinross Gold Corporation Royalty: NSR/GR: 0.875-5% Precious Metals The Bald Mountain mine lies within the Southern Ruby Mountains of northeastern Nevada along the southern extension of the prolific Carlin Trend, approximately 110 km southeast of Elko. Ore is sourced from multiple open pits over an estimated 600 km 2 property with processing at multiple conventional heap leaching facilities. Bald Mountain is the largest mine site by area in the U.S. It stretches 40 km north to south and 15 km east to west and is divided in three zones: North Zone, South Zone and JV Zone. Fr anco-Nevada’s Bald Mountain royalties cover a significant portion of the Bald Mountain property. Royalty rates range from 0.875%-5% NSR/GR. A detailed map of the royalties is shown in the schematic. At the end of 2015, Kinross Gold Corporation (“Kinross”) purchased from Barrick 100% of the North and South Zones while forming a 50/50 exploration joint venture partnership with Barrick on the JV Zone in between the North and South Zones. During 2018, Kinross acquired the remaining 50% portion of the JV area that it did not already own. Bald Mountain pr oduced 204,890 ounces in 2021, a slight increase from the 191,282 ounces produced in 2020, mainly due to timing of ounces recovered from the heap leach pads. The lar ge scale of the Bald Mountain land package offers significant exploration upside, with multiple known mineralized bodies. In 2021, approximately 18,500 meters of drilling was completed with 15 drill targets interpreted. The North Point, Duke, Zed-Williams, Wino and Top UG targets were advanced to the next phase of drill testing. 2022 exploration projects will concentrate on testing targets with significant near-surface potential (Zed-Williams, Wino, North Point, Dueces, South and West Yankee, and Duke), along with continuing exploration on the high-grade Top underground resource prospect. Large land package and significant exploration upside Potential to add significant mine life Bald Mountain, Nevada
FRANCO-NEVADA CORPORATION 59 THE GOLD INVESTMENT THAT WORKS 2021 2020 2019 Revenue to Franco-Nevada ($ million) $ 5.6 $ 6.2 $ 1.8 P&P Reserves (koz Au) 1 n/a n/a n/a M&I Resource (koz Au) 1, 2 n/a n/a n/a Inferred Resource (koz Au) 1 n/a n/a n/a P&P Royalty Ounces (000s) 3 n/a n/a n/a M&I Royalty Ounces (000s) 2, 3 n/a n/a n/a Inf Royalty Ounces (000s) 3 n/a n/a n/a 1 Please r efer to the table on page 54 for the Carlin Trend Mineral Reserves and Mineral Resources which include South Arturo 2 All M&I categories ar e inclusive of Mineral Reserves 3 Please r efer to the table on page 54 for the Carlin Trend Royalty Ounce calculation which includes South Arturo South Arturo Au Nevada, United States Operator: Nevada Gold Mines LLC Royalty: GR: 4-9% with AMR Precious Metals South Arturo consists of a series of sediment hosted Carlin-style gold deposits adjacent to and including the former Dee gold mine, 60 km northwest of Elko, Nevada. Nevada Gold Mines acquired the 40% interest in South Arturo that it did not already own from i-80 Gold Corp. (“i-80 Gold”) effective June 1, 2021. The transaction provided Nevada Gold Mines with 100% of the project and all of the longer-term upside at the South Arturo pit and the El Niño underground, as well as flexibility to pursue other potential operational synergies at Goldstrike. Fr anco-Nevada holds a sliding scale gross royalty (4-9%) on production from South Arturo. The royalty rate depends on the type of ore (oxide versus non-oxide), as well as the grade (for oxide only). Franco-Nevada estimates a 4% royalty rate for the oxide mineralization and a 6% royalty rate for the non-oxide. The royalty agreement includes an annual minimum payment which is credited against any future production royalty payments. Commer cial production at South Arturo’s El Niño mine was declared at the end of Q3 2019. The mine is located in close proximity to Nevada Gold Mines’ Goldstrike operations where the ore is processed at the refractory facilities. In July 2019, Barrick (61.5%) and Newmont (38.5%) combined their significant assets across Nevada to create Nevada Gold Mines as a joint venture. Under this joint venture, South Arturo is reported as part of the Carlin operation category by Barrick. South Artur o delivered year-over-year total open-pit Mineral Resource growth at consistent grades from 2020 to 2021. Production from El Niño and the Phase 1 pit began in 2019 and mining of the Phase 1 pit was suspended in December 2019 awaiting roasting capacity at Goldstrike. In January 2021, Premier Gold Mines Limited (“Premier”), the predecessor to i-80 Gold, released a positive prefeasibility study which included the underground El Niño mine and the proposed Phase 1 open pit. Based on the prefeasibility study, El Niño had a two-year mine life with 58,750 recoverable ounces and Phase 1 had an 18-year mine life with 664,000 recoverable ounces with production targeted to begin in 2025. In May 2021, i-80 Gold reported that the development of a ramp at El Niño was expected to be completed in Q1 2023 to access deeper mineralization. In November 2021, Nevada Gold Mines reported the successful targeting of a newly recognized ore controlling structure, the Otto fault. Intercepts expanded the orebody footprint to the northwest and additional follow-up drilling is planned to fully delineate the extension. Consolidated ownership Year-over-year resource growth Exploration success around newly recognized controlling structure at El Niño PRECIOUS METALS DIVERSIFIED ASSETS RESERVES AND RESOURCES ADDITIONAL INFORMATION Dee 4-9% GR South Arturo Excluded from Royalty N 1 Mile Phase 1 Pit Phase 3 Pit Phase 2: Open pit completed El Nino U/G: Currently developing East Dee Target South Hinge Target Dee 4-9% GR South Arturo Excluded from Royalty N 1 Mile Phase 1 Pit Phase 3 Pit Phase 2: Open pit completed El Nino U/G: Currently developing East Dee Target South Hinge Target South Arturo Pacific Ocean Oregon Idaho Utah Nevada California Arizona MEXICO United States South Arturo, Nevada
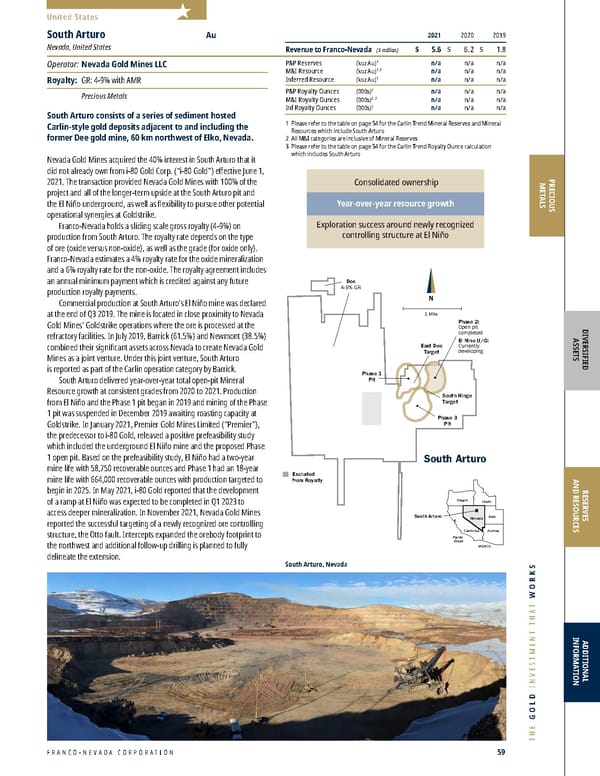
2022 ASSET HANDBOOK 60 FNV TSX NYSE United States PRECIOUS METALS 2021 2020 2019 Revenue to Franco-Nevada ($ million) $ 4.4 $ 4.2 $ 2.8 P&P Reserves (koz Au) 1 471 658 1,004 M&I Resource (koz Au) 1 1,924 1,571 2,902 Inferred Resource (koz Au) 1 928 752 184 P&P Royalty Ounces (000s) 2 8 11 16 M&I Royalty Ounces (000s) 1, 2 31 25 46 Inf Royalty Ounces (000s) 2 15 12 3 1 Please r efer to the tables on pages 128-136 for a breakout of grade and tonnages by Mineral Resource category; all M&I categories are inclusive of Mineral Reserves 2 For Ro yalty Ounce calculation, Franco-Nevada estimates 100% of the Mineral Reserves and Mineral Resources are subject to our royalty interest and estimates a rate of 1.60% is applicable Mesquite Au California, United States Operator: Equinox Gold Corp. Royalty: NSR: 0.5-2% Precious Metals Mesquite is a gold operation located in south-east California, approximately 70 km northwest of Yuma, Arizona and 230 km east of San Diego, California. The mine is an open-pit, run-of-mine, heap leach operation. Franco-Nevada holds royalties on the entire Mesquite mine property that range from a 0.5-2% NSR, depending on the claim block, as shown on the schematic. Mesquite pr oduced 137,467 ounces of gold in 2021, a modest decrease from 2020 ounces produced of 141,270. For 2022, Equinox Gold anticipates production of 120,000 to 130,000 ounces of gold, with approximately 60% of production coming in the second half of the year. Equino x Gold transitioned from waste stripping to mining oxide ore from the Brownie deposit during Q3 2021. In 2022, Equinox Gold will be focused on processing almost entirely Brownie pit ore and a stripping campaign to open up the new VE2 ore body, which will be the major source of ore in Q4 2022. Equinox Gold plans to invest in a leach pad expansion and exploration projects to support a longer life of mine. In September 2021, Equinox Gold announced an updated reserve and resource estimate for Mesquite with measured and indicated resources, exclusive of reserves, increasing by 65%. Resource growth occurred primarily at the Brownie, VE2 and Rainbow deposits. Commenced stripping campaign to open up the new VE2 ore body Ongoing resource expansion and planned leach pad extension N Mesquite Mine Big Chief Rainbow Vista $500 Gold Pit 2% NSR 0.5% NSR Brownie 1% NSR 1 Mile Mesquite Pacific Ocean Oregon Idaho Utah Nevada California Arizona MEXICO Mesquite, California
FRANCO-NEVADA CORPORATION 61 THE GOLD INVESTMENT THAT WORKS Oro Belle Mined Pit Jumbo Mined Pit JSLA Mined Pit South Waste Dump West Waste Dump Heap Leach Pad Castle Mountain Royalty Area 2.65% NSR Royalty lands Plus 10 Mile Area of Interest 1,000 Metres 0 2,000 Castle Mountain Mine Las Vegas Los Angeles San Diego MEXICO CALIFORNIA NEVADA Castle Mountain Mine NEVADA CALIFORNIA 2021 2020 2019 Revenue to Franco-Nevada ($ million) $ 1.5 $ – $ – P&P Reserves (koz Au) 1 4,168 3,563 3,563 M&I Resource (koz Au) 1 5,919 4,333 4,333 Inferred Resource (koz Au) 1 1,608 2,210 2,210 P&P Royalty Ounces (000s) 2 110 94 94 M&I Royalty Ounces (000s) 1, 2 157 115 115 Inf Royalty Ounces (000s) 2 43 59 59 1 Please r efer to the tables on pages 128-136 for a breakout of grade and tonnages by Mineral Resource category; all M&I categories are inclusive of Mineral Reserves 2 For Ro yalty Ounce calculation, Franco-Nevada estimates 100% of the Mineral Reserves and Mineral Resources are subject to our royalty interest and estimates a rate of 2.65% is applicable Castle Mountain Au California, United States Operator: Equinox Gold Corp. Royalty: NSR: 2.65% Precious Metals The Castle Mountain mining property is located in California, close to the Nevada border and is in the historic Hart Mining District, 120 km south of Las Vegas, Nevada. The mine is operated by Equinox Gold, which also owns the Mesquite mine described on page 60. NewCastle Gold Ltd. (“NewCastle”), a predecessor company to Equinox Gold, was the previous owner of the Castle Mountain property. The Castle Mountain land holdings total greater than 40 km 2 of patented and unpatented claims. The mine was previously operated by Viceroy Gold and MK Resources and produced over 1.2 million ounces of gold. Fr anco-Nevada currently holds a 2.65% NSR covering all of the existing Castle Mountain mine and extending 10 miles from the boundary of the mine. Rede velopment of Castle Mountain is planned in two phases. Construction and commissioning of the Phase 1 mine was completed and commercial production was achieved in November 2020. During 2021, Castle Mountain produced 25,270 gold ounces. For 2022, Equinox Gold anticipates production of 25,000 to 35,000 ounces of gold. Phase 1 operations are expected to produce on average 40,000 ounces of gold annually for the remainder of the project. A feasibility study for the Phase 2 expansion was released in March 2021. The Phase 2 project will expand ROM heap leaching and incorporate milling of higher- grade ore, increasing production to an average of 218,000 ounces per year and extending the total mine life to 21 years. Life-of-mine production including Phase 1 operations and end of mine life rinsing is estimated at 3.4 million ounces of gold. Equinox Gold expects to submit Phase 2 permit applications in H1 2022. Phase 1 production ongoing and planned to reach 40,000 ounces per year Permitting Phase 2 expansion to increase production to >200,000 ounces per year Franco-Nevada’s royalty covers entire project area with a 10-mile area of interest United States PRECIOUS METALS DIVERSIFIED ASSETS RESERVES AND RESOURCES ADDITIONAL INFORMATION Castle Mountain, California
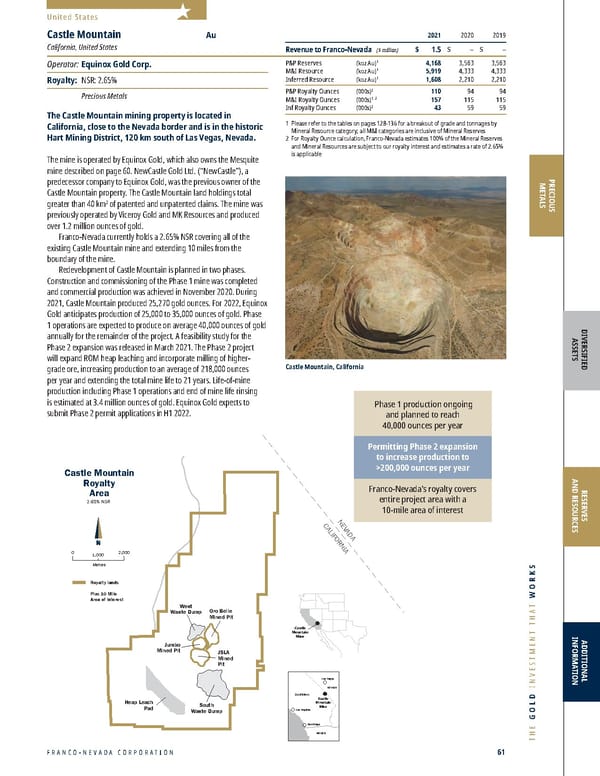
2022 ASSET HANDBOOK 62 FNV TSX NYSE United States PRECIOUS METALS 2.5% NSR royalty on two properties Exploration focused on the two miles of strike length along the East Graben Corridor 2021 2020 2019 Revenue to Franco-Nevada ($ million) $ 1.0 $ 1.5 $ 2.3 P&P Reserves (koz Au) 1 – 31 54 M&I Resource (koz Au) 1 94 125 524 Inferred Resource (koz Au) 1 3,185 2,994 2,639 P&P Royalty Ounces (000s) 2, 3 – 1 1 M&I Royalty Ounces (000s) 1, 2, 3 3 3 14 Inf Royalty Ounces (000s) 2, 3 84 79 68 Fire Creek/Midas Au & Ag Nevada, United States Operator: Hecla Mining Company Royalty: NSR: 2.5% Precious Metals The Fire Creek and Midas mines are located in north central Nevada, at the cross-section of the Northern Nevada Rift and the Battle Mountain Trend. Fire Creek is a high-grade epithermal gold deposit consisting of a combination of private fee land and U.S. Bureau of Land Management (“BLM”) land for a total area of approximately 45 km 2 plus an area of interest in adjacent townships along strike with mineralization. Midas was discovered and constructed by Franco-Nevada’s predecessor company prior to its combination with Newmont. The property position extends over private fee land and BLM land for a total area of 137 km 2 with an area of interest surrounding the property. The Fire Creek and Midas mines, along with the Hollister mine (discussed on page 63), are operated by Hecla Mining Company (“Hecla”) after Hecla acquired Klondex Mines Ltd. in 2018. After completion of a prepaid gold purchase agreement in 2018, Franco-Nevada now holds a 2.5% NSR royalty on both properties. Pr oduction at the Midas mine was suspended in 2019 and at the Midas mill and Fire Creek mine in mid-2021. While both mines and the mill are currently on care and maintenance, in 2021 stockpiled non- refractory ore was processed at the Midas mill. Third party processing of refractory ore was also conducted in a roaster and autoclave facility off site. In Q4 2021, Hecla announced e xploration drilling at Midas had defined and expanded mineralization on the Sinter Structure and intersected high-grade gold and silver mineralization on two new structures, the Racer and Hanging Wall (HW1), both open along the East Graben Corridor. In 2022, Hecla's Nevada exploration is anticipated to be 30% of its total planned expenditures, with ongoing drilling programs at both Midas and Hollister. Exploration work at Midas will focus on the two miles of strike length along the East Graben Corridor. N Miles 0 1 Fire Creek Royalty Area 2.5% NSR Fee Lands Unpatented Mining Claims Fire Creek deposits Outline of Area of Interest (AOI) Plan of Operations N Miles 0 1 Midas Town Midas Royalty Area 2.5% NSR Royalty covered areas Plus Area of Interest (AOI) (not shown) Fire Creek/Midas Pacific Ocean Oregon Idaho Utah Nevada California Arizona MEXICO 1 Please r efer to the tables on pages 128-136 for a breakout of grade and tonnages by Mineral Resource category; all M&I categories are inclusive of Mineral Reserves 2 For Ro yalty Ounce calculation, Franco-Nevada estimates 100% of Mineral Reserves & Mineral Resources at Fire Creek and Midas are subject to our royalty interest and estimates an average rate of 2.5% is applicable 3 Silver has been converted to Ro yalty Ounces assuming $1,800/oz gold and $23.00/oz silver ($1,750/oz gold and $25.00/oz silver in 2020, $1,400/oz gold and $18.00/oz silver in 2019) Fire Creek/Midas, Nevada
FRANCO-NEVADA CORPORATION 63 THE GOLD INVESTMENT THAT WORKS N Hollister Project Hollister/Ivanhoe 5% NSR Hollister Deposit Hatter Graben Discovery USX Pits Hillcrest Finley River Block 3% NSR 1 Mile Hollister Pacific Ocean Oregon Idaho Utah Nevada California Arizona MEXICO 2021 2020 2019 Revenue to Franco-Nevada ($ million) $ – $ – $ 0.5 P&P Reserves (koz Au) 1 – – – M&I Resource (koz Au) 1 51 51 164 Inferred Resource (koz Au) 1 273 273 185 P&P Royalty Ounces (000s) 2 – – – M&I Royalty Ounces (000s) 1, 2 2 2 5 Inf Royalty Ounces (000s) 2 8 8 6 1 Please r efer to the tables on pages 128-136 for a breakout of grade and tonnages by Mineral Resource category; all M&I categories are inclusive of Mineral Reserves 2 For Ro yalty Ounce calculation, Franco-Nevada estimates 100% of Mineral Reserves & Mineral Resources are subject to our royalty interest and estimates an average rate of 3.0% is applicable Hollister Au Nevada, United States Operator: Hecla Mining Company Royalty: NSR: 3-5% Precious Metals Hollister is a historic underground mine with past production of approximately 425,000 ounces. The mine is located at the northern end of the Carlin Trend in the Ivanhoe Mining District, Elko County, Nevada, approximately 121 km east-northeast of Winnemucca, Nevada. Franco-Nevada holds a 3-5% NSR royalty on approximately 28 km 2 of the Hollister project, as well as a sliding scale NSR, which is subject to gold price and production thresholds and is capped at $3.5 million. In 2018 Hecla acquir ed Klondex, the previous operator, which included the Hollister mine, as well as the Fire Creek/Midas assets highlighted on page 62. In June 2019, Hecla announced that the Hollister mine would be placed on care and maintenance and it remained suspended through 2021. Exploration at Hollister has been focused on the definition of new exploration targets and Hecla remains committed to the exploration and definition of the Hatter Graben area. The Hatter Graben is expected to provide the future growth at Hollister and is one of the key reasons Hecla acquired Klondex. Underground exploration drilling at Hollister commenced in Q4 2021 and drilling from a new decline confirmed multiple new vein zones at the Hatter Graben. Hecla plans to advance the Hatter Graben decline in 2022 and completed 2,400 feet of development, including the necessary ventilation and dewatering infrastructure. Additional footage is planned for the decline through the first half of 2022. United States PRECIOUS METALS DIVERSIFIED ASSETS RESERVES AND RESOURCES ADDITIONAL INFORMATION Exploration work on the Hatter Graben area continues Exploration decline currently being advanced Hollister, Nevada
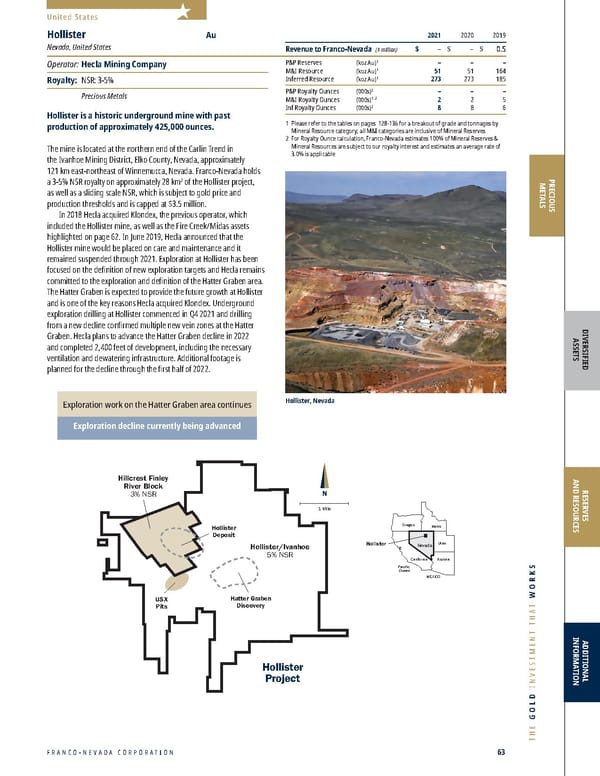
2022 ASSET HANDBOOK 64 FNV TSX NYSE Stibnite Gold Royalty 1.7% NSR N Mile 0 1 Mineral Resources Prospects Patented Claims under option MGll Mineral Rights Salt Yellow Pine Deposit West End Deposit Hangar Flats Deposit Historic Tailings Blow-out Mule Rabbit Scout Garnet Ridgetop Cinnamid Saddle Fern Upper Midnight Idaho Utah Nevada Boise Cascade McCall Coeur d'Alene Stibnite Gold Project United States PRECIOUS METALS 2021 2020 2019 Revenue to Franco-Nevada ($ million) $ – $ – $ – P&P Reserves (koz Au) 1 4,819 4,819 – M&I Resource (koz Au) 1 6,034 6,034 – Inferred Resource (koz Au) 1 1,246 1,246 – P&P Royalty Ounces (000s) 2 82 82 – M&I Royalty Ounces (000s) 1, 2 103 103 – Inf Royalty Ounces (000s) 2 21 21 – 1 Please r efer to the tables on pages 128-136 for a breakout of grade and tonnages by Mineral Resource category; all M&I categories are inclusive of Mineral Reserves 2 For Ro yalty Ounce calculation, Franco-Nevada estimates 100% of the Mineral Reserves and Mineral Resources are subject to our royalty interest and estimates a rate of 1.70% is applicable Stibnite Gold Au Idaho, United States Operator: Perpetua Resources Corp. Royalty: NSR: 1.7% Precious Metals The Stibnite project is located in a historic mining town of the same name in Idaho, about 153 km northeast of Boise and is potentially one of the highest grade open-pit deposits in the U.S. The project is being advanced by Perpetua Resources Corp. (“Perpetua Resources”), formerly known as Midas Gold Corp., who have consolidated 107 km 2 of unpatented and patented claims. Franco-Nevada holds a 1.7% NSR on future gold production. In December 2020, Perpetua Resour ces announced the results of a feasibility study on the Stibnite project. The project is expected to have a 15-year mine life with average annual gold production of 301,000 ounces per year. The first four years demonstrate an average annual gold production of 466,000 ounces per year. The project consists of mining the Yellow Pine, Hangar Flats and West End deposits by conventional open pit. Based on the 2020 feasibility study, the Stibnite project would be the fourth largest US gold operation by grade and produce approximately 4-5 million ounces of gold based on total reserves and resources of approximately 4.8 million and 6 million ounces of gold, respectively. The United States For est Service (“USFS”) released a Draft Environmental Impact Statement (“Draft EIS”) for public review in August 2020. Perpetua and the USFS are advancing a modified proposed action that includes stakeholder feedback on the Draft EIS, developed to decrease the project footprint and improve environmental conditions. The changes incorporate the elimination of waste rock storage areas, overall reductions in mined material, two access routes, additional pit backfilling and restoration, and improvements to water quality and water temperature. The project schedule has been revised and assuming a final Record of Decision is released in the first half of 2023, commercial operations are expected in 2027. One of the largest and highest grade undeveloped open-pit deposits in the U.S. The Stibnite project would be the only domestic source of antimony mined in the U.S. Perpetua Resour ces plans for restoration of the site to include progressive and concurrent remediation, beginning at the start of construction and continuing through operations and project closure. Extensive reclamation and restoration of historical mining impacts are planned, with permanent fish access having been restored for the first time in 80 years. Stibnite Gold, Idaho
FRANCO-NEVADA CORPORATION 65 THE GOLD INVESTMENT THAT WORKS United States PRECIOUS METALS DIVERSIFIED ASSETS RESERVES AND RESOURCES ADDITIONAL INFORMATION Other United States Assets United States Precious Metals Please refer to the tables on pages 128-136 for a breakout of grade and tonnages by Mineral Resource category. The Granite Creek (Pinson) project is located near Winnemucca, Nevada, at the intersection of the Getchell Gold Belt and the Battle Mountain-Eureka Trend. Franco-Nevada holds a 1-2% NSR on approximately 20 sections within the Getchell trend. This royalty includes both a section and a smaller royalty on another half section associated within Granite Creek’s operating area, formally known as Pinson. Granite Creek (Pinson) is south of Nevada Gold Mines’ Turquoise Ridge mine and 13 km from its Twin Creeks mine complex. The historic Pinson mine produced 985,000 ounces of gold from 1980 through 1999 by open-pit mining. Pinson was placed on care and maintenance in 2015. In August 2020, Pr emier Gold Mines USA, Inc. acquired the outstanding interests of Osgood Mining Company LLC (“Osgood”) from affiliates of Waterton Global Resource. In December 2020, Equinox Gold and Premier announced that they had entered into a definitive agreement whereby Equinox Gold would acquire all the outstanding shares of Premier. Concurrently, Premier spun-out its US-focused gold production and development assets into i-80 Gold, which included the Granite Creek project (previously known as the Pinson project). The transaction closed in April 2021. In February 2022, i-80 Gold announced that 2021 drilling was successful in delineating high-grade mineralization in multiple areas surrounding the existing mine workings. Test mining is underway underground, and i-80 Gold is targeting production ramp-up in 2022. Mined material will be processed at Nevada Gold Mines’ nearby Twin Creeks facility until i-80 Gold’s Lone Tree facility is operational. Franco-Nevada has not included Granite Creek (Pinson) in Royalty Ounce estimates Granite Creek (Pinson) Au Pinson, United States Operator: i-80 Gold Corp. Royalty: NSR: 1-2% Precious Metals Sterling is a historic gold operation located 185 km northwest of Las Vegas, Nevada near Beatty, Nevada. Coeur, who operates Guadalupe-Palmarejo (discussed on page 51), purchased Northern Empire Resource Corp. (“Northern Empire”) and the Sterling property in 2018. Franco-Nevada holds 1/8 th of a 2% NSR, or an effective 0.25% NSR royalty, on approximately 272 lode mining claims with a small minimum advance royalty. Sterling underground mining operations were terminated at the end of May 2015. Coeur is continuing to advance exploration throughout 2022, focusing on infill and expansion drilling. Franco-Nevada has not included Sterling in Royalty Ounce estimates Sterling Au Nevada, United States Operator: Coeur Mining, Inc. Royalty: NSR: 0.25% Precious Metals
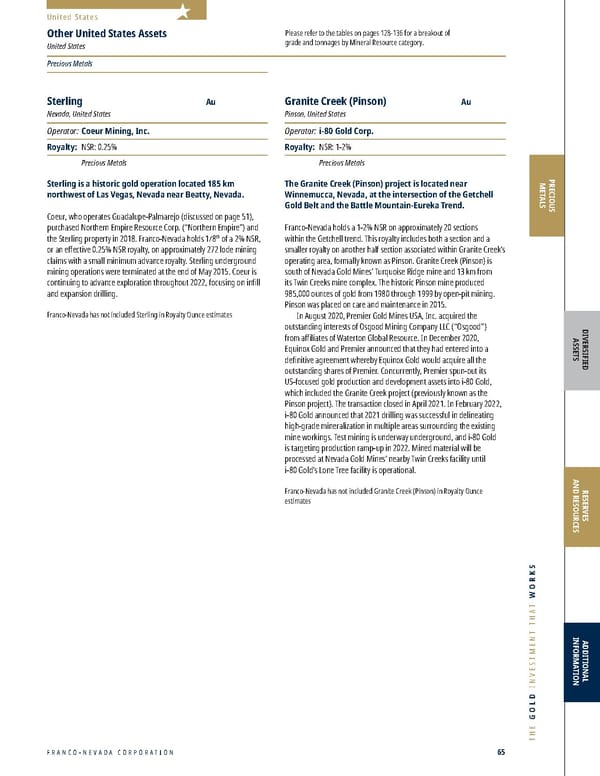
2022 ASSET HANDBOOK 66 FNV TSX NYSE Island Gold Millmerran Red October Henty Mt Keith Duketon Yandal (Bronzewing/Julius) King Vol Bowen Basin South Kalgoorlie (Mt Martin) Flying Fox Australia Subika (Ahafo) Tasiast Sabodala Edikan MWS Perama Hill Kiziltepe Karma Sissingue Pandora Courageous Lake Musselwhite Hemlo Detour Lake Goldfields Timmins West Sudbury Kirkland Lake Golden Highway Canadian Malartic Cariboo Dublin Gulch (Eagle) Red Mountain Franco-Nevada Australia Office Valentine Lake Red Lake (Bateman) Agate Creek White Dam Séguéla Edna May Higginsville (Lake Cowan) Aphrodite Matilda (Wiluna) Agnew (Vivien) South Kalgoorlie (New Celebration/ Mt Marion Lithium) Cue Gold (Day Dawn) Agi Dagi ̆ ̆ Producing Advanced Producing (Energy) Greenstone (Hardrock) Monument Bay Brucejack Eskay Creek Producing Advanced PRECIOUS METALS CANADA
FRANCO-NEVADA CORPORATION 67 THE GOLD INVESTMENT THAT WORKS Quebec Ontario Detour Lake Royalty Area 2% NSR 0.5-1% NSR Mine Property Block D N Km O 2.5 5 West Pit Gowest Property Main Pit Other Quebec royalty claims not shown Block E Zone 58N Block A Block B Block C North Pit Sunday Lake Deformation Zone Lower Detour Lake Deformation Zone Sunday Lake Deformation Zone North Pit Main Pit West Pit Detour Mine Trend Saddle Zone Detour Lake Mine Km O 1 D Reser ve Pit Outline Resource Pit Outline Current Pit Outline Current Pit Outline Detour Lake Quebec Ontario Island Gold Millmerran Red October Henty Mt Keith Duketon Yandal (Bronzewing/Julius) King Vol Bowen Basin South Kalgoorlie (Mt Martin) Flying Fox Australia Subika (Ahafo) Tasiast Sabodala Edikan MWS Perama Hill Kiziltepe Karma Sissingue Pandora Courageous Lake Musselwhite Hemlo Detour Lake Goldfields Timmins West Sudbury Kirkland Lake Golden Highway Canadian Malartic Cariboo Dublin Gulch (Eagle) Red Mountain Franco-Nevada Australia Office Valentine Lake Red Lake (Bateman) Agate Creek White Dam Séguéla Edna May Higginsville (Lake Cowan) Aphrodite Matilda (Wiluna) Agnew (Vivien) South Kalgoorlie (New Celebration/ Mt Marion Lithium) Cue Gold (Day Dawn) Agi Dagi ̆ ̆ Producing Advanced Producing (Energy) Greenstone (Hardrock) Monument Bay Brucejack Eskay Creek Producing Advanced PRECIOUS METALS DIVERSIFIED ASSETS RESERVES AND RESOURCES ADDITIONAL INFORMATION Canada 2021 2020 2019 Revenue to Franco-Nevada ($ million) $ 25.3 $ 20.4 $ 16.8 Detour Lake P&P Reserves (koz Au) 1 15,034 15,775 14,846 Detour Lake M&I Resource (koz Au) 1 29,752 20,432 19,261 Detour Lake Inferred Resource (koz Au) 1 1,196 1,470 1,273 P&P Royalty Ounces (000s) 2 301 316 297 M&I Royalty Ounces (000s) 1, 2 595 409 385 Inf Royalty Ounces (000s) 2 24 29 25 1 Please r efer to the tables on pages 128-136 for a breakout of grade and tonnages by Mineral Resource category; all M&I categories are inclusive of Mineral Reserves 2 For Ro yalty Ounce calculation, Franco-Nevada estimates 100% of the Mineral Reserves and Mineral Resources are subject to our royalty interest and estimates a rate of 2.0% is applicable Detour Lake Au Ontario, Canada Operator: Agnico Eagle Mines Limited Royalty: NSR: 2% Precious Metals Franco-Nevada has a 2% NSR royalty that covers an area of 140 km 2 of the Abitibi greenstone belt located 185 km northeast of Cochrane, Ontario including the Detour Lake mine. Placer Dome Inc. operated a mine on the property from 1983 through 1999 during which time approximately 1.8 million ounces of gold are estimated to have been produced. Detour Gold Corpor ation (“Detour Gold”) constructed the current mine from 2010 to 2013 and in 2020 Kirkland Lake Gold Ltd. (“KLG”) acquired Detour Gold. On February 8, 2022, Agnico Eagle Mines Limited (“Agnico Eagle”) and KLG completed a merger of equals, with the combined company continuing as Agnico Eagle. Pr oduction at Detour Lake was 712,824 ounces of gold in 2021, a significant increase from 516,757 ounces of gold for the 11 months in 2020 after Detour Lake was acquired by KLG. Three-year production guidance for Detour Lake is anticipated to be between 700,000 to 730,000 ounces of gold per year in 2022 to 2024. In Mar ch 2021, KLG announced the 2021 life of mine plan with production expected to average 680,000 to 720,000 ounces from 2021 to 2024, before increasing to 800,000 ounces in 2025. Production would then decline for three years during a period of increased stripping before reaching over 900,000 ounces beginning in 2032. KLG has previously reported that an important objective of any near-mine resource conversion would be to adjust the production profile to mitigate a drop off in production after 2025 while achieving 900,000 ounces of production as soon as possible in the mine life. In September 2021, KL G released an updated mineral resource estimate. The new estimate included a 10.1 million ounce increase in Measured and Indicated open-pit Mineral Resources to 14.7 million ounces of gold (572.0 million tonnes at 0.80 g/t), exclusive of Mineral Reserves. At December 31, 2021, Mineral Reserves at Detour Lake were estimated at 15.0 million ounces of gold (573.3 million tonnes at 0.82 g/t). A new technical report and life-of-mine plan are expected to be filed in Q2 2022 and Agnico Eagle anticipates an enhanced production profile with increased mineral reserves and mineral resources. Successful e xploration programs in 2020 and 2021 have led to a significant increase in open-pit mineral resources in 2021, demonstrating the existence of a broad and continuous corridor of mineralization extending over 4.0 km from the Main Pit through the Saddle Zone to the planned West Pit location to a depth of at least 800 m below surface with the system remaining open. In addition, drill results have identified broad zones of higher-grade mineralization below the current pit shells for the Main Pit and West Pit, indicating the potential to add both open-pit and, potentially underground, mineral reserves and mineral resources. Priorities of the 2022 exploration program are the expansion of the Detour Lake pit and Agnico Eagle expects to expand mineral resources at depth and to the west, and to continue to investigate the Sunday Lake deformation zone to the east and west of the current pit's mineral resources. Agnico Eagle has stated it will continue to e xplore the land package in the prolific Abitibi Greenstone Belt including 646 km 2 surrounding the Detour Lake property. While Zone 58N, a high-grade satellite 8.5 km south of Detour Lake with underground potential is not on royalty ground, there is considerable potential for new discoveries on Franco-Nevada’s royalty ground to support future mineral resource growth both near-mine and regionally. Significant resource increase in 2021, new life-of-mine plan expected in 2022 Production growth expected 2022-2024 Detour Lake, Ontario
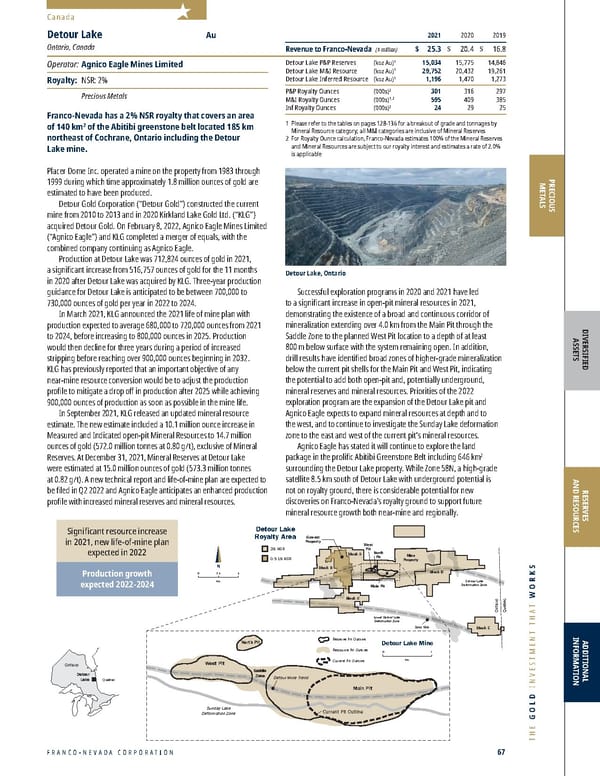
2022 ASSET HANDBOOK 68 FNV TSX NYSE N Podolsky Levack (Morrison Deposit) McCreedy West Sudbur y Igneous Complex Chelmsford Formation Onaping & Onwatin Formations Current and Former Mines Mill Smelter SUDBURY Clarabelle Mill Smelter Strathcona Mill Creighton Copper Cliff Nickel Rim South Totten Coleman Km 0 5 2021 2020 2019 PGM Revenue to FNV ($ million) $ 14.6 $ 35.3 $ 35.9 Gold Revenue to FNV ($ million) $ 2.8 $ 4.8 $ 5.3 Total Revenue to FNV ($ million) $ 17.4 $ 40.1 $ 41.2 PGM P&P Reserves (koz PGM) 1 n/a n/a n/a PGM M&I Resource (koz PGM) 1 n/a n/a n/a PGM Inferred Resource (koz PGM) 1 n/a n/a n/a Gold P&P Reserves (koz Au) 1 n/a n/a n/a Gold M&I Resource (koz Au) 1 n/a n/a n/a Gold Inferred Resource (koz Au) 1 n/a n/a n/a P&P Royalty Ounces (000s) 2 24 33 11 M&I Royalty Ounces (000s) 1, 2 24 33 11 Inf Royalty Ounces (000s) 2 – – – 1 K GHM does not provide public estimates for Mineral Reserves and Mineral Resources. Previous estimates have not been updated in numerous years and thus Franco-Nevada has chosen not to continue to report these figures 2 For Ro yalty Ounce calculation, Franco-Nevada estimates 5 years of mining (5 years in 2020, 1 year in 2019) from McCreedy West are subject to our 50% stream interest to which a 40% margin factor (54% in 2020) has been applied based on assumed ongoing payments of 60% of the spot price. Platinum and palladium have been converted to Royalty Ounces assuming $1,800/ounce Au, $1,000/ounce Pt and $2,100/ounce Pd ($1,750/ounce Au, $1,100/ounce Pt and $2,200/ounce Pd in 2020, $1,400/ounce Au, $1,050/ounce Pt and $1,300/ounce Pd in 2019). Note that this stream interest is calculated based on contained ounces in ore as there are no losses associated to metallurgical recoveries in the calculation of the Royalty Ounce Sudbury PGM & Au Ontario, Canada Operator: KGHM International Ltd. Stream: 50% Precious Metals Stream Precious Metals Franco-Nevada has three precious metals streams in the Sudbury basin of Ontario. Franco-Nevada is entitled to purchase 50% of the precious metals contained in ore produced from the footwall portions of three separate mines subject to ongoing payments per ounce. The streams are calculated based on contained precious metals in the delivered ore rather than payable metals. The streams were acquired as part of Franco-Nevada’s acquisition of Gold Wheaton Gold Corp. (“Gold Wheaton”) in March 2011. At the time of acquisition b y Franco-Nevada, the mines were operated by Quadra FNX Mining Ltd. (“Quadra FNX”) which was subsequently acquired by KGHM International Ltd. (“KGHM”) in March 2012. The three mines are the Levack (Morrison Deposit), Podolsky and McCreedy West mines. The footwall deposits are primarily rich in palladium followed by platinum and gold. KGHM does not have processing facilities in Sudbury and sells the ore to third parties for processing. Currently all ore is being processed by Vale’s Clarabelle plant in Sudbury. McCreedy West Mine: The stream agreement applies to the PM and 700 deposits at the McCreedy West mine. McCreedy West stopped mining the precious metal-rich ores in the PM deposit in 2011. Franco-Nevada agreed to renegotiate the existing contract with KGHM and mining restarted in September 2018. In February 2021, KGHM approved an updated life of mine plan which extended mining operations at the McCreedy West mine for another 5 years. To support this extension of operations, Franco-Nevada agreed to increase its purchase price per GEO effective June 1, 2021, from $800 per ounce to 60% of the prevailing monthly average gold spot price during periods when monthly average gold prices exceed $1,333 per ounce subject to a cap of $1,200 per ounce. McCreedy is expected to be the main source of revenue from Sudbury to Franco-Nevada in 2022 following Levack (Morrison Deposit) being put on care and maintenance in 2019. Levack (Morrison Deposit): This mine was put into production in 2007 but was placed on care and maintenance in Q1 2019. Podolsky Mine: The stream agreement applies to the 2000 and North deposits at the Podolsky mine which operated between 2008 and 2013. The mine is currently on care and maintenance. McCreedy West continues to be the main source of revenue from Sudbury for Franco-Nevada in 2022 Sudbury Quebec Ontario PRECIOUS METALS Canada Sudbury, Ontario
FRANCO-NEVADA CORPORATION 69 THE GOLD INVESTMENT THAT WORKS Hemlo Long Section ‘C’ Zone Pit Williams Shaft & Mill Surface Mined Area 3% NSR + 50% NPI ‘C’ Zone ‘B’ Zone 9975 9765 9555 9450 9240 9160 Mined Area Williams Mine Franco-Nevada Royalty Ground Hemlo Quebec Ontario Canada PRECIOUS METALS DIVERSIFIED ASSETS RESERVES AND RESOURCES ADDITIONAL INFORMATION 2021 2020 2019 Revenue to Franco-Nevada ($ million) $ 27.6 $ 69.9 $ 18.2 P&P Reserves (koz Au) 1 1,100 1,500 1,300 M&I Resource (koz Au) 1 2,600 3,300 3,150 Inferred Resource (koz Au) 1 820 900 1,000 P&P Royalty Ounces (000s) 2 54 76 55 M&I Royalty Ounces (000s) 1, 2 127 167 133 Inf Royalty Ounces (000s) 2 40 46 42 1 Please r efer to the tables on pages 128-136 for a breakout of grade and tonnages by Mineral Resource category; all M&I categories are inclusive of Mineral Reserves 2 For Ro yalty Ounce calculation, Franco-Nevada estimates approximately 20% of the publicly reported Mineral Reserves and Mineral Resources for Hemlo are on its royalty ground and estimates a rate of 4.90% (5.07% in 2020, 4.21% in 2019) is applicable when factoring our NSR and NPI interests. Please see page 30 for our methodology on calculating Ro yalty Ounces for an NPI Hemlo Au Ontario, Canada Operator: Barrick Gold Corporation Royalty: NSR: 3% / NPI: 50% Precious Metals The Hemlo gold mine has been producing gold for over 30 years and is located adjacent to the Trans-Canada highway near Marathon, Ontario. Barrick is the operator and manages both the open-pit and underground operations. Franco-Nevada has both a 3% NSR royalty and a 50% NPI royalty on a portion of the western down-dip underground extension, principally the Lower C Zone, of the Hemlo ore-body as shown in the longitudinal schematic. Initial mining on the r oyalty property began in late 2008, but revenues were limited to the 3% NSR royalty. The 50% NPI portion of the royalty began paying in the third quarter of 2012 after the upfront capital costs had been recovered by Barrick. Pr oduction at Hemlo decreased from 223,000 ounces of gold in 2020 to 150,000 ounces of gold in 2021. All-in sustaining costs, which is important to take into consideration with respect to the NPI royalty, increased to $1,970 per ounce in 2021 versus $1,423 per ounce in 2020. Barrick is forecasting 2022 estimated production of 160,000 to 180,000 ounces at an all-in sustaining cost of between $1,510 to $1,590 per ounce. Re venue from Hemlo in 2021 decreased significantly relative to 2020, reflecting a decrease in production from ground where Franco-Nevada has royalty interests and higher operating costs which affected royalties under the NPI. Barrick expects improved underground activity in 2022 and has reported that infill drilling is ramping up in the western extension (E-Zone) to continue expanding the orebody. Further production increases will depend on resource conversion and exploration success, however, based on current reserves and development, production on royalty ground is expected to gradually reduce. Barrick has established an exploration team dedicated to discovering new potential in prospective Canadian belts. Profit royalties provide more leverage to gold prices Established mine operation in Ontario - Barrick’s only Canadian operation Hemlo, Ontario
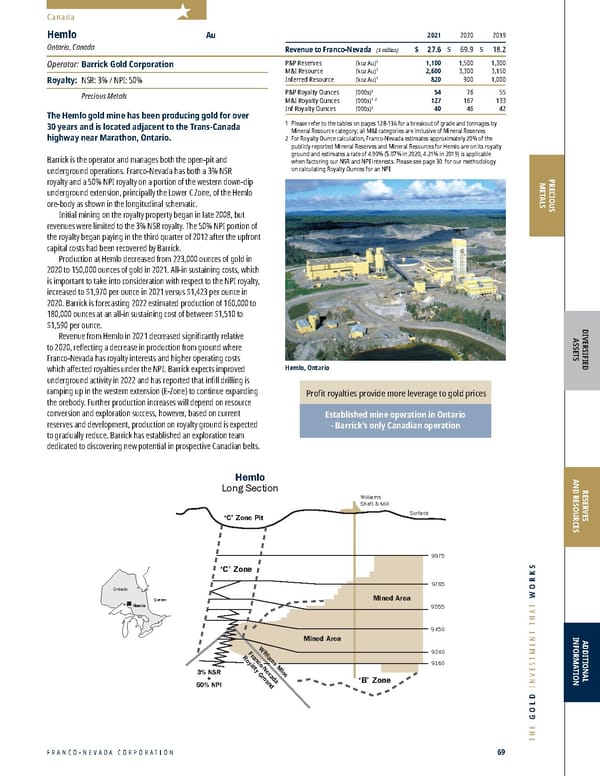
2022 ASSET HANDBOOK 70 FNV TSX NYSE Vancouver Km 0 2 British Columbia Stewart Brucejack Property Brucejack Property Brucejack Lake West Zone Gossan Hill Zone Hanging Glacier Zone Bonanza Zone Flow Dome Zone Bridge Zone Shore Zone Golden Marmot Zone SG Zone Snowfield Brucejack Mine Valley of the Kings Brucejack Project Royalty Area 1.2% NSR Covered by Royalty Not Covered by Royalty 2021 2020 2019 Revenue to Franco-Nevada ($ million) $ 7.0 $ 7.2 $ 5.6 P&P Reserves (koz Au) 1, 2 3,900 4,200 6,400 M&I Resource (koz Au) 1, 2 7,200 7,600 8,500 Inferred Resource (koz Au) 1, 2 3,100 3,100 3,000 P&P Royalty Ounces (000s) 2, 3 47 50 77 M&I Royalty Ounces (000s) 1, 2, 3 86 91 102 Inf Royalty Ounces (000s) 2, 3 37 37 36 1 Please r efer to the tables on pages 128-136 for a breakout of grade and tonnages by Mineral Resource category; all M&I categories are inclusive of Mineral Reserves 2 Does not include silver Miner al Reserves or Mineral Resources 3 For Ro yalty Ounce calculation, Franco-Nevada estimates that 100% of the remaining Mineral Reserves and Mineral Resources are subject to our royalty interest and estimates a rate of 1.2% is applicable Brucejack Au & Ag British Columbia, Canada Operator: Newcrest Mining Limited Royalty: NSR: 1.2% Precious Metals In May 2013, Franco-Nevada purchased an existing 1.2% NSR royalty covering Pretium Resources Inc.’s (“Pretium”) Brucejack gold project in northwestern British Columbia. The project includes two principal deposits, the Valley of the Kings and the West Zone. In November 2021, Newcrest Mining Limited (“Newcrest”) agreed to acquire Pretium and, on March 9, 2022, the acquisition was completed. Pr etium poured first gold from the Brucejack project in June 2017 and achieved commercial production in July 2017. Brucejack produced 347,743 ounces of gold in 2020 and Pretium was guiding towards 325,000 to 365,000 ounces of gold for 2021. Newcrest is expecting Brucejack to add approximately 370,000 ounces of gold to its portfolio in 2022. Pr etium released an updated Mineral Resource and Reserve estimate and an accompanying life of mine plan at the end of March 2020. Pretium’s guidance at the time stated a life of mine average annual gold production of approximately 311,000 ounces of gold with a 13-year mine life. Continued e xploration is expected to focus on expanding the current Mineral Resource and Mineral Reserve at the Valley of the Kings, targeting zones at depth, to the east, west and north-east. Areas at depth below, to the east and to the north-east of the currently defined Mineral Resource are considered highly prospective for additional Mineral Resource expansion. Near-mine exploration targets on royalty ground outside of the West Zone include the Bridge Zone, Shore Zone, Gossan Hill Zone, SG Zone, Bonanza Zone and the western portion of the Flow Dome Zone. The easternmost portion of the PRECIOUS METALS Canada Flow Dome Zone, east of the Valley of the Kings, is not covered on royalty ground. The Golden Marmot and Hanging Glacier Zones, north of the Valley of the Kings, are covered on royalty ground. In Q3 2021, Pretium released new high-grade mineralization results from the Golden Marmot Zone with 72.5 g/t Au over 53.5 meters. In December 2020, Pretium sold the Snowfield property (not on royalty ground) to a subsidiary of Seabridge Gold Inc. New operator focused on growth Definition drilling and near-mine exploration programs Golden Marmot and Hanging Glacier discoveries on royalty ground Brucejack, British Columbia
FRANCO-NEVADA CORPORATION 71 THE GOLD INVESTMENT THAT WORKS Kirkland Lake Quebec Ontario Canada PRECIOUS METALS DIVERSIFIED ASSETS RESERVES AND RESOURCES ADDITIONAL INFORMATION 2021 2020 2019 Revenue to Franco-Nevada ($ million) $ 5.8 $ 5.4 $ 5.2 P&P Reserves (koz Au) 1 1,856 2,368 2,360 M&I Resource (koz Au) 1 3,934 4,467 4,356 Inferred Resource (koz Au) 1 3,781 3,414 3,114 P&P Royalty Ounces (000s) 2 28 36 35 M&I Royalty Ounces (000s) 1, 2 66 73 72 Inf Royalty Ounces (000s) 2 70 64 59 1 Please r efer to the tables on pages 128-136 for a breakout of grade and tonnages by Mineral Resource category; all M&I categories are inclusive of Mineral Reserves. The table above is the sum of reported Agnico Eagle Mineral Reserves and Mineral Resources 2 For Ro yalty Ounce calculation, Franco-Nevada estimates 100% of the Mineral Reserves and Miner al Resources are subject to our royalty interest and estimates a rate of 1.5% is applicable to Macassa and a rate of 2.0% is applicable to Amalgamated Kirkland (AK), Anoki-McBean and Upper Canada Kirkland Lake Au Ontario, Canada Operator: Agnico Eagle Mines Limited Royalty: NSR: 1.5-5.5%; NPI: 20% Precious Metals Franco-Nevada has various royalties covering approximately 170 km 2 of the Larder Lake and Main Breaks in the historic Kirkland Lake gold camp of Ontario. Agnico Eagle maintains the largest interest in the area and operates the Macassa mine which includes production from the Main Break, ’04 Break and the high-grade South Mine Complex (“SMC”). On February 8, 2022, Agnico Eagle and KLG completed a merger of equals, with the combined company continuing as Agnico Eagle. Fr anco-Nevada’s royalty interests with Agnico Eagle include: • An o verlying 1.5% NSR on all of Agnico Eagle’s properties (including the Macassa mine) • An underlying 20% pr ofit-based royalty immediately to the south-west of the SMC as shown in the inset of the schematic • An underlying 2-3% NSR on claims to the west of curr ent operations • An underlying 2% NSR r oyalty on claims that KLG purchased from Queenston Mining Inc. in July 2012 Macassa pr oduced 210,192 ounces of gold in 2021 compared to 183,037 ounces of gold in 2020. Production in 2022 is forecast to be between 170,000 to 190,000 ounces of gold. Agnico Eagle continues to advance the construction of the #4 Shaft. A significant milestone was achieved in January 2022 when the sinking phase of the project was completed to 6,400 feet. Remaining work includes the construction of the loading pocket and other infrastructure as well as additional development to connect the #4 Shaft to current mining operations. The full project is on schedule for completion in late 2022. The #4 Shaft is expected to provide numerous benefits, including increased hoisting capacity, improved unit costs, better ventilation, and enhanced capabilities to pursue exploration potential across the Kirkland Lake camp. Gold production at Macassa is forecast to increase to between 200,000 to 220,000 ounces in 2023 and 330,000 to 350,000 ounces in 2024. Production levels could potentially increase once the full benefit of the #4 Shaft is realized. Underground drilling continues to expand the South Mine Complex, Main Break, '04 Break, Amalgamated Break as well as additional near-surface targets, all of which may benefit Franco-Nevada’s other royalties on the project. Fr anco-Nevada also has a 2% NSR royalty covering the majority of claims held by Agnico Eagle from its acquisition of Osisko Mining Corporation (“Osisko”) in April 2014. Agnico Eagle bought out its JV partner Yamana at the end of 2017 and now owns 100% of the claims. Franco-Nevada’s royalties cover the Upper Canada, Anoki-McBean and Canadian Kirkland deposits. Agnico Eagle expects to drill 15,800 m at the Upper Beaver and Upper Canada deposits and other targets in the Kirkland Lake camp in 2022. Kirkland Lake, Ontario #4 Shaft to increase production by 2024 Large land position in historical mining area covering multiple known deposits Exciting exploration potential on royalty ground at Upper Canada
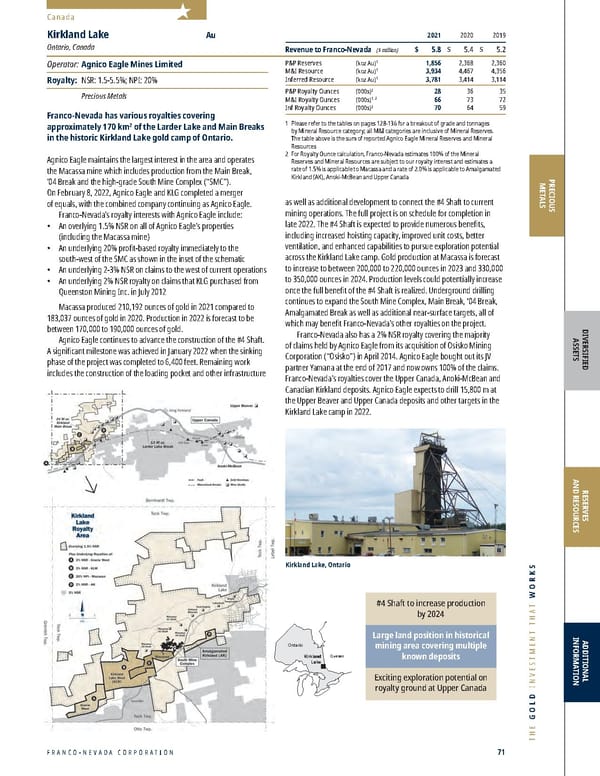
2022 ASSET HANDBOOK 72 FNV TSX NYSE 2021 2020 2019 Revenue to Franco-Nevada ($ million) $ 3.1 $ 1.9 $ 0.4 P&P Reserves (koz Au) 1 3,061 3,061 3,061 M&I Resource (koz Au) 1 4,397 4,397 4,397 Inferred Resource (koz Au) 1 361 361 361 P&P Royalty Ounces (000s) 2 31 31 31 M&I Royalty Ounces (000s) 1, 2 44 44 44 Inf Royalty Ounces (000s) 2 4 4 4 1 Please r efer to the tables on pages 128-136 for a breakout of grade and tonnages by Mineral Resource category; all M&I categories are inclusive of Mineral Reserves 2 For Ro yalty Ounce calculation, Franco-Nevada estimates 100% of the Mineral Reserves and Mineral Resources are subject to our royalty interest and estimates a rate of 1.0% is applicable Dublin Gulch (Eagle) Au Yukon, Canada Operator: Victoria Gold Corp. Royalty: NSR: 1-1.5% Precious Metals Franco-Nevada has a 1% NSR on the Eagle Gold mine which is owned and operated by Victoria Gold Corp. (“Victoria Gold”). The Eagle deposit is part of the larger Dublin Gulch claim block and is located in central Yukon. In addition, Franco-Nevada has a 1.5% NSR on the Lynx properties (part of the Dublin Gulch claim) which is subject to a C$15,000 annual advance royalty payment and is capped at C$1,500,000. In July 2020, the Eagle Gold mine achieved commercial production. In 2021, the operation produced 164,222 ounces of gold compared with 116,644 ounces of gold in 2020. Gold production for 2022 is estimated to be between 165,000 and 190,000 ounces with mining, crushing, irrigation of ore on the heap leach pad all expected to operate at full capacity during the year. Victoria Gold’ s December 2019 feasibility study for the Eagle Gold mine envisions average yearly production of 210,000 ounces of gold over a 12-year mine life. Victoria Gold has initiated ‘Project 250’ aimed at increasing the average annual gold production of the Eagle Gold mine to 250,000 ounces of gold by 2023. Construction of ‘Project 250’ Canada PRECIOUS METALS Eagle Royalty 1% gross return royalty Lynx Royalty 1.5% NSR A B Dublin Gulch (Eagle Deposit) Yukon Northwest Territories Alaska British Columbia B Dublin Gulch (Eagle Deposit) Royalty Area Nugget-Raven Whiskey Wrinkles Eagle Extension Wolf-Tungsten Catto Olive- Shamrock Popeye Eagle West Rex Peso Bluto Eagle Mine Access Road Lynx Mar Zone Property Len Zone Property Eagle Gold Mine Km 0 2.5 A DG Claims boundar y is expected to begin in H1 2022 and completed in H2 2022. Victoria Gold is also initiating ‘Project 2040’ which involves mine life extensions, potentially by 10 years to 2040, with a resource update planned in the future. Fr anco-Nevada’s royalty is estimated to cover the entire Eagle deposit which contains Mineral Reserves of 3.06 million ounces (148 million tonnes grading 0.64 g/t) and a small portion of the smaller satellite Olive Zone which contains Mineral Reserves of 0.2 million ounces (7 million tonnes grading 0.95 g/t). Victoria Gold continues to explore the broader land package targeting Eagle Deep, Lynx, and Olive-Shamrock (on or partially on royalty ground) as well as Nugget-Raven (not on royalty ground). In October 2021, Victoria Gold completed drilling at the near-surface, high-grade Lynx target with additional encouraging results in March 2022. Exploration potential both near-mine and across the broader land package ‘Project 250’ is anticipated to increase the average annual gold production to 250,000 ounces of gold by 2023 Dublin Gulch, Yukon
FRANCO-NEVADA CORPORATION 73 THE GOLD INVESTMENT THAT WORKS Musselwhite Leased Lands Unpatented Lands Deposits N Main Mine Trend Mill Outside Boundary 5% NPI Opapimiskan Lake Zeemel Lake Kilometres O 1.5 3 Karl Zeemal Area 2% NSR PQD North Saddle Lynx Zone 5% NPI 5% NPI 5% NPI Canoe Zone Camp Zone West Anticline Zone Bay Zone Musselwhite Quebec Ontario Canada PRECIOUS METALS DIVERSIFIED ASSETS RESERVES AND RESOURCES ADDITIONAL INFORMATION 2021 2020 2019 Revenue to Franco-Nevada 1 ($ million) $ – $ – $ – P&P Reserves (koz Au) 2 1,770 1,790 2,090 M&I Resource (koz Au) 2 2,200 2,130 2,920 Inferred Resource (koz Au) 2 440 410 440 P&P Royalty Ounces (000s) 3 38 40 38 M&I Royalty Ounces (000s) 2, 3 47 48 53 Inf Royalty Ounces (000s) 3 9 9 8 1 Re venue to Franco-Nevada represents the actual NPI revenue paid and earned for each year 2 Please r efer to the tables on pages 128-136 for a breakout of grade and tonnages by Mineral Resource category; all M&I categories are inclusive of Mineral Reserves 3 For Ro yalty Ounce calculation, Franco-Nevada estimates 100% of the Mineral Reserves and Mineral Resources are subject to our royalty interest and estimates a rate of 2.2% (2.2% in 2020, 1.8% in 2019) is applicable assuming an all in cost of $1,026/ounce ($967/ounce in 2020, $894/ounce in 2019). Please see page 30 for our methodology on calculating Ro yalty Ounces for an NPI Musselwhite Au Ontario, Canada Operator: Newmont Corporation Royalty: NPI: 5%; NSR: 2% Precious Metals Franco-Nevada has a 5% NPI royalty that covers all of the original leased lands at the Musselwhite operation. The area is estimated to cover 120 km 2 in northwestern Ontario, 480 km north of Thunder Bay. The royalty also covers an area of interest surrounding the property as shown in the schematic. Franco-Nevada’s Musselwhite interest is a profit royalty which did not become payable until historical capital and operational costs had been recovered by the operator in 2011. In September 2019, Franco-Nevada acquired from Premier a 2% NSR on property owned by Newmont, adjoining Musselwhite, and covering approximately 6.3 km 2 of the projected northwest extension of Newmont’s Musselwhite mine, as shown in the schematic. Large land package with additional royalty covering the projected northwest extension of Musselwhite Material Handling Project positively impacting production and operating costs The mine is a fly-in/fly-out under ground operation which began operating in April 1997 and has produced over 3.0 million ounces of gold. Operations had been reduced since March 2019 due to a fire at the mine and COVID-19 restrictions. The Materials Handling Project, which reached commercial production in December 2020, has enabled hoisting of ore through an underground winze resulting in reduced reliance on high-cost truck haulage. This has led to improved energy efficiency, reduced ventilation requirements, reduced mining costs and an enhanced production profile. Newmont announced in February 2022 that production and productivity at the mine was expected to improve in 2022, with 200,000 ounces of gold expected to be produced versus 152,000 ounces of gold produced in 2021. All-in sustaining costs are expected to decrease to $1,150 per ounce in 2022 from $1,335 per ounce in 2021. Franco-Nevada anticipates payments from its NPI royalties from Musselwhite to resume in the second half of 2022. Musselwhite, Ontario
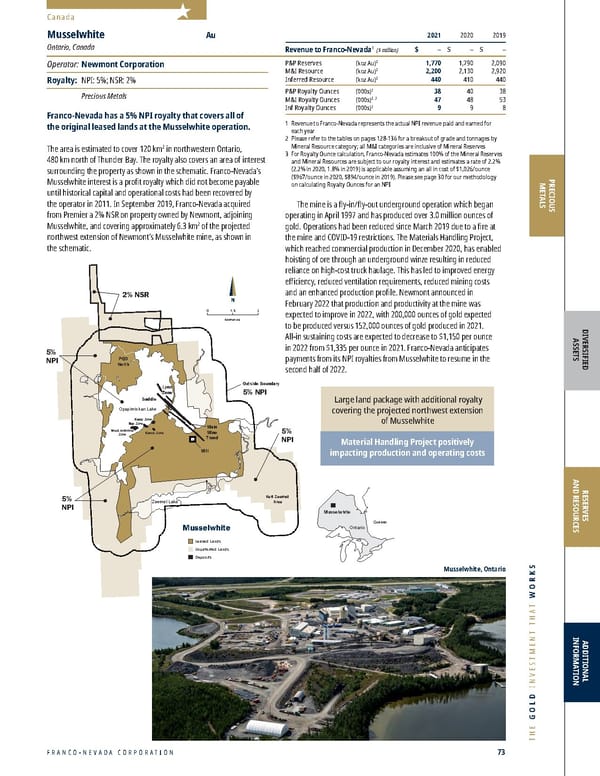
2022 ASSET HANDBOOK 74 FNV TSX NYSE 2021 2020 2019 Revenue to Franco-Nevada ($ million) $ 3.2 $ 3.2 $ 2.7 P&P Reserves (koz Au) 1 541 653 653 M&I Resource (koz Au) 1 675 1,040 1,040 Inferred Resource (koz Au) 1 24 1,161 1,161 P&P Royalty Ounces (000s) 2 12 15 15 M&I Royalty Ounces (000s) 1, 2 15 23 23 Inf Royalty Ounces (000s) 2 1 26 26 1 Please r efer to the tables on pages 128-136 for a breakout of grade and tonnages by Mineral Resource category; all M&I categories are inclusive of Mineral Reserves 2 For Ro yalty Ounce calculation, Franco-Nevada estimates 100% of the Mineral Reserves and Mineral Resources are subject to our royalty interest and estimates a rate of 2.25% is applicable Timmins West Au Ontario, Canada Operator: Pan American Silver Corp. Royalty: NSR: 2.25% Precious Metals Franco-Nevada’s Timmins West 2.25% NSR royalty covers a large land package of approximately 130 km 2 to the west of the City of Timmins, Ontario. The Timmins West property hosts the Timmins and Thunder Creek deposits as well as the 144 Trend exploration zones and the Gold River Trend. Franco-Nevada acquired the royalty from Lake Shore Gold Corp. (“Lake Shore Gold”) in 2012, after Lake Shore Gold put the property into full commercial production in 2011. Lake Shore Gold was acquired by Tahoe Resources Inc. (“Tahoe Resources”) in April 2016, which was subsequently acquired by Pan American Silver Corp. (“Pan American Silver”) in February 2019. Under Pan American Silver , public reporting for both the Timmins West and Bell Creek underground mines has been consolidated into its Timmins operations (Franco-Nevada does not have a royalty on Bell Creek). Pan American Silver pr oduced 133,800 ounces of gold from its Timmins operations in 2021 versus 148,400 ounces of gold in 2020. Gold production is forecast to be between 135,000 ounces and 143,000 ounces in 2022. Or e from both the Timmins West and Bell Creek mines is processed at the Bell Creek mill. Debottlenecking of the plant was conducted to optimize improved efficiencies resulting from the commissioning of the Bell Creek shaft in February 2019. Pan American Silver holds a significant land position in the Timmins Camp providing potential for exploration upside. Exploration success has extended mine life and further exploration potential on the property includes targeting zones below the Thunder Creek deposit as well as at the 144 Trend and Gold River Trend. Canada PRECIOUS METALS N N Bell Creek Mine & Mill Destor-Porcupine Fault Burrows Benedict Fault Mattagami River Fault Bell Creek Complex 4 kms Timmins Deposit Thunder Creek Deposit Gold River Trend 144 Gap Zone Deposit Timmins West 101 Timmins Km 0 20 Dome Mine Hollinger McIntyre Hoyle Pond Pamour Mine Timmins West 2.25% NSR UG Mine Shaft Deposits Timmins West Quebec Ontario Large land package providing exploration upside Exploration success has extended the mine life Timmins West, Ontario
FRANCO-NEVADA CORPORATION 75 THE GOLD INVESTMENT THAT WORKS Canada PRECIOUS METALS DIVERSIFIED ASSETS RESERVES AND RESOURCES ADDITIONAL INFORMATION 2021 2020 2019 Revenue to Franco-Nevada ($ million) $ 2.4 $ 3.1 $ 2.2 P&P Reserves (koz Au) 1 3,534 4,428 4,778 M&I Resource (koz Au) 1 5,214 4,638 5,640 Inferred Resource (koz Au) 1 6,236 6,602 2,922 P&P Royalty Ounces (000s) 2 5 6 9 M&I Royalty Ounces (000s) 1, 2 13 6 10 Inf Royalty Ounces (000s) 2 32 34 21 1 Please r efer to the tables on pages 128-136 for a breakout of grade and tonnages by Mineral Resource category; all M&I categories are inclusive of Mineral Reserves 2 For Ro yalty Ounce calculation, Franco-Nevada estimates 9% of the Mineral Reserves (9% in 2020, 12% in 2019), 16% of the M&I Mineral Resources (9% in 2020, 12% in 2019) and 34% of the Inferred Mineral Resources (34% in 2020, 48% in 2019) are subject to our royalty interest and estimates a rate of 1.5% is applicable Canadian Malartic Au Quebec, Canada Operator: Yamana Gold / Agnico Eagle Royalty: GR: 1.5% Precious Metals In June 2011, Franco-Nevada purchased a 1.5% gross royalty on part of the Canadian Malartic gold project. The project is located in Quebec’s Abitibi mining district and is Canada’s largest gold producer. The royalty covers seven claims on the property including the central portion of the open pit as shown in the schematic which equates to approximately 3 km 2 . Royalty payments are expected to fluctuate annually based on the location of mining relative to the royalty property. Yamana and Agnico Eagle are the 50/50 joint operators of the Canadian Malartic mine following the 2014 acquisition of Osisko Mining Corporation. On a 100% basis, Canadian Malartic pr oduced 714,784 ounces of gold in 2021 versus 2020 production of 568,634 ounces of gold. 2022 gold production at Canadian Malartic is expected to be between 630,000 and 650,000 ounces on a 100% basis, with 2023 and 2024 production forecast to be between 650,000 to 670,000 ounces and 670,000 to 690,000, respectively. During 2021, the mine continued the transition from the Malartic pit to the Barnat pit and production will transition from the open pit to the underground between 2023 to 2029. In 2022, approximately one-third of the production is expected to be sourced from the Canadian Malartic pit and two-thirds from the Barnat pit. The Canadian Malartic open-pit complex contains Proven and Probable Mineral Reserves of 3.5 million ounces of gold (100.5 million tonnes grading 1.09 g/t Au). Franco-Nevada estimates that roughly 9% of the Mineral Reserves of the main open-pit complex are subject to our royalty interest. In February 2021, Y amana and Agnico Eagle announced a positive construction decision on the Odyssey underground project. The Odyssey project hosts three main zones: East Gouldie, East Malartic, and Odyssey (which is further sub-divided into Odyssey North, Odyssey South and Odyssey Internal). As of December 31, 2021, the Odyssey Project contains 2.35 million ounces of gold (25.2 million tonnes grading 2.90 g/t) in Indicated Mineral Resources and 13.15 million ounces Canada’s largest gold producer and long-life asset Open pit and underground exploration targets present additional potential ore sources Mill Malartic (town site) Hwy 117 deviation Canadian Malartic Royalty Area 1.5% Royalty Claims Quartz Veins Mineralized Envelopes Open Pit East Gouldie Barnat Pit Canadian Malartic Pit East Malartic Sladen Jeffrey Pit Sheehan Odyssey Jupiter Odyssey South Odyssey North Rail line Rail line Latest 2021 ‘C’ version 1 0 Km N Gouldie Canadian Malartic Quebec Ontario of gold (173.7 million tonnes grading 2.35 g/t) in Inferred Mineral Resources on a 100% basis. As outlined in this technical report, the Odyssey underground project supports a mine life to at least 2039 with annual gold production of 500,000 to 600,000 ounces when fully ramped up on a 100% basis. One of Franco-Nevada’s royalty claims covers a portion of the Odyssey South extension and two of Franco- Nevada’s royalty claims cover a portion of East Gouldie, as seen in the schematic below. It is estimated that Franco-Nevada’s East Gouldie claims cover approximately 35% of the East Gouldie resource. Infill and step-out drilling at the East Gouldie zone continue to support continuity and scale. In December 2020, r amp development was started on the Odyssey project to facilitate underground drilling and provide access to the Odyssey and East Malartic deposits. The Odyssey project is forecast to gradually start production in the first half of 2023,contributing approximately 46,000 ounces of gold in 2023 and 76,000 ounces of gold in 2024 on a 100% basis. With an estimated depth of 1,800 m, a shaft will be commissioned in 2027 with modest production from East Gouldie in that year. Starting in 2029, on a 100% basis, the mine is expected to produce an average of 545,400 ounces of gold per year with gold production expected to be approximately 6.9 million ounces over a 17-year mine life. Canadian Malarctic, Quebec
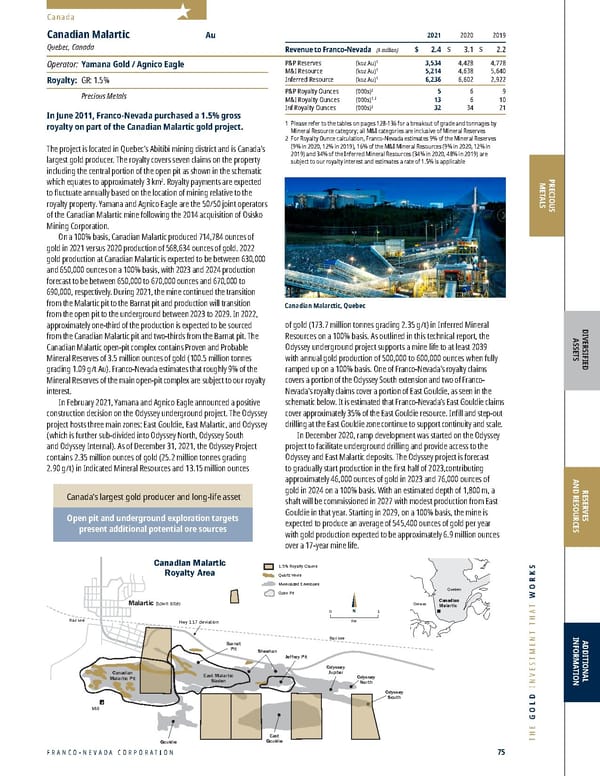
2022 ASSET HANDBOOK 76 FNV TSX NYSE N Meters 0 500 Island Gold Royalty Area 0.62% NSR Island East Northern Zone Island Main Island West FNV Royalty claims Reser ves + Resources 2021 2020 2019 Revenue to Franco-Nevada ($ million) $ 1.5 $ 0.8 $ – P&P Reserves (koz Au) 1 1,338 1,310 – M&I Resource (koz Au) 1 1,624 1,476 – Inferred Resource (koz Au) 1 3,454 3,208 – P&P Royalty Ounces (000s) 2 8 7 – M&I Royalty Ounces (000s) 1, 2 9 8 – Inf Royalty Ounces (000s) 2 19 18 – 1 Please r efer to the tables on pages 128-136 for a breakout of grade and tonnages by Mineral Resource category; all M&I categories are inclusive of Mineral Reserves 2 For Ro yalty Ounce calculation, Franco-Nevada estimates 90% of the Mineral Reserves and Mineral Resources are subject to our royalty interest and estimates a rate of 0.62% is applicable Island Gold Au Ontario, Canada Operator: Alamos Gold Inc. Royalty: NSR: 0.62% Precious Metals In March 2020, Franco-Nevada acquired an existing 0.62% NSR on the Goudreau Lake claims totaling 58 hectares covering the core of the Island Gold mine in western Ontario. The mine is operated by Alamos Gold Inc. (“Alamos”) who acquired the operation in 2016. The mine utilizes longitudinal retreat longhole stoping with cement backfill and ore is processed through a conventional carbon in pulp plant. Alamos produced a total of 140,900 ounces of gold in 2021 from the mine with the majority coming from the royalty claims, an increase from 139,000 ounces of gold in 2020. Gold production is forecast to be between 125,000 to 135,000 ounces in 2022. In the near term, Franco-Nevada expects the majority of production to continue to come from the royalty claims and it is estimated that approximately 90% of the Mineral Reserves and Mineral Resources on the property are covered by Franco-Nevada’s royalty claims. In July 2020, Alamos r eported results of the positive Phase III expansion study conducted on its Island Gold mine. Based on the results of the study, Alamos is proceeding with an expansion of the shaft to 2,000 tpd. The Phase III expansion is expected to increase average annual gold production to 236,000 ounces per year starting in 2025, representing an approximate 67% increase from 2021 production. Combined Mineral Reserves and Resources (including Inferred material) are 5.1 million gold ounces (4.1 million tonnes grading 10.12 g/t of Mineral Reserves, 1.1 million tonnes grading Canada Higher grades at Island Gold to support stable production ahead of expansion Phase III expansion expected to increase average production to 236,000 ounces starting in 2025 Strong exploration potential in Island Gold mining camp PRECIOUS METALS 8.12 g/t of exclusive M&I Resources, and 7.9 million tonnes grading 13.59 g/t of Inferred Mineral Resources) as of December 31, 2021, an increase of 37% since the 2020 Phase III study. Alamos is currently focused on permitting and in March 2022 announced that the Closure Plan Amendment had been filed by the Ontario Government representing a significant milestone for the operation. This will allow for ramp-up of construction activities on the Phase III expansion, including pre-sinking the shaft which is expected to begin mid-2022. An updated and optimized mine plan is expected to be released in the middle of 2022, incorporating growth and mine resequencing. Fr anco-Nevada holds additional royalties in the Island Gold mining camp. These include a 2% NSR royalty on Alamos’ Edwards property located 4 km north-east of the Island Gold mine and a 0.75% NSR royalty on the Cline Lake property immediately adjacent to Edwards. In December 2020, Alamos acquired Trillium Mining Corp. which previously held the Cline Lake property, increasing its land package by approximately 60% in the region. Both of Franco-Nevada’s additional royalties in the mining camp are along strike and on the same geologic structure as the Island Gold mine. Island Gold, Ontario
FRANCO-NEVADA CORPORATION 77 THE GOLD INVESTMENT THAT WORKS Canada PRECIOUS METALS DIVERSIFIED ASSETS RESERVES AND RESOURCES ADDITIONAL INFORMATION Large land position offers future potential KLG merged with Agnico Eagle 2021 2020 2019 Revenue to Franco-Nevada ($ million) $ 0.1 $ 3.0 $ 7.0 P&P Reserves (koz Au) 1 – – 735 M&I Resource (koz Au) 1 2,978 1,872 1,914 Inferred Resource (koz Au) 1 1,421 1,407 1,394 P&P Royalty Ounces (000s) 2 – – 57 M&I Royalty Ounces (000s) 1, 2 160 138 141 Inf Royalty Ounces (000s) 2 90 90 89 1 Please r efer to the tables on pages 128-136 for a breakout of grade and tonnages by Mineral Resource category; all M&I categories are inclusive of Mineral Reserves. Mineral Reserves and Mineral Resources are the sum of Golden Highway - Holt Complex (which includes Holt, Holloway and Taylor) and Golden Highway - Hislop 2 For Ro yalty Ounce calculation, Franco-Nevada estimates 100% of the Mineral Reserves and Mineral Resources are subject to our royalty interest and estimates rates of: Holt 10%; Holloway 3%; Taylor 1%; Hislop 4%; Aquarius 2% Golden Highway Au Ontario, Canada Operator: Agnico Eagle Mines Limited Royalty: NSR: 0.25-10% Precious Metals Franco-Nevada has multiple NSR royalties ranging from 0.25 to 10% over the Destor-Porcupine mineral trend just east of Timmins, Ontario spread over more than 120 km and estimated to cover over 340 km 2 . Kirkland Lake Gold (“KLG”) acquired St Andrew Goldfields (“St Andrew”) in January 2016, which previously owned and operated most of the properties along the trend on which Franco-Nevada has royalties. On February 8, 2022, Agnico Eagle and KLG completed a merger of equals, with the combined company continuing as Agnico Eagle (see pages 67 and 71 for additional assets operated by Agnico Eagle). Franco-Nevada has royalties on the following key properties in the trend: Holt: The Holt mine has been the main producing asset in recent years and includes the Holt mill complex. Franco-Nevada has a sliding scale NSR royalty beginning at 2% when the gold price is less than or equal to $500/ounce and increasing in 1% increments for each $100/ounce increase in the gold price, to a maximum of 10%. The Holt mine was built in the late 1980s by Barrick. Taylor: The Taylor mine (1% NSR) achieved commercial production in November 2015. Exploration potential at Taylor exists along strike and at depth of current Mineral Resources. Holloway: The Holloway mine is located immediately north of the Holt property with ore historically processed at the Holt mill. The Holloway mine was placed on care and maintenance at the end of 2016 due to limited economic viability. In an effort to improve the economics of the operation, in 2019, Franco-Nevada agreed to reduce the royalty at Holloway to a flat 3% NSR from the previous sliding scale royalty. The mine resumed operations in early 2019, prior to the current suspension. 1% NSR 1-2% NSR 1% NSR 4% NSR 0.25-1% NSR 101 20 kilometres Present or past producing mine Stoughton Stock Mine and Mill Royalty Matheson Porcupine Timmins Lake Abitibi Frederick House Lake Night Hawk Lake Kenogamisis Lake Holloway Mine Holt Mine Jonpol Ross Mine Apollo Black Fox Taylor Royalty Ludgate Kidd Creek Porcupine Peninsula Royal Oak Bell Creek Owl Creek Hoyle Pond Kinross 1060 Zone Broulan Reef Delnite Aunor Paymaster Dome McIntyre Hollinger Hallnor Pamour #1 Matheson German Stock Taylor Cody Macklem Bond Currie Carr Beatty Bowman Hislop Guibord 11 ONR Destor-Porcupine Fault Zone Pipestone Fault Cook Barnet Thackeray Harker Garrison Rand Michaud Munro McCool Aquarius Royalty Hislop Royalty Frecheville Holt Royalty Lamplugh Lake Abitibi 101 11 Marriot Central Timmins Royalty Claims Holloway Royalty Sliding scale 3% NSR Zone 7 Royalty Sliding scale Holloway 0.5-2.5% NSR Stoughton Royalty N Golden Highway Quebec Ontario Hislop: Franco-Nevada has a 4% NSR on the Hislop mine which is located approximately 50 km to the west of the Holt mill. The open-pit Mineral Reserves for the Hislop open pit were fully depleted in 2014. Aquarius: Franco-Nevada holds a 1-2% sliding scale NSR (2% when gold price is greater than $1,000/ounce) on the majority of claims surrounding and including the Aquarius deposit. Under KL G and now Agnico Eagle, Holt, Holloway and Taylor were amalgamated into the Holt Complex for reporting purposes, all of which have fed the Holt mill for processing. The Holloway mine was placed on care and maintenance in March 2020. Operations at the remainder of the Holt Complex were suspended effective April 2020. In August 2020, KL G and Newmont entered into a strategic alliance agreement, with Newmont acquiring an option on certain mining and mineral rights related to the Holt property. Agnico Eagle plans to evaluate the potential to integrate a number of satellite deposits with the existing infrastructure in the region which may displace production from royalty ground in the short to medium term. Golden Highway, Ontario
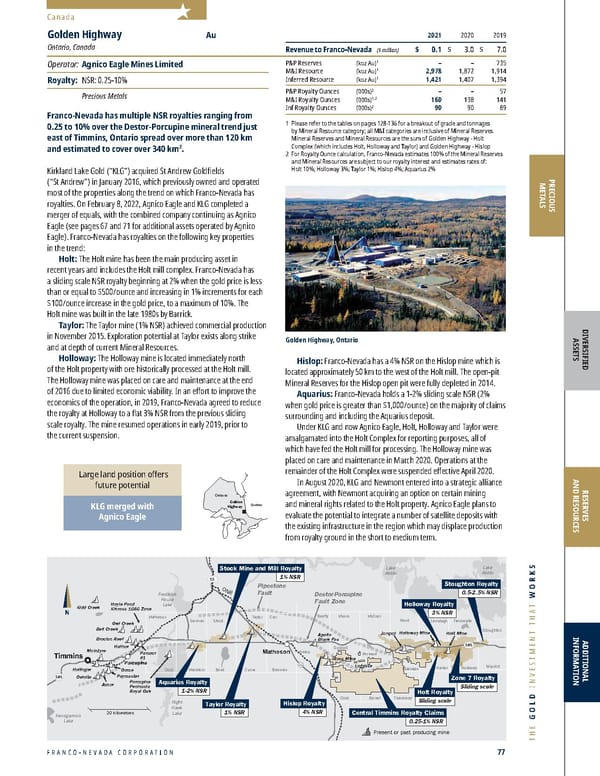
2022 ASSET HANDBOOK 78 FNV TSX NYSE 2021 2020 2019 Revenue to Franco-Nevada ($ million) $ – $ – $ – P&P Reserves (koz Au) 1 5,538 5,539 4,648 M&I Resource (koz Au) 1 7,105 7,008 7,105 Inferred Resource (koz Au) 1 3,095 3,072 3,095 P&P Royalty Ounces (000s) 2 166 166 139 M&I Royalty Ounces (000s) 1, 2 213 210 213 Inf Royalty Ounces (000s) 2 93 92 93 1 Please r efer to the tables on pages 128-136 for a breakout of grade and tonnages by Mineral Resource category; all M&I categories are inclusive of Mineral Reserves 2 For Ro yalty Ounce calculation, Franco-Nevada estimates 100% of the Mineral Reserves and Mineral Resources are subject to our royalty interest and estimates a rate of 3.0% is applicable Greenstone (Hardrock) Au Ontario, Canada Operator: Equinox Gold Corp. / Orion Mine Finance Royalty: NSR: 3% Precious Metals Franco-Nevada acquired a 3% NSR on Hardrock as part of its acquisition of a portfolio of approximately 20 royalties from Barrick in November 2013. The Hardrock property, now called Greenstone, is being advanced by Greenstone Gold Mines L.P. (“Greenstone”), a 60/40 partnership between Equinox Gold and Orion Mine Finance (“Orion”). Equino x Gold announced that construction of the project had commenced in Q4 2021 with the first gold pour targeted for the first half of 2024. The project has a construction budget of $1.2 billion on a 100% basis, with Equinox Gold funding 60%. Equinox Gold’s primary development focus for 2022 is construction at Greenstone, with Equinox Gold’s 60% share of construction capital forecast at $326 million. Activities in Q1 2022 will focus on placing the majority of the remaining equipment contracts, advancing earthworks and concrete construction activities and initiating preparatory works for steel erection that will begin in Q2 2022. An optimized feasibility study in December 2020 contemplated the construction of a 27,000 tonne per day processing facility and open-pit mining operation with production over a 14-year mine life. Gold production during the first five years is expected to average 414,000 ounces per annum with an average head grade of 1.45 g/t gold. Equinox Gold anticipates approximately 2 years of construction with 6 months of commissioning. Canada First gold pour targeted for the first half of 2024 Optimized feasibility study outlines potential 14-year mine life producing 414,000 ounce per annum during the first five years PRECIOUS METALS Salsberg Ashmore Greenstone (Hardrock) Royalty Area 3% NSR McKelvie Lindsey Parent N Kilometres 0 3 Errington Ontario Hardrock (Geraldton) Royalty Area Mineralized zones Mosher Sha SP Zone Hardrock Geraldton Other Royalty Claims The Gr eenstone mine encompasses a total Proven and Probable Mineral Reserve of 5.5 million ounces of gold (135.3 million tonnes grading 1.27 g/t) and a total Inclusive M&I Resource of 7.1 million ounces of gold (147.5 million tonnes grading 1.50 g/t) for the project. All community and benefits agr eements are in place and a Definitive Agreement with Long Lake #58 First Nation was signed in 2018. In November 2019, Greenstone announced that it had signed a Long-term Relationship Agreement with Aroland First Nation, Animbiigoo Zaagi’igan Anishinaabek, and Ginoogaming First Nation, with respect to the development and operation of the project. The provincial Environmental Assessment for Greenstone was approved in March 2019 and the federal Environmental Assessment was approved in December 2018. Greenstone (Hardrock), Ontario
FRANCO-NEVADA CORPORATION 79 THE GOLD INVESTMENT THAT WORKS N Km O 75 Deer Lake Corner Brook Springdale Grand Falls Badger Stephenville Valentine Lake Property Buchans Millertown Duck Pond Mine Granite Canal Substation Teck Resources Duck Pond Mine Millertown Buchans Buchans Junction Valentine Lake Thrust Fault Marathon Deposit Leprechaun Deposit Victory Deposit Sprite Deposit Frank Zone N Km O 20 Valentine Lake Gold Camp Powerline Granite Canal Hydro Facility Marathon Gold Corporation Berry Zone N Km O 75 Deer Lake Corner Brook Springdale Grand Falls Badger Stephenville Valentine Lake Property Buchans Millertown Duck Pond Mine Granite Canal Substation Teck Resources Duck Pond Mine Millertown Buchans Buchans Junction Valentine Lake Thrust Fault Marathon Deposit Leprechaun Deposit Victory Deposit Sprite Deposit Frank Zone N Km O 20 Valentine Lake Gold Camp Powerline Granite Canal Hydro Facility Marathon Gold Corporation Berry Zone Valentine Lake Quebec Ontario Newfoundland Canada PRECIOUS METALS DIVERSIFIED ASSETS RESERVES AND RESOURCES ADDITIONAL INFORMATION 2021 2020 2019 Revenue to Franco-Nevada ($ million) $ – $ – $ – P&P Reserves (koz Au) 1 2,100 1900 – M&I Resource (koz Au) 1 3,138 3,092 3,090 Inferred Resource (koz Au) 1 1,639 958 960 P&P Royalty Ounces (000s) 2 32 29 – M&I Royalty Ounces (000s) 1,2 47 46 62 Inf Royalty Ounces (000s) 2 25 14 19 1 Please r efer to the tables on pages 128-136 for a breakout of grade and tonnages by Mineral Resource category; all M&I categories are inclusive of Mineral Reserves 2 For Ro yalty Ounce calculation, Franco-Nevada estimates 100% of the Mineral Reserves and Mineral Resources are subject to our royalty interest and estimates a rate of 1.5% is applicable in anticipation that Marathon Gold exercises its right to repurchase 0.5% of the 2.0% NSR Valentine Lake Au Newfoundland, Canada Operator: Marathon Gold Corporation Royalty: NSR: 2% Precious Metals Franco-Nevada purchased a 2% NSR on the Valentine Lake Gold Camp in central Newfoundland in February 2019. The project is being advanced by Marathon Gold Corporation (“Marathon Gold”). When completed, the Valentine Gold project will be the largest gold mine in Atlantic Canada. The royalty is subject to a 0.5% buyback provision for $7 million until December 31, 2022. The V alentine Gold project comprises a series of mineralized deposits along a 20 km trend. In March 2021, Marathon Gold announced the results of a feasibility study outlining a mine plan based on the same two-pit and centralized mill strategy first presented in an April 2020 prefeasibility study. The feasibility study presented an updated Mineral Reserve and Mineral Resource estimate, refined mine and mill designs supported by additional geotechnical and metallurgical data, and updated capital and operating cost estimates. The feasibility study outlines a 13-year mine life, 22-month construction and commissioning schedule, with an average gold production profile of 173,000 ounces of gold per year between 2024 and 2033 from the processing of high-grade mill feed, and 56,000 ounces of gold per year between 2034 and 2036 from the processing of low-grade stockpiles. The pr oject has estimated Proven and Probable Mineral Reserves of 2.05 million ounces of gold (47.06 million tonnes grading 1.36 g/t) and total Measured and Indicated Mineral Resources (inclusive of the Mineral Reserves) of 3.14 million ounces of gold (56.66 million tonnes grading 1.72 g/t). Additional Inferred Mineral Resources are 1.00 Moz (18.25 Mt at 1.70 g/t Au). In September 2020, Marathon Gold filed its Environmental Impact Statement (“EIS”) to the relevant provincial and federal agencies. In March 2022, Marathon Gold announced that the Newfoundland and Labrador Minister of Environment and Climate Change had completed its review of the EIS. Concurrently, Marathon Gold was advised that the project had received approval by the Cabinet of the Government of Newfoundland and Labrador, marking the completion of the provincial Environmental Assessment (“EA”) process, allowing Marathon Gold to commence site-specific permitting including the acquisition of the project Mining Lease while awaiting final release from the federal EA. Marathon Gold is currently contemplating construction in 2023. Mar athon Gold continues to report positive exploration results from ongoing in-fill drilling of the Berry Deposit. The company completed 74,100 m of drilling at the Berry Deposit, Sprite Deposit and Victory Deposit in 2021, with encouraging results for each area. In 2022, the exploration program continues to focus on drilling at the Berry Deposit, Victory Deposit and Grassroots Discovery. Marathon Gold targeting construction in 2023 Continued exploration with focus on the Berry Zone, resource conversion and new discoveries along trend Valentine Lake, Newfoundland
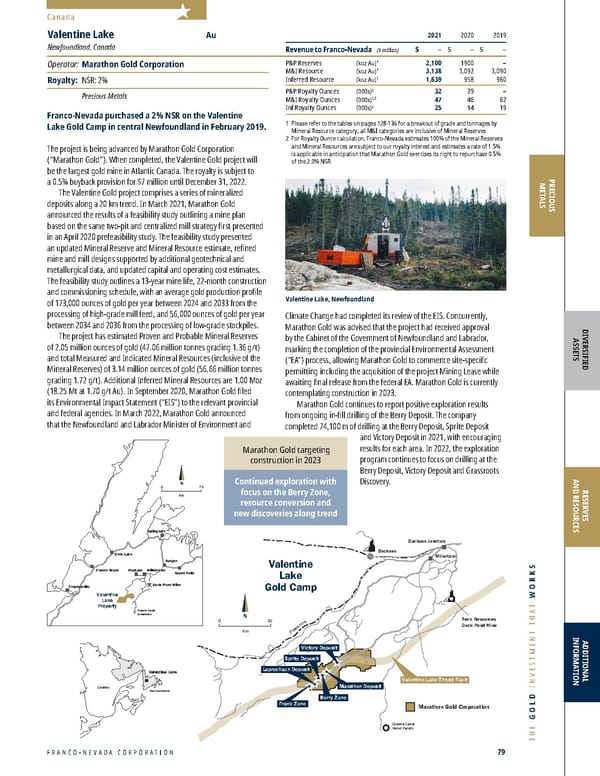
2022 ASSET HANDBOOK 80 FNV TSX NYSE PRECIOUS METALS Canada Other Canada Assets Canada Precious Metals Please refer to the tables on pages 128-136 for a breakout of grade and tonnages by Mineral Resource category. Franco-Nevada holds a 1% NSR on the past-producing Eskay Creek gold-silver project in British Columbia’s Golden Triangle. Eskay Creek was the highest-grade gold mine in the world when in production, producing 3.3 million ounces of gold and 160 million ounces of silver at average grades of 45 g/t gold and 2,224 g/t silver from 1994-2008. In July 2021, Skeena Resources Limited (“Skeena”) announced a positive prefeasibility study, outlining average annual production of 249,000 ounces of gold and 7.2 million ounces of silver over a 10-year mine life. The prefeasibility study indicated a high-grade open-pit with Proven and Probable Mineral Reserves of 3.88 Moz AuEq (26.4 Mt at 3.37 g/t Au and 94 g/t Ag) and a mill throughput of 7,945 tpd with a flotation plant producing saleable concentrate. Skeena anticipates further increases to the annual production profile as part of a feasibility study expected in 2022. In December 2021, Franco-Nevada entered into an agreement with Skeena to amend the terms of its existing 1% NSR royalty agreement such that the existing royalty will cover substantially all of the Eskay Creek gold-silver project land package, including all currently-known mineralized zones. Franco-Nevada was also granted by Skeena a right of first refusal over the sale of a 0.5% NSR royalty on Eskay Creek. If Skeena has not sold the 0.5% NSR royalty by October 2, 2023, Franco-Nevada will have the right to purchase this royalty for C$22.5 million. In January 2022, Skeena released positive exploration results with the discovery of the 23 Zone and, in March 2022, announced the 21A West Zone Expansion discovery, both of which are covered by Franco-Nevada’s royalty. For Royalty Ounce calculation, Franco-Nevada estimates 100% of the Mineral Reserves and Mineral Resources are subject to our royalty interest and estimates a rate of 1% is applicable Eskay Creek Au & Ag British Columbia, Canada Operator: Skeena Resources Limited Royalty: NSR: 1% Precious Metals Franco-Nevada has a 2% NSR (subject to a buy-back of 0.5%) on the water claims, which cover the majority of Mineral Reserves, of the Bateman gold project in Red Lake, Ontario. In July 2020, Rubicon Minerals Corp. (“Rubicon”) completed its corporate name change to Battle North Gold Corporation (“Battle North”), while also changing the name of the Phoenix gold project to the Bateman gold project. In May 2021, Evolution Mining Limited (“Evolution Mining”) announced the completion of its acquisition of Battle North. Under Evolution Mining, Bateman is being reported under Red Lake for public reporting purposes (Franco-Nevada does not have a royalty on Evolution Mining’s other Red Lake properties). The consolidated operation will consist of the Lower Red Lake, Upper Campbell, Cochenour and McFinley mining areas that will provide ore to the Campbell, Red Lake and Bateman mills with a total processing capacity target of two million tonnes by 2026. Ore from the deposits not covered by Franco-Nevada’s royalty will likely be higher priority through the mills in the short to medium term. The Bateman pr oject is located 10 km north of Evolution Mining’s Red Lake mine. In November 2015, Rubicon announced a temporary shutdown of underground activities to enhance its geologic model and develop an implementation plan as the gold mineralization was more geologically complex than anticipated. This included a material reduction to the contained gold ounces estimated. In October 2020, Battle North announced feasibility study results for the Bateman gold project. The base case study outlined life of mine payable gold production of 602,987 ounces, averaging 73,835 ounces per year for 8.2 years from initial production. Of the 8.2 years, 7 years were classified as commercial production, which the company defined as an average of 70% of the 1,250 tpd permitted capacity, over 90 consecutive days. The project contemplated an 1,800 tpd mill with excess capacity for potential incremental tonnes from F2, McFinley and Pen Zones (contemplating 2,500 tpd for the expanded mill). The 1,800 tpd mill was constructed in 2015 prior to shut down and is currently permitted to 1,250 tpd. Evolution Mining anticipates that the Battle North acquisition will enable growth plans to be accelerated at Red Lake. The acquisition also provides Evolution Mining the opportunity to build on its track record as a safe and sustainable operator for the long-term benefit of a broad range of stakeholders including the local workforce, regional communities and the Wabauskang and Lac Seul First Nation Partners. For Royalty Ounce calculation, Franco-Nevada estimates 100% of the Mineral Reserves and Mineral Resources are subject to our royalty interest and estimates a rate of 1.5% is applicable in anticipation that Evolution Mining exercises its right to repurchase 0.5% of the 2.0% NSR Red Lake (Bateman) Au Ontario, Canada Operator: Evolution Mining Limited Royalty: NSR: 2% Precious Metals
FRANCO-NEVADA CORPORATION 81 THE GOLD INVESTMENT THAT WORKS PRECIOUS METALS DIVERSIFIED ASSETS RESERVES AND RESOURCES ADDITIONAL INFORMATION Canada The Courageous Lake project is an advanced gold exploration project located in the Northwest Territories, Canada. Seabridge Gold Inc. (“Seabridge”) has been advancing the Courageous Lake project and, in July 2012, released results of its first preliminary feasibility study for the asset. The study estimated Mineral Reserves of 6.5 million ounces of gold (91 million tonnes grading 2.20 g/t at the FAT deposit) and projected average annual production of 385,000 ounces over a mine life of 15 years. This project covers only 2 km of a greenstone belt that stretches 53 km and by reserves, the FAT deposit is one of Canada’s largest undeveloped gold deposits. The pr operty also hosts the Walsh Lake Deposit (Inferred Mineral Resource of 4.6 million tonnes grading 3.24 g/t), which is located 10 km south of the larger FAT deposit. Metallurgical testing demonstrated that the Walsh Lake material is free milling. Based on these factors, the Walsh Lake deposit could be mined prior to constructing the processing plant required for the larger, refractory FAT deposit thereby improving the overall economics of the Courageous Lake project. Seabridge is currently redesigning the large-scale project assumed in the 2012 study to determine if a smaller, less capital- intensive design with a smaller footprint and a more current gold price, could improve economics and enhance the permitting process. For Royalty Ounce calculation, Franco-Nevada estimates 100% of Mineral Reserves and Mineral Resources are subject to our royalty interest and estimates an average rate of 1.02% is applicable Courageous Lake Au Northwest Territories, Canada Operator: Seabridge Gold Inc. Royalty: NSR: 1.02% Precious Metals Other Canada Assets Canada Precious Metals Please refer to the tables on pages 128-136 for a breakout of grade and tonnages by Mineral Resource category. The Goldfields project currently consists of two gold deposits: the Box deposit and the Athona deposit. Franco-Nevada has a 2% NSR royalty that covers both deposits. Brigus Gold Corp., which was advancing the project, was acquired by Primero Mining Corp. in 2014. The Goldfields project was not part of the acquisition and was spun out into a company called Fortune Bay Corp. (“Fortune Bay”). In March 2021, Fortune Bay released the results of a new Mineral Resource update for the Box and Athona deposits which outlined an Indicated Mineral Resource of 975,000 ounces of gold (22.6 million tonnes grading 1.34 g/t) and an Inferred Mineral Resource of 176,000 ounces of gold (22.6 million tonnes grading 1.34 g/t). In 2021, a step-out drill pr ogram confirmed the expansion of mineralization to the south, with mineralization remaining open. Fortune Bay identified that the Athona Mine Granite is more broadly mineralized than had previously been indicated by historical drilling. From this the company is advancing a Phase 2 exploration program in Q1 2022 to focus on exploring the defined 2 km stratigraphic target corridor between the Box and Athona deposits, where no previous drilling had been conducted. An estimated 2,000 m diamond drilling program is planned to test up to six targets which have been identified, with drilling commencing in the middle of January 2022. For Royalty Ounce calculation, Franco-Nevada estimates 100% of Mineral Reserves and Mineral Resources are subject to our royalty interest and estimates a rate of 2.0% is applicable. Goldfields Au Saskatchewan, Canada Operator: Fortune Bay Corp. Royalty: NSR: 2% Precious Metals
2022 ASSET HANDBOOK 82 FNV TSX NYSE Other Canada Assets Canada Precious Metals Please refer to the tables on pages 128-136 for a breakout of grade and tonnages by Mineral Resource category. Franco-Nevada has a 1% NSR as well as a $10/oz production payment on gold produced in excess of 1.85 million ounces from the Red Mountain project near Stewart, B.C. Franco-Nevada acquired the royalty as part of the Barrick royalty portfolio in November 2013. In March 2019, Ascot Resources Ltd. (“Ascot”) completed its acquisition of IDM Mining and its 100%-owned Red Mountain project. In October 2019, Ascot announced an updated Mineral Resource and as a result, Measured and Indicated Mineral Resources increased by almost 200,000 ounces of gold compared to a 2017 feasibility study prepared by IDM Mining. Based on the updated Mineral Resource a revised feasibility study was released in April 2020 which envisioned the feed from four deposits (Big Missouri, Silver Coin, Premier and Red Mountain) being processed at the Premier mill. The Premier mill required refurbishment and expansion as it had been on care and maintenance for over 20 years. The updated feasibility study contemplated Red Mountain ore being processed in the second year of operation for approximately 7 years and contributing roughly half the ore feed for the mill, or approximately 70,000 ounces per annum in year 3 to 7. Ascot has since indicated that it would defer Red Mountain development until later in mine life and commercial production of the combined operation is expected in H2 2023. The Red Mountain project received federal Environmental Assessment approval in January 2019 and, in April 2019, signed a Benefits Agreement with the Nisga’a Nation. In July 2021, Ascot signed an updated Benefits Agreement for both the Premier Gold and Red Mountain project. For Royalty Ounce calculation, Franco-Nevada estimates 100% of Mineral Reserves and Mineral Resources are subject to our royalty interest and estimates an average rate of 1.0% is applicable Red Mountain Au British Columbia, Canada Operator: Ascot Resources Ltd. Royalty: NSR: 1% / Production Payment Precious Metals PRECIOUS METALS Canada In June 2015, Yamana acquired Mega Precious Metals Inc. and the Monument Bay property, which is located in Manitoba, approximately 570 km northeast of Winnipeg adjacent to the Ontario border. Monument Bay consists of 136 contiguous claims and hosts a Measured and Indicated Mineral Resource base of 1.79 million ounces of gold in 36.6 million tonnes grading 1.52 g/t. Franco-Nevada holds a 2% NSR royalty on the first 1.0 million ounces produced and a 3% NSR on any additional production. In September 2018, Yamana signed an Exploration Agreement with Red Sucker Lake First Nations in relation to the Monument Bay exploration site. Mineral Resources for Monument Bay demonstrate a large mineralized envelope with higher grade plunging mineralized shoots that continue at depth. In both 2020 and 2021, Yamana focused on exploring these high-grade extensions and on targets surrounding the Twin Lakes shear zone, an area believed to host considerable opportunities for resource expansion. The Twin Lakes deposit was originally being considered as an open-pit operation but is being re-evaluated as an underground project, with internal studies indicating the presence of steeply plunging higher-grade shoots within the open-pit Mineral Resource. Recently completed deep drilling provided an initial test of the depth extent and potential of several well-defined high-grade steeply plunging mineralized shoots along the 4 km strike length of the deposit. For Royalty Ounce calculation, Franco-Nevada estimates 100% of Mineral Reserves and Mineral Resources are subject to our royalty interest and estimates an average rate of 2.0% is applicable for the first 1.0 million ounces produced and 3.0% on any additional ounces Monument Bay Au Manitoba, Canada Operator: Yamana Gold Inc. Royalty: NSR: 2-3% Precious Metals Red Mountain, British Columbia
FRANCO-NEVADA CORPORATION 83 THE GOLD INVESTMENT THAT WORKS Canada Other Canada Assets Canada Precious Metals Please refer to the tables on pages 128-136 for a breakout of grade and tonnages by Mineral Resource category. Osisko Development Corp. (“Osisko Development”) is advancing the Cariboo Gold project in east-central British Columbia. In November 2019, Osisko Gold Royalties Ltd. completed its acquisition of Barkerville Gold Mines Ltd. and, in November 2020, spun the asset out into Osisko Development. The property consists of 2,120 km 2 of mineral rights located 85 km east of the town of Quesnel. The area has historical underground and alluvial production of 4.5 million ounces of gold from 1933 to 1967. Osisko Development started producing at the Bonanza Ledge II deposit in Q2 2021 and announced in October 2021 receipt of the final permits for the Bonanza Ledge II mine and QR mill. Production was previously estimated at 62,000 ounces over 2 years. The Bonanza Ledge II Mineral Resource includes the BC Vein, Bonanza Ledge, and KL Zone deposits. Franco-Nevada’s 3% NSR covers the claims to the immediate north-east of Bonanza Ledge, referred to as the KL Zone. Franco-Nevada’s 3% royalty interest also includes the Williams Claims which are about 5 km south east of Bonanza Ledge. While mining Bonanza Ledge II, studies continue to advance for the other deposits along the Cariboo trend. An August 2019 PEA scoped the overall project at 4,000 tpd with approximately 200,000 ounces per year over 11 years. In 2021, 152,500 m of drilling was conducted on the Cariboo Gold project to support the ongoing feasibility study, which is expected in H1 2022. The mineral resource estimate incorporates eight deposit areas: the Shaft and Mosquito Creek deposits on Island Mountain, Cow and Valley deposits on Cow Mountain, and Lowhee, KL, BC Vein and Bonanza Ledge deposits on Barkerville Mountain. Osisko Development is waiting for receipt of the remaining permits, expected in Q3 2022, before starting construction at Cariboo, with production anticipated to start in 2023. An updated reserve and resource estimate at Cariboo and a feasibility study with full reserve and mine plan are expected in Q2 2022. Osisko Development has stated the EA Certificate is still on schedule for August/September of 2022. Franco-Nevada has not included Cariboo in Royalty Ounce estimates Cariboo Au British Columbia, Canada Operator: Osisko Development Corp. Royalty: NSR: 3% Precious Metals PRECIOUS METALS DIVERSIFIED ASSETS RESERVES AND RESOURCES ADDITIONAL INFORMATION
2022 ASSET HANDBOOK 84 FNV TSX NYSE Island Gold Red October Henty Duketon Yandal (Bronzewing/Julius) South Kalgoorlie (Mt Martin) Sterling Robinson Fire Creek Bald Mountain Marigold EaglePicher Pinson Midas Goldstrike Gold Quarry South Arturo Hollister Nevada Australia Subika (Ahafo) Tasiast Sabodala Edikan MWS Perama Hill Kiziltepe Karma Sissingue Cobre Panama Falcondo Cerro San Pedro Castle Mountain Rosemont Mesquite Courageous Lake Musselwhite Hemlo New Prosperity Hardrock Detour Lake Midale Weyburn Goldfields Monument Bay Edson Timmins West Sudbury Kirkland Lake Golden Highway Canadian Malartic Nevada Stibnite Gold Cariboo SCOOP Midland Orion Dublin Gulch (Eagle) Red Mountain Delaware STACK Franco-Nevada Head Office Franco-Nevada U.S. Office Franco-Nevada Barbados Office Kivivic 2 Marcellus Guadalupe-Palmarejo Brucejack CentroGold (Gurupi) Cerro Moro Taca Taca NuevaUnión (Relincho) San Jorge Antamina Salares Norte/ Rio Baker Valentine Lake Antapaccay Candelaria Calcatreu Stillwater Alpala Red Lake (Bateman) Milpillas Haynesville Agate Creek White Dam Condestable Séguéla Edna May Higginsville (Lake Cowan) Aphrodite Matilda (Wiluna) Agnew (Vivien) South Kalgoorlie (New Celebration) Cue Gold (Day Dawn) Carol Lake Vale N. System Vale S.E. System Sossego Pandora Producing Advanced PRECIOUS METALS REST OF WORLD
FRANCO-NEVADA CORPORATION 85 THE GOLD INVESTMENT THAT WORKS MWS 5 MWS 4 H1 H2 H5 B5 B2 B1 B3 B4 H6 Tailings storage facility site AngloGold Ashanti Dumps N 12 Plant Site MWS Hartebeestfontein Buffelsfontein Vaal West SPD Vaal East STILFONTEIN Town MWS 25% Gold Stream N Kilometres 0 2.5 Atlantic Ocean Indian Ocean SOUTH AFRICA BOTSWANA NAMIBIA ZIMBABWE MOZAMBIQUE MWS PRECIOUS METALS DIVERSIFIED ASSETS RESERVES AND RESOURCES ADDITIONAL INFORMATION Rest of World 2021 2020 2019 Revenue to Franco-Nevada ($ million) $ 41.3 $ 41.8 $ 37.1 P&P Reserves (koz Au) 1 1,749 1,930 2,180 M&I Resource (koz Au) 1 1,946 2,150 2,180 Inferred Resource (koz Au) 1 – – – P&P Royalty Ounces (000s) 2 54 71 84 M&I Royalty Ounces (000s) 1, 2 54 71 84 Inf Royalty Ounces (000s) 2 – – – 1 Please r efer to the tables on pages 128-136 for a breakout of grade and tonnages by Mineral Resource category; all M&I categories are inclusive of Mineral Reserves 2 For Ro yalty Ounce calculation, Franco-Nevada estimates 71,749 stream ounces (94,764 stream ounces in 2020, 118,194 stream ounces in 2019) to be delivered and factored by 75% (75% in 2020, 71% in 2019) to estimate equivalent Royalty Ounces MWS Au South Africa, Rest of World Operator: Harmony Gold Mining Company Limited Stream: 25% Gold Stream Precious Metals Franco-Nevada, through its acquisition of Gold Wheaton in March 2011, receives 25% of gold produced from the Mine Waste Solutions (“MWS”) project. MWS is a gold and uranium tailings recovery operation located near Stilfontein, approximately 160 km west of Johannesburg, South Africa. The operation processes multiple tailings dumps in the area through three production modules. It also includes a modern tailings storage facility approximately 15 km from the gold plant. Franco-Nevada makes ongoing payments equal to the lesser of $400/ounce of payable gold (subject to a 1% annual inflation that commenced December 2012) and the spot price for gold. The current ongoing price is equal to $441.84 per ounce of gold as of December 2021. In September 2020, Harmony Gold Mining Company Limited (“Harmony”) acquired MWS from AngloGold Ashanti Limited (“AngloGold Ashanti”). AngloGold Ashanti had purchased the operation from First Uranium Corporation in July 2012. As part of the AngloGold Ashanti purchase, Franco-Nevada amended the agreement and is now entitled to receive 25% of all the gold produced through the MWS plant, including treatment of AngloGold Ashanti’s tailings, until Franco-Nevada has received 312,500 ounces of gold. In 2021, Fr anco-Nevada sold 23,016 ounces of gold that had been received under the agreement, compared with 23,430 ounces of gold sold in 2020. As at December 31, 2021, Franco-Nevada has received 240,751 ounces of gold of the 312,500 ounce cap since the amendment of the agreement. The cap is currently expected to be reached in late 2024. Franco-Nevada is entitled to 25% of all gold produced until 312,500 ounces are received Upside limited by production cap on payments Island Gold Red October Henty Duketon Yandal (Bronzewing/Julius) South Kalgoorlie (Mt Martin) Sterling Robinson Fire Creek Bald Mountain Marigold EaglePicher Pinson Midas Goldstrike Gold Quarry South Arturo Hollister Nevada Australia Subika (Ahafo) Tasiast Sabodala Edikan MWS Perama Hill Kiziltepe Karma Sissingue Cobre Panama Falcondo Cerro San Pedro Castle Mountain Rosemont Mesquite Courageous Lake Musselwhite Hemlo New Prosperity Hardrock Detour Lake Midale Weyburn Goldfields Monument Bay Edson Timmins West Sudbury Kirkland Lake Golden Highway Canadian Malartic Nevada Stibnite Gold Cariboo SCOOP Midland Orion Dublin Gulch (Eagle) Red Mountain Delaware STACK Franco-Nevada Head Office Franco-Nevada U.S. Office Franco-Nevada Barbados Office Kivivic 2 Marcellus Guadalupe-Palmarejo Brucejack CentroGold (Gurupi) Cerro Moro Taca Taca NuevaUnión (Relincho) San Jorge Antamina Salares Norte/ Rio Baker Valentine Lake Antapaccay Candelaria Calcatreu Stillwater Alpala Red Lake (Bateman) Milpillas Haynesville Agate Creek White Dam Condestable Séguéla Edna May Higginsville (Lake Cowan) Aphrodite Matilda (Wiluna) Agnew (Vivien) South Kalgoorlie (New Celebration) Cue Gold (Day Dawn) Carol Lake Vale N. System Vale S.E. System Sossego Pandora Producing Advanced MWS, South Africa
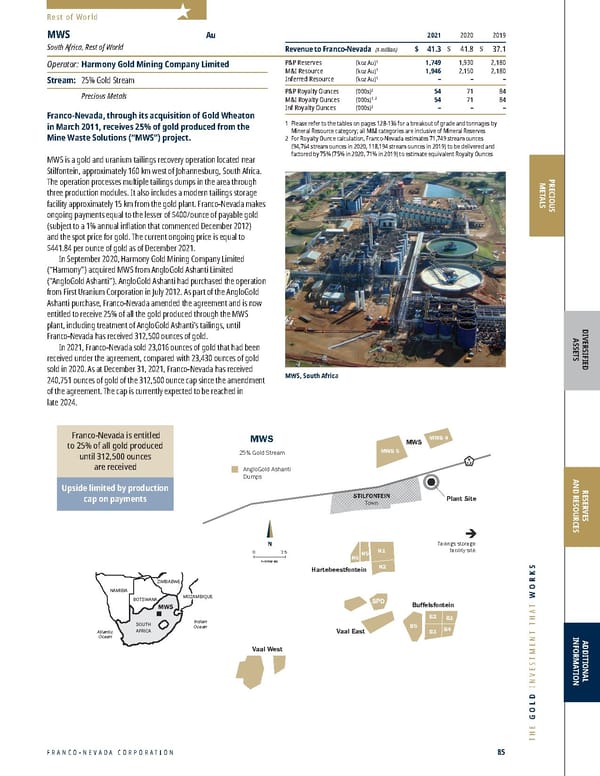
2022 ASSET HANDBOOK 86 FNV TSX NYSE N Kilometres 0 20 Sabodala 22.5 K oz/yr for 6 yrs; then 6% Stream Sabodala Concession OJVG Concession Deposits N Kilometres 0 2.5 10 kilometres from mill Mill OJVG Sabodala Sabodala West Golouma Deposits Masato Deposit Niakafiri Deposit Sabodala Pit Tailings Gora Deposit Senegal Mali Mauritania Sabodala Dakar Guinea Atlantic Ocean Atlantic Ocean SENEGAL MALI MAURITANIA GUINEA COTE D’IVOIRE LIBERIA SIERRA LEONE GAMBIA GUINEA-BISSAU Sabodala PRECIOUS METALS 2021 2020 2019 Revenue to Franco-Nevada ($ million) $ 16.7 $ 21.6 $ 29.5 P&P Reserves (koz Au) 1 4,796 2,190 2,190 M&I Resource (koz Au) 1 6,640 3,730 3,729 Inferred Resource (koz Au) 1 1,728 976 976 P&P Royalty Ounces (000s) 2 75 85 105 M&I Royalty Ounces (000s) 1, 2 112 159 179 Inf Royalty Ounces (000s) 2 35 47 47 1 Please r efer to the tables on pages 128-136 for a breakout of grade and tonnages by Mineral Resource category; all M&I categories are inclusive of Mineral Reserves 2 In 2021, Fr anco-Nevada estimates that 42% of the remaining Mineral Reserves & Mineral Resources at the Sabodala-Massawa Complex are subject to a rate of 4.8% (6.0% gold stream which is factored by 80% to estimate equivalent Royalty Ounce rate). In 2020 and 2019, it was estimated that 100% of the Mineral Reserves & Mineral Resources at Sabodala only were subject to a rate of 4.8% Sabodala Au Senegal, Rest of World Operator: Endeavour Mining Corporation Stream: Fixed gold deliveries / 6% Gold Stream Precious Metals In December 2013, Franco-Nevada (Barbados) Corporation, a subsidiary of Franco-Nevada, provided Teranga Gold Corporation (“Teranga”) with a $135 million deposit to fund the acquisition by Teranga of additional future ore sources for its Sabodala mill. With the acquisition, Teranga was able to expand its land package to over 950 km 2 including much of a 70 km prospective greenstone belt. In February 2021, Endeavour Mining Corporation (“Endeavour”) acquired Teranga. Over the first six years, T eranga delivered 22,500 ounces of gold annually to Franco-Nevada, under a fixed arrangement, for a total of 135,000 ounces of gold delivered. The fixed delivery period was fulfilled in December 2019 and, between January 2020 and August 2020, Franco-Nevada received 6% of the gold produced from either the Sabodala or Oromin Joint Venture (“OJVG”) properties. In December 2019, T eranga announced an agreement to acquire the adjacent Massawa gold project and commenced processing ore from the project in 2020. Franco-Nevada’s stream does not extend to the Massawa gold project area. In September 2020, Fr anco-Nevada amended its existing Sabodala gold purchase and sale agreement with Teranga to compensate for displacement from the processing of Massawa ore through the Sabodala processing facilities and to provide for certain protocols for the commingling of Sabodala and Massawa ores. The amended agreement provides that effective September 1, 2020, Teranga, now Endeavour, will make fixed deliveries of 783.33 ounces of refined gold per month until 105,750 ounces of gold have been delivered to Franco-Nevada (the “Fixed Delivery Period”) and 6% of production from the stream area thereafter. Following the Fixed Delivery Period, a reconciliation will be conducted to determine if Franco-Nevada would have received more or less than 105,750 ounces of gold under Rest of World Fixed gold deliveries per year until 2031, and thereafter 6% of gold production from Sabodala concessions Land package offers significant exploration potential the 6% variable stream during such period. Endeavour will be entitled to a credit for an over-delivery which will be applied against the 6% variable stream until depleted and Franco-Nevada will be entitled to a one-time additional delivery in the case of an under-delivery. Franco-Nevada will make ongoing payments for each ounce of gold delivered equal to 20% of the spot gold price. Sabodala, Senegal
FRANCO-NEVADA CORPORATION 87 THE GOLD INVESTMENT THAT WORKS Tasiast Main Trend 2% NSR Royalty Boundar y TASIAST MAURITANIA MALI SENEGAL ALGERIA Original Royalty Area Tasiast Permit Area Plant Site Tasiast License Area, March 2012 Tasiast Mining License Tasiast Sud Gold Prospects Trends Resource/Reser ve Target Plant Site Tasiast Sud N Km 0 10 PRECIOUS METALS DIVERSIFIED ASSETS RESERVES AND RESOURCES ADDITIONAL INFORMATION 2021 2020 2019 Revenue to Franco-Nevada ($ million) $ 6.7 $ 14.3 $ 10.9 P&P Reserves (koz Au) 1 6,404 6,330 6,783 M&I Resource (koz Au) 1 8,992 9,083 9,417 Inferred Resource (koz Au) 1 971 267 353 P&P Royalty Ounces (000s) 2 128 127 136 M&I Royalty Ounces (000s) 1, 2 180 182 188 Inf Royalty Ounces (000s) 2 19 5 7 1 Please r efer to the tables on pages 128-136 for a breakout of grade and tonnages by Mineral Resource category; all M&I categories are inclusive of Mineral Reserves 2 For Ro yalty Ounce calculation, Franco-Nevada estimates 100% of the Mineral Reserves and Mineral Resources are subject to our royalty interest and estimates a rate of 2.0% is applicable Tasiast Au Mauritania, Rest of World Operator: Kinross Gold Corporation Royalty: NSR: 2% Precious Metals Franco-Nevada has a 2% NSR royalty on the Tasiast project operated by Kinross. Kinross acquired control of Tasiast in September 2010 pursuant to its acquisition of Red Back Mining Inc. The royalty originally covered three large permit areas in Mauritania, West Africa which includes the Tasiast main trend and Tasiast Sud. The most prominent permit area is Tasiast, with a currently reported mining license area of 312 km 2 and a total exploration license area of 3,118 km 2 . In 2021, T asiast produced 170,502 ounces of gold compared with 406,509 ounces in 2020, reflecting the temporary suspension of milling operations as a result of a mill fire in June 2021. Kinross reported that Tasiast returned to full production with throughput gradually ramping up during Q4 2021 and the mill reaching 19,000 to 20,000 tonnes per day in January 2022 on a sustained basis. Kinr oss is implementing a phased expansion of Tasiast. The Phase One expansion was completed during the third quarter of 2018. Phase One increased mill capacity from 8,000 tpd to 12,000 tpd with gold production expected to average 409,000 ounces per year over 2018 to 2027. At the time, Kinross planned a Phase Two expansion at Tasiast to increase mill capacity to 30,000 tpd. In September 2019, Kinross announced it would instead proceed with the Tasiast 24k project, increasing throughput to 21,000 tpd by year-end 2021 and 24,000 tpd by mid-2023. The T asiast 24k project continues to advance well, with the first phase of the project scheduled to reach sustained throughput of 21,000 tonnes per day by the end of the first quarter of 2022. After the mill restart, 21,000 tpd has been achieved periodically in February 2022. The power plant started operations in the fourth quarter of 2021 and commissioning is ongoing at a number of facilities that are part of the project’s first phase. The second phase of the project is also progressing well and is on schedule to reach throughput of 24,000 tonnes per day by mid-2023. Engineering for the second phase of the project is 60% complete, with all major equipment purchased and construction of the site’s third leach tank 50% complete. Rest of World The project is expected to extend the mine life by four years to 2033 and Tasiast is expected to produce over 600,000 ounces of gold per annum over the next three years. In June 2020, Kinr oss announced that it had reached terms with the Government of Mauritania to enhance the partnership between the two parties. Under the terms of the agreement, a 30-year exploitation license for Tasiast Sud would be granted, among other items. In December 2019, Kinross signed a $300 million project financing for Tasiast with the IFC (a member of the World Bank Group), Export Development Canada, and two commercial banks. Tasiast 24k project on track to ramp-up to 24,000 tpd by mid-2023 Prospective 75 km long greenstone belt, including Tasiast Sud Tasiast, Mauritania
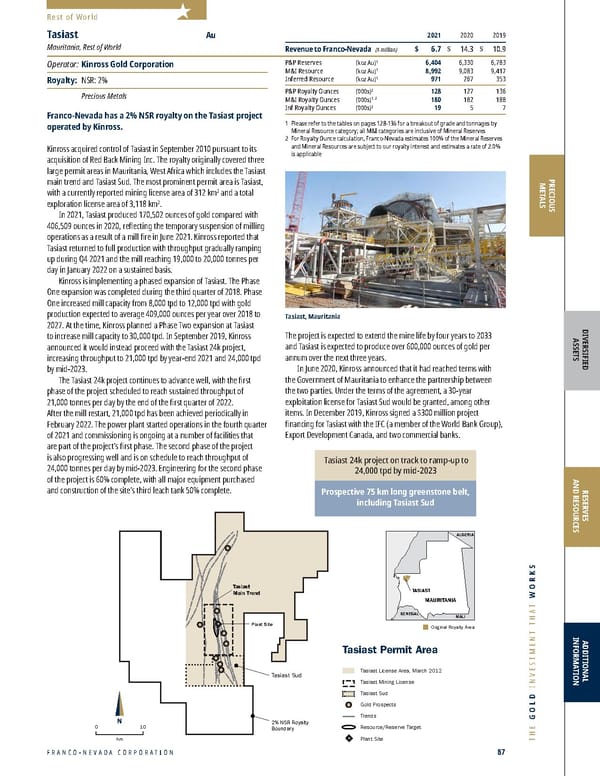
2022 ASSET HANDBOOK 88 FNV TSX NYSE N 2% NSR Royalty Area Awonsu Apensu Subika Plant and Offices Ntotoroso Amoma Kenyase Subika Project Area Note: not to scale Atlantic Ocean BURKINA FASO COTE D’IVOIRE GHANA TOGO BENIN NIGERIA NIGER MALI ALGERIA Subika PRECIOUS METALS 2021 2020 2019 Revenue to Franco-Nevada ($ million) $ 11.6 $ 10.4 $ 17.4 P&P Reserves (koz Au) 1 6,100 6,060 6,170 M&I Resource (koz Au) 1 9,350 9,010 9,190 Inferred Resource (koz Au) 1 1,730 1,220 1,620 P&P Royalty Ounces (000s) 2 82 82 82 M&I Royalty Ounces (000s) 1, 2 80 85 126 Inf Royalty Ounces (000s) 2 15 11 26 1 Please r efer to the tables on pages 128-136 for a breakout of grade and tonnages by Mineral Resource category; all M&I categories are inclusive of Mineral Reserves 2 For Ro yalty Ounce calculation, Franco-Nevada estimates 68% of Mineral Reserves (68% in 2020, 66% in 2019), 43% of the M&I Mineral Resources (47% in 2020, 69% in 2019) and 43% of the Inferred Resources (47% in 2020, 80% in 2019) are subject to our royalty interest and estimates an average rate of 2.0% is applicable Subika (Ahafo) Au Ghana, Rest of World Operator: Newmont Corporation Royalty: NSR: 2% Precious Metals Franco-Nevada has a 2% NSR royalty which covers a 78 km 2 area on the southern portion of Newmont’s Ahafo South mine in Ghana (shown in the schematic). The 2% NSR is payable on all ounces produced from the Rank (formerly Ntotroso) concession. The majority of the Subika deposit, the northern portion of the Awonsu deposit, and the southern tip of the Amoma deposit fall within the Rank mining lease boundary. Ne wmont completed the Subika Underground project in the fourth quarter of 2018 and announced commercial production at the Ahafo Mill Expansion in 2019, designed to improve production margins and accelerate stockpile processing. In 2021, Ahafo South pr oduced 481,000 ounces of gold compared with 480,000 ounces in 2020 and it is estimated that 68% of project reserves as of December 31, 2021 fall on Franco-Nevada’s royalty ground. Newmont reported a ramp-up of production at Subika following a change in mining method and expects an improvement in grades in 2022. Production from Ahafo is expected to increase to 650,000 ounces in 2022. In addition, Franco-Nevada expects a larger proportion of production to be sourced from ground covered by our royalty. Production is expected to increase through 2024, due to continued higher grade at the Subika open pit and increased underground tonnes mined due to the change in Newmont`s mining method at the Subika Underground. Ne wmont has announced a multi-year exploration plan to unlock the underexplored geological trends along 70 km of the Kenyasi thrust fault on which Ahafo South is located. At Ahafo South, Newmont has highlighted significant underground potential at Subika (on royalty ground) and the Apensu pit (not on royalty ground). In 2021, Newmont announced the approval of a new project in Ghana, Ahafo North, which is located 30 km to the north of the Ahafo South mine and not on royalty ground. Rest of World Production growth through 2024 Estimate 68% of project reserves fall on royalty ground Larger share of future production expected on royalty ground Subika (Ahafo), Ghana
FRANCO-NEVADA CORPORATION 89 THE GOLD INVESTMENT THAT WORKS PRECIOUS METALS DIVERSIFIED ASSETS RESERVES AND RESOURCES ADDITIONAL INFORMATION 2021 2020 2019 Revenue to Franco-Nevada ($ million) $ 9.9 $ 28.9 $ 20.2 P&P Reserves (koz Au) 1 158 293 764 M&I Resource (koz Au) 1 1,898 2,042 2,655 Inferred Resource (koz Au) 1 679 681 772 P&P Royalty Ounces (000s) 2 6 11 35 M&I Royalty Ounces (000s) 1,2 74 80 108 Inf Royalty Ounces (000s) 2 26 27 30 1 Please r efer to the tables on pages 128-136 for a breakout of grade and tonnages by Mineral Resource category; all M&I categories are inclusive of Mineral Reserves 2 100% of the Miner al Reserves & Mineral Resources at Karma are subject to a rate of 3.9% (6.5% gold stream which is factored by 80% to equate to a Royalty Ounce as well as Franco-Nevada’s 75% interest) Karma Au Burkina Faso, Rest of World Operator: Néré Mining SA Stream: 4.875% Gold Stream Precious Metals In August 2014, Franco-Nevada (Barbados) Corporation, a subsidiary of Franco-Nevada, and Sandstorm Gold Ltd. (“Sandstorm”) committed to provide up to $120 million in stream financing to assist the construction of the Karma Project in Burkina Faso, West Africa, in a syndicated stream transaction. Franco-Nevada committed 75% of the funding and Sandstorm committed the remaining 25%. Franco-Nevada ultimately contributed $78.75 million ($75 million with $3.75 million as part of the incr ease option). The Karma Project was constructed by True Gold Mining Inc. which was acquired by Endeavour in March 2016. In March 2022, Endeavour announced the sale of its 90% interest in Karma to Néré Mining SA (“Néré”). Under the str eam financing agreement, Endeavour delivered to Franco-Nevada 15,000 ounces of gold per year, beginning in March 2016 through to the end of February 2021, for a total of 75,000 ounces of gold delivered. The increase option was repaid in 8 quarterly deliveries totaling 5,625 ounces of gold by Q1 2019. Rest of World Prospective land package of 856 km 2 Trailing 4.875% gold stream in place N Kilometres 0 10 Karma Gold Stream Karma Project Area Area of Interest 5 km Current Exploitation Area Bonguirga Tougou Bogoya Youba Rounga Kao Nord Kao Sud Ouahigouya Burkina Faso North Kao Gold Zone Kao Pit Nami Pit Rambo Pit Goulagou I Pit Goulagou II Pit Nami Pit Kao Pit Namissiguima Ouest Atlantic Ocean BURKINA FASO COTE D’IVOIRE GHANA TOGO BENIN NIGERIA NIGER MALI ALGERIA Karma Sandstorm receives deliveries for its 25% interest directly. After February 2021, Endeavour and now, Néré, shall deliver to Franco-Nevada an amount of gold equal to 4.875% of the gold produced at Karma over the life of the mine in exchange for ongoing payments equal to 20% of the spot price of gold. The Karma Pr oject started production in 2016 and in 2021 produced 88,000 gold ounces. The stream agreement covers all of the concessions within the 856 km 2 Karma Project and also includes a defined area of interest of 5 km surrounding the borders of the project. In 2021, limited exploration work continued as part of an advanced grade control drilling program, targeting near mine extensions to be added into the current mine plan. The focus was on the Kao North area, Rambo, GG1, Anomaly B and Kanongo. Karma, Burkina Faso
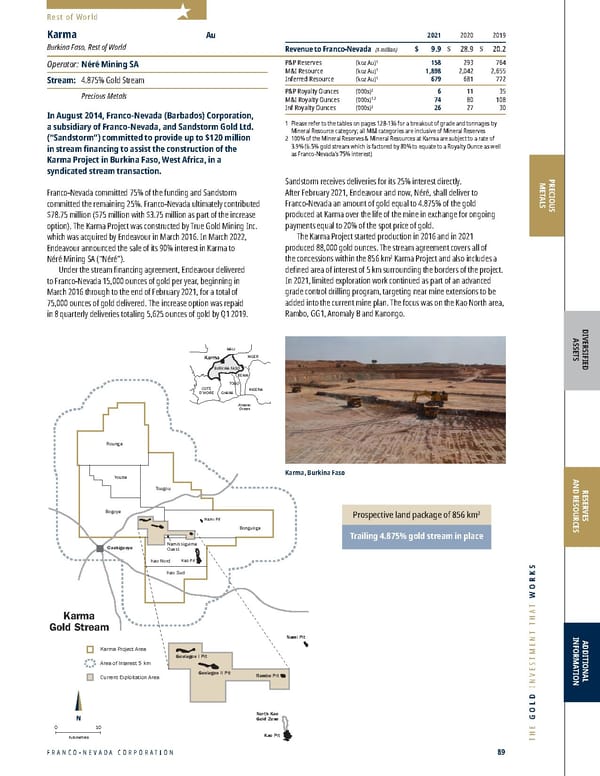
2022 ASSET HANDBOOK 90 FNV TSX NYSE PRECIOUS METALS 2021 2020 2019 Revenue to Franco-Nevada ($ million) $ 11.1 $ 9.6 $ 7.7 P&P Reserves (koz Au) 1 1,990 1,540 1,892 M&I Resource (koz Au) 1 3,950 4,160 4,373 Inferred Resource (koz Au) 1 610 500 749 P&P Royalty Ounces (000s) 2 37 29 35 M&I Royalty Ounces (000s) 1, 2 72 77 80 Inf Royalty Ounces (000s) 2 11 9 14 1 Please r efer to the tables on pages 128-136 for a breakout of grade and tonnages by Mineral Resource category; all M&I categories are inclusive of Mineral Reserves 2 For Ro yalty Ounce calculation, Franco-Nevada estimates 93% (93% in 2020, 93% in 2019) of Mineral Reserves and 91% of the Mineral Resources (92% in 2019, 91% in 2019) are subject to our royalty interest and estimates a rate of 2.0% is applicable Duketon Au Australia, Rest of World Operator: Regis Resources Ltd. Royalty: NSR: 2% Precious Metals Franco-Nevada has a 2% NSR royalty that covers 2,678 km 2 of the Duketon gold project in Western Australia. The project is operated by Regis Resources Ltd. (“Regis”) and includes ten operating mines and six other deposits at various stages of development. The royalty covers all known Mineral Reserves and Mineral Resources, except for the Gloster, Ben Hur and Anchor satellite deposits and portions of the Erlistoun, Dogbolter and Petra satellite deposits. Regis reported production of 330,480 ounces of gold for 2021 and provided production guidance of 300,000 to 340,000 ounces of gold for the fiscal year ending June 30, 2022. During 2021, approximately 90% of total Duketon production was subject to Franco-Nevada’s royalty and a similar portion is expected in 2022. Duketon South Operations (“DSO”): Regis reported DSO production of 258,229 ounces of gold for calendar year 2021. All of DSO production was subject to Franco-Nevada’s royalty in 2021. DSO has five operating mines at Garden Well, Rosemont, Erlistoun, Tooheys Well and Banyego. Franco-Nevada’s royalty covers all of DSO’s Mineral Reserves and Mineral Resources, except for Ben Hur and a small portion of Erlistoun. DSO production began in 2012 at Garden Well which has a 5 Mt per annum plant. Rosemont has a 2.5 Mt per annum plant and milled ore from Rosemont is piped 10 km in a slurry form for leaching at Garden Well. Ore from satellite deposits at Erlistoun, Tooheys Well and Banyego is hauled to Garden Well for processing. Gar den Well Underground development commenced in March 2021, with first production expected March 2022. In January 2022 heavy rains caused a pit wall failure and halted production at the Rosemont Main Pit, which had been due for completion in June 2022. Production at Rosemont Underground and Rosemont North Pit was not affected. Duketon North Operations (“DNO”): Regis reported DNO production of 72,251 ounces of gold for calendar year 2021. DNO has five operating mines at Moolart Well, Gloster, Dogbolter, Anchor and Petra. Moolart Well has been in production since 2010 and has a 2.5 Mt per annum plant. Moolart Well is covered by Franco-Nevada’s royalty, but has provided only a small portion of ore to the Moolart Well mill since 2016. The majority of ore processed through the Moolart Well plant since 2016 comes from four satellite deposits. Gloster and Anchor satellite deposits are not covered by Franco-Nevada’s royalty. Dogbolter and Petra satellite deposits are partially covered by Franco-Nevada’s royalty. Approximately 54% of DNO production was subject to Franco-Nevada’s royalty in 2021. Exploration: With an extensive land position and an active exploration program, Regis continues to add to the overall Mineral Reserves and Mineral Resources at Duketon. Significant exploration projects advanced in 2021 include resource extensions at Garden Well South and Rosemont Underground. Rest of World Garden Well Underground development commenced March 2021 with first production expected March 2022 Extensive land position and active exploration program Deposits Duketon Royalty Area 2% NSR Km 0 30 Location Map PERTH Port Hedland Kalgoorlie Norseman Kambalda Baneygo Erlistoun King John Garden Well Dogbolter Gloster Moolart Well Petra Rosemont Reichelts Find Current Royalty Tenements Original Royalty Tenements * Additional royalty lands to south not shown due to scale. N Russells Find Tooheys Well Duketon, Australia
FRANCO-NEVADA CORPORATION 91 THE GOLD INVESTMENT THAT WORKS N Edikan Gold Mine Royalty Area 1.5% NSR Km 0 10 Mining License and Royalty Area Exploration License Deposit Ayanfuri Mine Licenses Accra Edikan Gold Mine Mill Site Esuajah South Esuajah North Fetish Chirawewa Ataasi Mampon Abnabna Fobinso Dadieso GHANA PRECIOUS METALS DIVERSIFIED ASSETS RESERVES AND RESOURCES ADDITIONAL INFORMATION 2021 2020 2019 Revenue to Franco-Nevada ($ million) $ 3.9 $ 4.4 $ 3.6 P&P Reserves (koz Au) 1 1,318 1,477 1,608 M&I Resource (koz Au) 1 2,326 2,573 2,699 Inferred Resource (koz Au) 1 300 344 348 P&P Royalty Ounces (000s) 2 20 22 24 M&I Royalty Ounces (000s) 1, 2 35 39 40 Inf Royalty Ounces (000s) 2 5 5 5 1 Please r efer to the tables on pages 128-136 for a breakout of grade and tonnages by Mineral Resource category; all M&I categories are inclusive of Mineral Reserves 2 For Ro yalty Ounce calculation, Franco-Nevada estimates 100% of the Mineral Reserves and Mineral Resources are subject to our royalty interest and estimates a rate of 1.5% is applicable Edikan Au Ghana, Rest of World Operator: Perseus Mining Limited Royalty: NSR: 1.5% Precious Metals In 2011, Franco-Nevada acquired an effective 1.5% NSR royalty on Perseus Mining Limited’s (“Perseus”) Edikan gold mine in Ghana, centered on the Ashanti Gold Belt which includes two mining leases of approximately 93 km 2 . In June 2015, Perseus’ Supplementary Environmental Impact Statement was approved which was required for mining the Fetish, Chirawewa, Bokitsi (collectively referred to as the “Eastern Pits”) and Esuajah North gold deposits. An upgrade to the mill and relocation of housing was successfully completed by the end of 2016. The Esuajah South deposit was subsequently included in Edikan’s production profile and an updated life of mine plan based on revised reserves reported in February 2020 was prepared. Gold production was forecast to average Rest of World Exploration potential to further extend current mine life 212,000 ounces per annum over Edikan’s estimated mine life of 6.2 years from July 1, 2020, including gold production of approximately 231,000 ounces per annum on average over the first 4 years. 2021 pr oduction at Edikan was 150,330 ounces of gold compared with 158,090 ounces of gold in 2020. In February 2022, Perseus announced that production in Perseus’ 2022 fiscal year, based on December 2021 half year guidance, is expected to be between 142,284 to 157,284 gold ounces. Exploration opportunities are expected to further extend the current mine life at Edikan while focusing on new exploration targets within trucking distance. Perseus has recorded encouraging drilling results at the Nkosuo prospect 7 km from the Edikan mine (not covered by Franco-Nevada’s royalty) and expects to complete a maiden resource estimate for Nkosuo early in the June 2022 quarter. The Nkosuo discovery has the potential to extend Edikan’s mine life beyond 2026-2027, allowing for future near-mine discoveries which could potentially fall on royalty ground. Edikan, Ghana
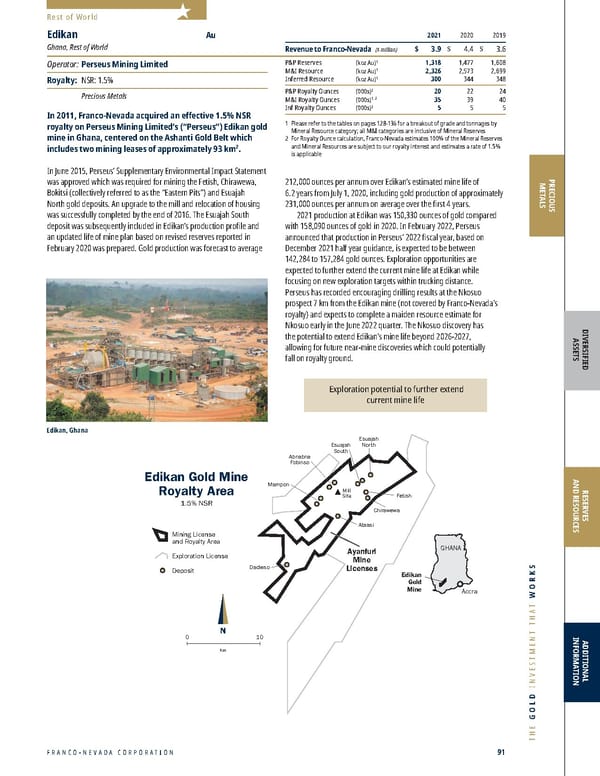
2022 ASSET HANDBOOK 92 FNV TSX NYSE PRECIOUS METALS Rest of World Franco-Nevada holds a 3.6% NSR royalty on all gold production from the Matilda/Wiluna Gold Project located in Western Australia, covering all of the 1,150 km 2 property. Wiluna was discovered in 1896 and has produced in excess of 4.0 million ounces of gold to date, with nearly continuous production from 1987 to 2013. Wiluna Mining Corporation Limited (“WMX”) acquired the Wiluna Gold Operation in 2014 and resumed mining operations in 2016. Wiluna has a 2.1 Mtpa CIL treatment plant and processes ore from several open-pit and underground deposits. Total production for 2021 was 40,879 ounces of gold. In December 2021, WMX commissioned a 750,000 tpa Sulphide Ore Concentrate Plant which was built at a cost of A$26 million. The first concentr ate shipment left site in February 2022. After full ramp-up in June 2022, production guidance is expected to be 90,000-100,000 ounces of gold in concentrate per year, plus another 20,000 ounces of gold doré per year. A feasibility study is expected in March 2022, to expand the Sulphide Ore Concentrate Plant and increase annual production in stages to 250,000 ounces of gold per annum. Franco-Nevada received $2.7 million of royalty revenue from Matilda/Wiluna in 2021. For Royalty Ounce calculation, Franco-Nevada estimates 100% of Mineral Reserves and Mineral Resources are subject to our royalty interest and estimates a rate of 3.6% is applicable Matilda (Wiluna) Au Australia, Rest of World Operator: Wiluna Mining Corporation Limited Royalty: NSR: 3.6% Precious Metals Northern Star Resources Limited (“Northern Star”) operates the South Kalgoorlie Operation (“SKO”) which has been producing gold since 1989. Northern Star acquired SKO from Westgold Resources Limited in 2018. SKO is located 15 km south of Kalgoorlie in Western Australia. Franco-Nevada holds a 1.75% NSR royalty for gold and a 1% NSR royalty for other minerals which covers 470 km 2 of the SKO tenements including the northern and central sections of the HBJ deposit and all of the Mt Marion, Pernatty and Mt Martin deposits, along with the 1.2 Mtpa Jubilee Mill. Northern Star combines SKO with the Kalgoorlie, Kundana, Carosue Dam and Kanowna Belle gold mines, and reported total production of 984,540 ounces of gold at the combined Kalgoorlie Production Centre for the year ended December 31, 2021. Northern Star also processes a significant portion of toll-treated ore at the Jubilee mill. Franco-Nevada estimates that the royalty production accounts for approximately 6% of total combined Kalgoorlie Production Centre production. Franco-Nevada received $1.8 million of royalty revenue from SKO in 2021. For Royalty Ounce calculation, Franco-Nevada estimates 82% of Mineral Reserves and 75% of Mineral Resources are subject to our royalty interest and estimates a rate of 1.75% is applicable. South Kalgoorlie Au Australia, Rest of World Operator: Northern Star Resources Limited Royalty: NSR: 1-1.75% Precious Metals Other Rest of World Assets Rest of World Precious Metals Please refer to the tables on pages 128-136 for a breakout of grade and tonnages by Mineral Resource category.
FRANCO-NEVADA CORPORATION 93 THE GOLD INVESTMENT THAT WORKS PRECIOUS METALS DIVERSIFIED ASSETS RESERVES AND RESOURCES ADDITIONAL INFORMATION Rest of World Other Rest of World Assets Rest of World Precious Metals Please refer to the tables on pages 128-136 for a breakout of grade and tonnages by Mineral Resource category. The Vivien gold mine is located in the Agnew-Leinster region of Western Australia. Franco-Nevada’s royalty interest covers 1.5 km 2 . Vivien was operated as a small open pit during 1997 and 1998. Ramelius Resources Limited (“Ramelius”) acquired the project in 2013 and commenced redevelopment of Vivien as an underground gold mine in Q2 2015, with first gold poured in Q1 2016. The 3% gross royalty applies to production after 25,000 ounces have been produced. This threshold was passed in November 2016. Vivien ore is trucked 300 km to Ramelius’ 1.7 Mtpa Checkers mill at Mt Magnet. Ramelius reported 2021 production from Vivien of 32,971 ounces of gold and Franco-Nevada received $2.1 million of royalty revenue from Vivien for the year. Franco-Nevada has not included Agnew (Vivien) in Royalty Ounce estimates Agnew (Vivien) Au Australia, Rest of World Operator: Ramelius Resources Limited Royalty: GR: 3.0% Precious Metals Franco-Nevada has a 2.5% NSR on the Kiziltepe gold-silver mine located in Turkey which started production in April 2017. Kiziltepe is operated by Zenit Madencilik, a JV owned by Özaltin Holding A.S. (53%), Ariana Resources PLC (“Ariana Resources”) (23.5%) and Proccea Construction Co. (23.5%). Kiziltepe produced 20,737 ounces of gold in 2021 compared with 18,645 ounces of gold in 2020. Production guidance for 2022 is expected to be approximately 25,000 ounces of gold. Open-pit mining during 2022 will continue primarily at the Arzu North and Derya pits, in addition to a push-back and development of Arzu South and further mining at Kepez. Ariana Resources has previously estimated average production of 20,000 ounces of gold equivalent per year over an 8-year mine life with potential to increase to at least 10 years including satellite deposits. Processing at Kiziltepe is achieved through carbon-in-leach and a processing plant expansion has been completed to provide for higher mill throughput of up to 500,000 tonnes of ore per annum. A further four-year mine life is expected at the enhanced processing rate, with additional upside for further discovery. In September 2021, Ariana Resources announced that an exploration and resource drilling campaign of approximately 14,000 m of diamond drilling was completed across the Kiziltepe Sector, with positive results received across various vein systems covered by Franco-Nevada’s royalty. For Royalty Ounce calculation, Franco-Nevada estimates 100% of the Mineral Reserves and Mineral Resources are subject to our royalty interest and estimates a rate of 2.5% is applicable Kiziltepe Au & Ag Turkey, Rest of World Operator: Zenit Madencilik Royalty: NSR: 2.5% Precious Metals Kiziltepe, Turkey
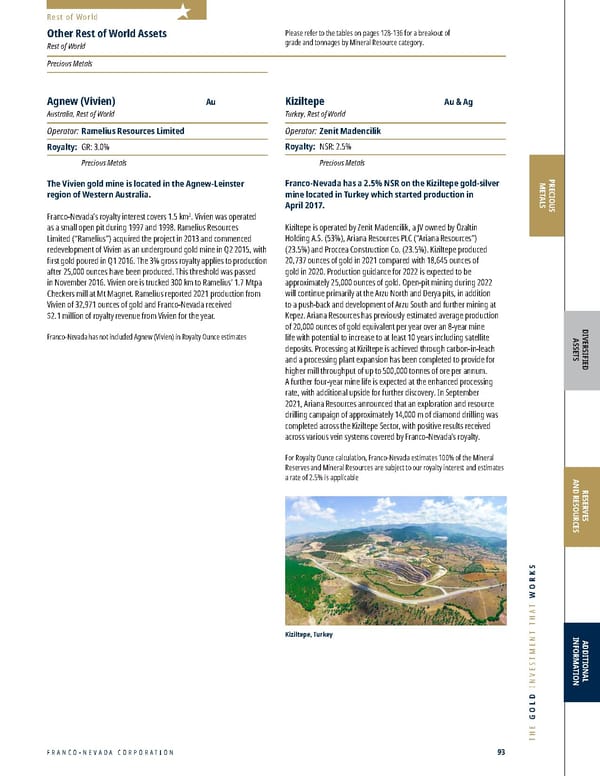
2022 ASSET HANDBOOK 94 FNV TSX NYSE PRECIOUS METALS Rest of World Other Rest of World Assets Rest of World Precious Metals Please refer to the tables on pages 128-136 for a breakout of grade and tonnages by Mineral Resource category. In 2013, Franco-Nevada acquired a 0.5% NSR on tenements that comprise the Sissingué gold project located in Côte d’Ivoire operated by Perseus. The project is comprised of the Sissingué Gold Mine (“SGM”) and the satellite deposits Fimbiasso and Bagoé. Franco-Nevada’s royalty covers SGM and Bagoé but does not cover the Fimbiasso claims. Perseus commenced commer cial gold production at the end of March 2018 and by June 2022 approximately 367,500 ounces of gold are forecast to have been produced at the mine. Perseus reported 2021 production from Sissingué of 82,895 ounces of gold and Franco-Nevada received $0.7 million of royalty revenue for the year. On Mar ch 28, 2022, Perseus announced that the mine life for Sissingué had been extended to March 2026 with estimated average annual production of 72,000 ounces. There is potential for further extension by processing low grade ore stockpiles. Ore will be sourced from the SGM, Bagoé and Fimbiasso deposits and a total of 252,000 ounces of gold are forecast to be recovered over the life of operation. Perseus also announced an updated Mineral Reserve and Mineral Resource as of December 31, 2021. Mineral Reserves of 282,000 gold ounces were reported (199,000 gold ounces, excluding Fimbiasso), with inclusive Measured and Indicated Resources of 379,000 ounces of gold (263,000 gold ounces, excluding Fimbiasso) and Inferred Resources of 15,000 gold ounces (8,000 gold ounces, excluding Fimbiasso). Perseus continues to explore the property to potentially increase the mine life. For Royalty Ounce calculation, FNV management estimates 100% of Mineral Reserves & Mineral Resources are subject to our royalty interest and estimates a rate of 0.5% is applicable Sissingué Au Côte d’Ivoire, Rest of World Operator: Perseus Mining Limited Royalty: NSR: 0.5% Precious Metals The Pandora property forms part of the Bushveld complex approximately 40 km east of the town of Rustenburg, South Africa and is 100% owned by Sibanye-Stillwater following its acquisition of Lonmin plc (“Lonmin”) in June 2019. Under Sibanye-Stillwater, Pandora is now grouped as part of its Marikana operations. Franco-Nevada has a 5% NPI royalty that includes a small minimum annual payment of South African rand 100,000. The underground mining operation exploits the UG2 reef horizon with access via a decline from surface. A deepening of the decline was completed in 2013, accessing the 9 and 10 levels. The majority of planned future mining is covered by Franco-Nevada’s 5% NPI royalty and Sibanye-Stillwater has listed Pandora as part of its portfolio of brownfields PGM projects that could extend mine life for the company in the Bushveld complex. Franco-Nevada has not received meaningful NPI payments in recent years. For Royalty Ounce calculation, Franco-Nevada estimates 80% of the Mineral Reserves and Mineral Resources are subject to our royalty interest and estimates a rate of 1.03% (1.04% in 2020, 0.7% in 2019) is applicable assuming an all in cost of $1,199/ounce ($1,212 in 2020, $1,100 for 2019). For 2019 thr ough 2021, Franco-Nevada has assumed a lower margin for the project than in previous years. PGM ounces are converted into Royalty Ounces assuming $1,000/ounce Pt and $2,100/ounce Pd ($1,100/ounce Pt and $2,200/ounce Pd in 2020, $1,050/ ounce Pt and $1,300/ounce Pd in 2019) Pandora PGM South Africa, Rest of World Operator: Sibanye-Stillwater Royalty: NPI: 5% Precious Metals
FRANCO-NEVADA CORPORATION 95 THE GOLD INVESTMENT THAT WORKS Aphrodite Gold project is located in Western Australia, 65 km northwest of Kalgoorlie. Franco-Nevada’s 2.5% gross royalty covers a 29 km 2 area and all Aphrodite Mineral Resources. An advance minimum royalty of A$250,000 per annum applies from November 1, 2017 onward. In December 2021, Bardoc Gold Limited (“Bardoc”) accepted an offer from St Barbara Limited (“St Barbara”) which valued Bardoc at A$157 million. The acquisition is scheduled for completion in April 2022. St Barbara intends to develop Aphrodite in conjunction with an expansion of the Laverton Processing Plant, located 180 km north by rail, increasing throughput from 1.4 Mtpa to 2.1 Mtpa and allowing treatment of Aphrodite’s refractory ore. The mill expansion is expected to increase production by approximately 90,000 ounces per annum, with an expected 80% of the incremental mill feed sourced from Aphrodite. A prefeasibility study on the expansion is expected in June 2022, followed by a feasibility study in December 2022 and commencement of construction of the Aphrodite underground mine in September 2023. For Royalty Ounce calculation, Franco-Nevada estimates 100% of Mineral Reserves and Mineral Resources are subject to our royalty interest and estimates a rate of 2.5% is applicable Aphrodite Au Australia, Rest of World Operator: Bardoc Gold Limited Royalty: GR: 2.5% Precious Metals Bronzewing is located in the Yandal Greenstone Belt of Western Australia. Franco-Nevada’s royalty covers 590 km 2 including all Mineral Resources identified. Bronzewing produced 2.19 million ounces of gold from several open-pit and underground deposits from 1994 to 2004 and a further 0.19 million ounces from open-pit deposits from 2010 to 2013. The project has changed ownership several times since 2013. Northern Star acquired the project in November 2019 in an A$193 million take-over deal. The Yandal project also includes the Julius deposit where Franco-Nevada has a 1.5% NSR royalty under a separate royalty agreement. During 2021, Northern Star developed Julius as a satellite deposit of the Jundee Gold Mine and Franco-Nevada received $0.07 million of royalty revenue from Julius for the year. Northern Star announced plans to return Bronzewing into production at a rate of 150,000 ounces of gold per year, using the Orelia Pit as the primary ore source, which is 100 km north of the Thunderbox Mill, where the ore will be processed. Allocated capital for the project is A$270 million; (i) A$180 million to double capacity at the Thunderbox Mill from 3.0 Mtpa to 6.0 Mtpa and (ii) A$90 million to develop the Orelia Pit. First production is scheduled for December 2022. For Royalty Ounce calculation, Franco-Nevada estimates 100% of Mineral Reserves and Mineral Resources are subject to our royalty interest and estimates a rate of 2.0% is applicable Yandal (Bronzewing) Au Australia, Rest of World Operator: Northern Star Resources Limited Royalty: NSR: 2% Precious Metals PRECIOUS METALS DIVERSIFIED ASSETS RESERVES AND RESOURCES ADDITIONAL INFORMATION Rest of World Other Rest of World Assets Rest of World Precious Metals Please refer to the tables on pages 128-136 for a breakout of grade and tonnages by Mineral Resource category.
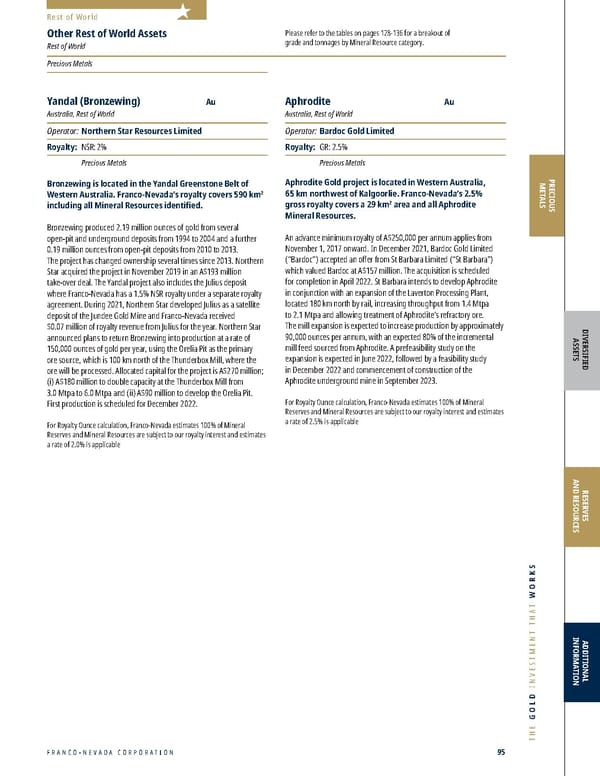
2022 ASSET HANDBOOK 96 FNV TSX NYSE Rest of World Other Rest of World Assets Rest of World Precious Metals Please refer to the tables on pages 128-136 for a breakout of grade and tonnages by Mineral Resource category. In March 2021, Franco-Nevada acquired a 1.2% NSR from Roxgold Inc. (“Roxgold”) on the license covering its Séguéla open-pit gold project located in Côte d’Ivoire. The royalty is subject to a buy-back of up to 50% for a period of time. In July 2021, Fortuna Silver Mines Inc. (“Fortuna”) and Roxgold completed a business combination, with the combined company continuing as Fortuna. Ro xgold completed a preliminary economic assessment in April 2020 and, in May 2021, released the results of a feasibility study that outline a 9-year open pit mine producing an average of 120,000 ounces of gold per year. In September 2021, Fortuna announced a positive construction decision for Séguéla, with first gold pour projected by mid-2023. Fortuna also indicated 130,000 ounces of gold production annually for the first six years of production. As of January 2022, the overall project is 32% complete. In March 2022, Fortuna announced a maiden Inferred Mineral Resource estimate for the Sunbird discovery. Fortuna estimates an Inferred Mineral Resource of 3.4 million tonnes at an average grade of 3.16 g/t gold containing 350,000 gold ounces. Fortuna plans to continue exploring the land package with an active exploration program and remains very encouraged at the potential for further exploration to help in determining the ultimate scale of the Séguéla project. For Royalty Ounce calculation, Franco-Nevada estimates 100% of Mineral Reserves and Mineral Resources are subject to our royalty interest and estimates a rate of 1.2% is applicable Séguéla Au Côte d’Ivoire, Rest of World Operator: Fortuna Silver Mines Inc. Royalty: NSR: 1.2% Precious Metals Franco-Nevada has a 2% NSR on the Perama Hill project currently held by Eldorado Gold Corporation (“Eldorado”). The Perama Hill gold project is located in the Thrace region of northeastern Greece and consists of two mining titles covering an area of 19 km 2 and two mining exploration licenses covering an area of 18 km 2 . Eldorado has been challenged in getting the needed approvals to advance its activities in Greece. Perama Hill has an estimated Mineral Reserve of 1,250,000 ounces (12.5 million tonnes grading 3.11 g/t), an increase from 975,000 ounces as at December 31, 2019, based on a revised and expanded open-pit design which will allow more of the known orebody to be mined. An updated Perama Hill technical study is expected in 2022. For Royalty Ounce calculation, Franco-Nevada estimates 100% of Mineral Reserves and Mineral Resources are subject to our royalty interest and estimates a rate of 2.0% is applicable Perama Hill Au Greece, Rest of World Operator: Eldorado Gold Corporation Royalty: NSR: 2% Precious Metals PRECIOUS METALS
FRANCO-NEVADA CORPORATION 97 THE GOLD INVESTMENT THAT WORKS PRECIOUS METALS DIVERSIFIED ASSETS RESERVES AND RESOURCES ADDITIONAL INFORMATION Franco-Nevada has interests in 223 exploration stage mining properties (141 precious metals assets and 82 diversified (mining) assets) as at April 8, 2022. Exploration assets represent interests on projects where technical feasibility and commercial viability of extracting a mineral resource are not demonstrable. Some of these assets have associated Mineral Resources that, to be economic, may require additional Mineral Resources, higher commodity prices, permitting approval, lower geopolitical risk or a better financing environment. A good portion of the properties are inactive and may not see activity again. Some of the properties are in proximity to producing or advanced projects. Franco-Nevada has not visited or audited its full list of exploration assets and has relied on operator reports and/or public disclosures to determine which properties are in good standing. It is possible some properties may have lapsed. The follo wing table is a list of the precious metals exploration assets of Franco-Nevada as at April 8, 2022. A list of the diversified (mining) exploration assets can be found on page 114. Assets that have had their terms or leases expire and have been written off are not listed. . Mining Exploration Assets MINING EXPLORATION ASSETS Precious Metals Mining Exploration Assets as at April 8, 2022 Asset Oper ator Inter est and % 1 PRECIOUS METALS South America Terra Escura , Brazil T alon Metals Corp. 1-2% NSR (All Metals) ; 4% Cash Dividends La Coipa , Chile Kinr oss Gold Corporation 3% NSR (Au) Volcan (Ojo de Agua), Chile Hochschild Mining plc 1.5% NSR (All Minerals) Ayahuanca , Peru Apumayo SA C 1% NSR (Au) Choreveco , Peru Miner a del Norte S.A./Aruntani S.A.C. 0.1-0.3% NSR (Au) Cristiana , Peru Fr esnillo Peru S.A.C. 1.5% NSR (All Metals) Los Pinos , Peru T amerlane Ventures Inc. 0.5% NSR (All Metals) Mansa Musa (Minasnioc), Peru Peruvian Metals Corp. 2% NSR (All Metals) Parinacochas (Urbaque), Peru Hochschild Mining plc 2% NSR (All Minerals) Pukaqaqa (Antoro Sur), Peru Ne xa Resources Peru S.A.A. 1-2% NSR (All Minerals) Yanamina , Peru W ealth Minerals Ltd. 5% NSR (All Minerals) Central America & Mexico Cerro San Pedro , Mexico Ne w Gold Inc. 1.95% NSR (Au, Ag) United States Cripple Creek , Colorado Sear chlight Exploration LLC 3% NSR (Au, Ag) La Plata Allard Stock , Colorado Metallic Miner als Corp. 1.5% NSR (All Minerals) Corbin Wickes , Montana Eastern Resour ces, Inc. (Elkhorn Goldfields LLC) 5% NSR (Au) Elkhorn , Montana Eastern Resour ces, Inc. (Elkhorn Goldfields LLC) 1.1875% NSR (Au) Lewis and Clark County , Montana Hartmut W . Baitis et al 1% NSR (All Minerals) Carlin (Currant Creek), Nevada Carlin Gold Corp. 3% NSR (All Minerals) Carlin (Railroad), Nevada Gold Standar d Ventures Corp. 1% NSR (All Minerals) Carlin (Willow Creek), Nevada Carlin Gold Corp. 1% NSR (All Minerals) Getchell , Nevada Barrick Gold Corpor ation 2% NSR (Au) Goldstrike (Rodeo Creek), Nevada Barrick Gold Corpor ation 4% NSR; capped at $500K (Au, Ag) Granite Creek (Getchell), Nevada i-80 Gold Corp. 2% NSR (Au) Limousine Butte , Nevada McEwen Mining Inc. 1.5-2.5% NSR (Au) Marigold (SAR), Nevada SSR Mining Inc. 5% NSR (Au) Marigold (Trout Creek/Valmy), Nevada Ne vada Gold Mines LLC/SSR Mining Inc. 3% NSR (Au) Mountain View , Nevada Millennial Pr ecious Metals Corp. 1% NSR (All Minerals) Nevada Mineral-Eureka County , Nevada Ne vada Gold Mines LLC 2% NSR (All Minerals) Pinson (unpatented), Nevada Ne vada Gold Mines LLC 1-2% NSR (Au) Preble , Nevada Barrick Gold Corpor ation 10% NP (Au) Preble (Pinson Fee), Nevada Barrick Gold Corpor ation 1.5-7.5% NSR (Au, Ag) Rain-Emigrant-Saddle , Nevada Ne vada Gold Mines LLC 1.5% NSR (All Minerals) Sandman , Nevada Ne wmont Corporation 0.5674% NSR on initial 200K o z (Au) Sleeper , Nevada Par amount Gold Nevada Corp. 2% NSR (All Minerals) Tonkin Springs , Nevada McEwen Mining Inc. 1-2% NSR (Au) Kings Canyon , Utah Pine Cliff Ener gy Ltd. (Geomark Exploration Ltd.) 4% NSR (Au) Silver Bell , Utah Unico, Inc. 5% NSR plus other (Au, Cu, Pb, Zn) Tecoma , Utah Fr onteer Development (USA) Inc. 5% NSR (All Minerals) Tintic , Utah Ke ystone Surveys 1% NSR (All Minerals)
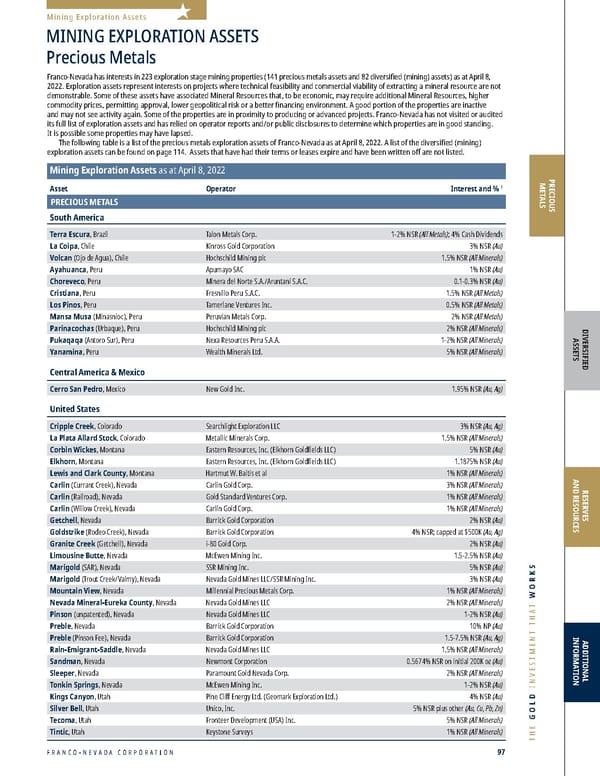
2022 ASSET HANDBOOK 98 FNV TSX NYSE PRECIOUS METALS Mining Exploration Assets Asset Oper ator Inter est and % 1 PRECIOUS METALS Canada Taken , British Columbia Independence Gold Corp. 2-4% NSR (All Minerals) (buy-back option to 1%) Tide , British Columbia 0945473 B .C. Ltd. 1.5% NSR (All Minerals) Maverick (Nokomis), Manitoba Minno va Corp. 2-3% NSR (All Minerals) Maverick (Puffy Lake), Manitoba Minno va Corp. 2-3% NSR (All Minerals) Oxford Lake , Manitoba Alto V entures Ltd. 1.5-2.5% NSR (All Minerals) Clarence Stream , New Brunswick Galway Metals Inc. 1% NSR (All Minerals) Clan Lake (Sito Lake), NWT Roland T . Trenaman 2% NSR (All Minerals) Hyde , Nunavut Explor atus Ltd. 2.5% NSR (All Minerals) Catharine 1 , Ontario Canadian Explor ation Services Limited 1/3 of a 2-3% NSR (All Minerals) Catharine 4 , Ontario Canadian Explor ation Services Limited/Northstar Gold Corp. 2-3% NSR (All Minerals) Detour (Gowest), Ontario Agnico Eagle Mines Limited 1% NSR (All Minerals) (buy-back option on 0.5%) Detour (Mikwam), Ontario & Quebec Aur elius Minerals Inc. 0.4824% NSR (All Minerals) Edwards , Ontario Alamos Gold Inc. (Richmont Mines Inc.) 2% NSR (All Minerals) Golden Highway (Aquarius), Ontario Agnico Eagle Mines Limited 1-2% NSR (All Minerals) Golden Highway (Central Timmins), Ontario Agnico Eagle Mines Limited 0-1% NSR (All Minerals) Golden Highway (Kerrs Leases), Ontario Canoe Mining V entures Corp. (Sheltered Oak Resources Corp.) 1-2% NSR (Au) Golden Highway (Stock), Ontario McEwen Mining Inc. 1% NSR (All Minerals) Golden Highway (Stoughton), Ontario Silver Lake Resour ces Limited 0.5-2.5% NSR (Au) Hemlo (JOA), Ontario Osisko Mining Inc. 0.5-1% NSR (Au) Kirkland Lake (Agnico 2% NSR), Ontario Agnico Eagle Mines Limited 2% NSR (Au) Kirkland Lake (Underlying 2% NSR A&D), Ontario Agnico Eagle Mines Limited 2% NSR (Au) Kirkland Lake (Underlying 3% NSR B), Ontario Agnico Eagle Mines Limited 2-3% NSR (Au) Larose , Ontario T ashota Resources Inc. 0.5% NSR (All Minerals) Marathon PGM (Sally Deposit), Ontario Gener ation Mining Limited 2% NSR (Pt, Pd) Musselwhite (North), Ontario Ne wmont Corporation 2% NSR (All Minerals) Red Lake (Madsen: Aiken-Russet claims), Ontario Pur e Gold Mining Inc. 1% NSR; capped at C$1M (All Minerals) Red Lake (Madsen: Newman-Heyson claims), Ontario Pur e Gold Mining Inc. 1.5-2% NSR (All Minerals) Red Lake (Newman-Todd), Ontario T rillium Gold Mines Inc. 1.5-2% NSR (Au) Red Lake (Skinner), Ontario Pr osper Gold Corp. 1% NSR (All Minerals) Shining Tree (Creso), Ontario Baselode Ener gy Corp. Option to acquir e 2% NSR (All Minerals) Shining Tree (Knight), Ontario Timothy A. Y oung 2-3% NSR (Au) Sudbury-Podolsky , Ontario K GHM International Ltd. Str eam 50% (PGM & Au) Timmins (Cripple Creek), Ontario Alamos Gold Inc. 0.3825-1.75% NSR (Au) Timmins (Project 81-ArcPacific Resources), Ontario Ar cPacific Resources Corp. 5% NSR (All Minerals) Timmins (Project 81-Kreative), Ontario Kr eative Ventures Limited 5% NSR (All Minerals) Timmins (Project 81-Noble), Ontario Noble Miner al Exploration Inc. 2% NSR (All Minerals) Timmins (Sewell), Ontario GFG Resour ces Inc. 1.5-2.5% NSR (Au) Timmins (West Porcupine), Ontario GFG Resour ces Inc. 2% NSR (All Minerals) Timmins (Whitney 1), Ontario John Pr ochnau 2.5% NSR (All Minerals) Timmins (Whitney 2), Ontario Ne wmont Corporation 2.5% NSR (All Minerals) Windarra (East Property), Ontario W esdome Gold Mines Ltd. 0.5% NSR (All Minerals) Barry , Quebec Bonterr a Resources Inc. 0.5% NSR (All Minerals) (buy-back option on 0.25%) Cadillac-Sphinx , Quebec Agnico Eagle Mines Limited 1.5% NSR (All Minerals) Casa Berardi (Caribou-Estrees), Quebec Y orbeau Resources Inc. 1.275-2.125% NSR (Au, Base Metals) Casa Berardi (Dieppe), Quebec Agnico Eagle Mines Limited 2-3% NSR (Au) Destiny (Rochebaucourt), Quebec Big Ridge Gold Corp./Clarity Gold-optionee 3% NSR (All Minerals) Eastmain , Quebec Benz Mining Corp. 1-1.15% NSR on initial 250K o z (Au) Fenelon , Quebec W allbridge Mining Company Limited 1% NSR (All Minerals) Galinee , Quebec Glencor e Canada Corporation 1.5-2% NSR (Au) Martiniere , Quebec W allbridge Mining Company Limited 2% NSR (All Minerals) Norlartic-Camflo , Quebec Canadian Malartic Corpor ation 25% NPI (All Minerals) N2 (Northway-Noyon), Quebec W allbridge Mining Company Limited 1% NSR (All Minerals) Radisson , Quebec Canadian Mining House 2% NSR (All Minerals) Wilson (Verneuil), Quebec Cartier Resour ces Inc. 0.5% NSR (All Minerals) Flume , Yukon Commander Resour ces Ltd. 2.5% NSR (All Minerals) (buy-back option to 1%) Hy , Yukon Lions Bay Mining Corp. 2% NSR (All Minerals) (buy-back option on 1%)
FRANCO-NEVADA CORPORATION 99 THE GOLD INVESTMENT THAT WORKS PRECIOUS METALS DIVERSIFIED ASSETS RESERVES AND RESOURCES ADDITIONAL INFORMATION Mining Exploration Assets Asset Oper ator Inter est and % 1 PRECIOUS METALS Australia Brown’s Creek , New South Wales Austr alian Native Landscapes/Hargraves Resources NL 2.25% NSR (All Minerals) Brown’s Creek (Blayney), New South Wales Regis Resour ces Limited 2.25% NSR (All Minerals) Brocks Creek (Zapopan), Northern Territory Agnico Eagle Mines Limited $20/o z (Au) Reynolds Range , Northern Territory Pr odigy Gold NL 1-2.5% NSR (Au) Rover , Northern Territory Castile Resour ces Limited 1.5-2.5% NSR (All Minerals) Tennant Creek , Northern Territory Emmerson Resour ces Limited 1.29% NSR (Au) Tennant Creek (Chariot), Northern Territory Emmerson Resour ces Limited A$17.10 or A$30/o z (Au) Tennant Creek-Evolution , Northern Territory Evolution Mining Limited 1.29% NSR (Au) Tennant Creek (Orlando), Northern Territory Evolution Mining Limited A$30/o z (Au) Mt Carlton , Queensland Evolution Mining Limited 2.75% GR (All Minerals) Mt Carlton (Crush Creek), Queensland Evolution Mining Limited 2.75% GR (All Minerals) Top Camp , Queensland Orion Metals Limited 0.5% GR (Au) /NPI (Other Minerals) Twin Hills , Queensland Jinan High- Tech Development Co., Ltd. 2.5% NSR (Au) Admiral Hill , W. Australia Focus Miner als Ltd. Pr oduction Payment (Au) Agnew , W. Australia Gold Fields Limited 2.5% GR (All Minerals) Agnew (Cox), W. Australia Gold Fields Limited 5% GR (Au) Agnew (Miranda Gold), W. Australia Gold Fields Limited 3% GR (Au) Bullabulling , W. Australia Zijin Mining Gr oup Co Ltd 1% GR (Au) Duketon (Southwest), W. Australia Regis Resour ces Limited 2% NSR (All Minerals) Duketon (West), W. Australia Regis Resour ces Limited/Duketon Mining Limited (Ni only) 2% NSR (All Minerals) Flushing Meadow , W. Australia Y andal Resources Limited 1% NSR (Au, Other Minerals) Glenburgh , W. Australia Gasco yne Resources Ltd 1.5% NPI (All Minerals) Granny Smith (Windich South), W. Australia Gold Fields Limited 1% NSR (All Minerals) Gum Creek (Gidgee/Wyooda Thangoo), W. Australia Horizon Gold Limited A$0.60/tonne (Au) Gum Creek (Sandstone II/Howards), W. Australia Horizon Gold Limited $0.35/dry tonne (All Minerals) Jeffreys Gold , W. Australia Mincor Resour ces NL 2% GP (Au) Kalgoorlie Super Pit (Western Lease), W. Australia Northern Star Resour ces Limited 2.5% GR (Au) Lake Maitland , W. Australia T oro Energy Limited (Uranium) /Mega Uranium Ltd (Au, Other Minerals) 1% NSR (All Minerals) Marvel Loch (May Queen), W. Australia Shandong Tianye Real Estate De velopment Group Co., Ltd. $0.50-1.00/cubic metr e (Au) Moyagee , W. Australia Musgr ave Minerals Ltd 1.575-2.1% NSR (All Minerals) Mungari (Carbine North/Chadwin’s Dam), W. Australia Evolution Mining Limited 3% NPI (All Minerals) Mungari (Lady Jane), W. Australia Evolution Mining Limited 4.5% GR (Au) Munni Munni , W. Australia Platina Resour ces Limited/Artemis Resources Limited One-time payment on pr oduction (Au and/or Pt) Murrin Murrin Gold , W. Australia Zeta Resour ces Limited 2.625% NSR (Au, Sulfides) Paddington (Breakaway Dam/12 Mile), W. Australia Zijin Mining Gr oup Co., Ltd. $1/ton (All Minerals) Paddington (Matt Dam), W. Australia Zijin Mining Gr oup Co., Ltd. A$0.60/tonne (Au) Polar Bear , W. Australia Kar ora Resources Inc. 2% NSR (All Minerals) Randwick Gold Hill , W. Australia E Bouverie, T rindal P/L, Lucas Gold P/L et al 1-1.5% GR (Au) Red October (Butcher Well), W. Australia AngloGold Ashanti Limited/Northern Star Resour ces Limited 1% NSR; 50K o z production threshold (Au) Red October (Butcher Well Area), W. Australia AngloGold Ashanti Limited/Northern Star Resour ces Limited 0.68-1% NSR (Au) Red October (Yundamindera), W. Australia Ne x Metals Explorations Ltd/Metalcity Limited-earning 51% 1% NSR (Au) South Kalgoorlie (St Ives), W. Australia Gold Fields Limited 1-1.75% NSR (Au, Ag, Other Minerals) Western Tamani (Coyote), W. Australia Northern Star Resour ces Limited $5-15/o z on production between 300K-1M oz (Au) Rest of W orld Maibulak deposit , Kazakhstan KAZ Miner als PLC $10.41/o z plus escalator (Au) Cooke 4 , South Africa Sibanye Gold Limited 7% Str eam (Au) Agi Dagi-Camyurt , Turkey Alamos Gold Inc. 2% NSR (Au) Hasandagi , Turkey Ko za Altin 2% NSR (Au) Karadag , Turkey Ko za Altin 2.5% NSR (Au) Torul , Turkey Ko za Altin 1.5% NSR (Au) 1 Ro yalty terms have been simplified for presentation purposes. Different terms may apply to certain portions of properties or by commodity. Some royalties may have sliding scales tied to commodity price. Others may include participation in sale pr oceeds of property or gross sales.
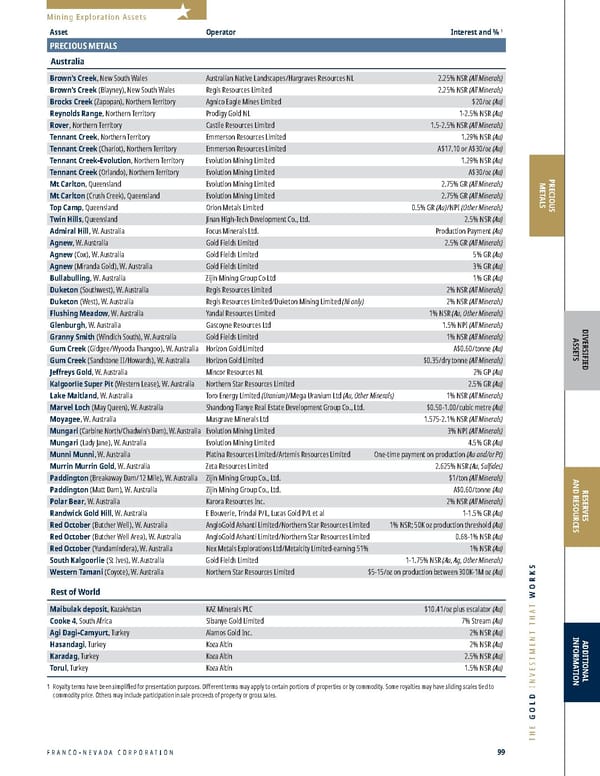
2022 ASSET HANDBOOK 100 FNV TSX NYSE PRECIOUS METALS Mining Exploration Assets
FRANCO-NEVADA CORPORATION 101 THE GOLD INVESTMENT THAT WORKS Diversified Assets 104 Iron Ore 107 Other Mining 114 Diversified Exploration Assets 116 Energy Assets 126 Energy Exploration Assets DIVERSIFIED ASSETS
2022 ASSET HANDBOOK 102 FNV TSX NYSE Mt Keith Flying Fox Australia Falcondo Midale Weyburn Edson SCOOP Midland Orion Delaware STACK Marcellus Taca Taca NuevaUnión (Relincho) Milpillas Haynesville Producing Advanced Producing (Energy) Vale N. System Vale S.E. System Sossego Robinson Rosemont/ Copper World Kivivic 2 Carol Lake EaglePicher Millmerran King Vol Bowen Basin South Kalgoorlie (Mt Marion Lithium) Producing Advanced DIVERSIFIED ASSETS Mt Keith Flying Fox Australia Falcondo Midale Weyburn Edson SCOOP Midland Orion Delaware STACK Marcellus Taca Taca NuevaUnión (Relincho) Milpillas Haynesville Producing Advanced Producing (Energy) Vale N. System Vale S.E. System Sossego Robinson Rosemont/ Copper World Kivivic 2 Carol Lake EaglePicher Millmerran King Vol Bowen Basin South Kalgoorlie (Mt Marion Lithium) Producing Advanced DIVERSIFIED ASSETS
FRANCO-NEVADA CORPORATION 103 THE GOLD INVESTMENT THAT WORKS DIVERSIFIED ASSETS RESERVES AND RESOURCES ADDITIONAL INFORMATION Iron Ore, Other Mining and Energy Diversified Iron Ore Vale (Iron Ore, Cu, Au & Other) 104 LIORC (Iron Ore) 106 Other Mining NuevaUnión (Relincho) (Cu, Au, Mo) 107 Taca Taca (Cu, Au, Mo) 108 Milpillas (Cu) 109 Falcondo (Ni) 109 Rosemont/Copper World (Cu, Mo, Ag, Au) 110 Robinson (Cu, Au) 111 EaglePicher (De) 111 Ring of Fire (Cr, Ni, Cu, PGM) 112 Mt Keith (Ni) 113 Flying Fox (Ni) 114 Diversified Exploration Assets 114 U.S. Energy Marcellus 118 Haynesville 119 SCOOP/STACK 120 Permian Basin 121 Canadian Energy Weyburn Unit 122 Orion 123 Energy Exploration Assets 126 DIVERSIFIED ASSETS Iron Ore, Other Mining and Energy Mt Keith Flying Fox Australia Falcondo Midale Weyburn Edson SCOOP Midland Orion Delaware STACK Marcellus Taca Taca NuevaUnión (Relincho) Milpillas Haynesville Producing Advanced Producing (Energy) Vale N. System Vale S.E. System Sossego Robinson Rosemont/ Copper World Kivivic 2 Carol Lake EaglePicher Millmerran King Vol Bowen Basin South Kalgoorlie (Mt Marion Lithium) Producing Advanced (top) Taca Taca, Argentina (bottom) Continental Resources drill rig, Oklahoma
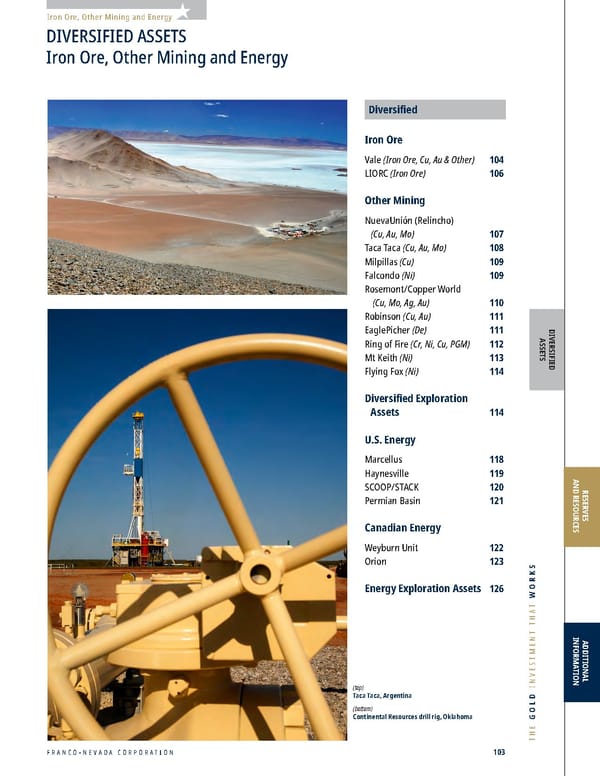
2022 ASSET HANDBOOK 104 FNV TSX NYSE DIVERSIFIED ASSETS Iron Ore Vale Iron Ore, Cu, Au & Other Brazil, South America Operator: Vale S.A. Royalty: 0.264% Iron Ore, 0.367% Copper/Gold, 0.147% Other 1 Diversified In April 2021, Franco-Nevada acquired 57 million Participating Debentures (“Royalty Debentures”) for $538 million, providing holders with effective net sales royalties on Vale S.A.’s (“Vale”) Northern and Southeastern Iron Ore Systems and on certain copper and gold operations in Brazil (together, the “Royalty”). The acquisition represents 14.7% of the total issued Royalty Debentures by Vale. The Royalty Debentures were issued in 1997 with the privatization of Vale to provide exposure to future resource growth from specified properties held at the time. Royalty payments are made on a semi-annual basis on March 31 st and September 30 th of each year reflecting production in the preceding half calendar year period. Vale's Northern System, Brazil 2021 2020 2019 Revenue to Franco-Nevada ($ million) $ 59.4 $ – $ – Vale (Northern & Southeastern System) P&P Reserves (kt Ir on Ore) 2 10,773,200 – – Sossego (Au) P&P Reserves (koz Au) 2 583 – – Sossego (Cu) P&P Reserves (Mlbs Cu) 2 1,495 – – P&P Royalty Ounces (000s) 3 1,141 – – 1 See Fr anco-Nevada AIF for the year ended December 31, 2021 and Vale website for Royalty Debenture details 2 Please r efer to the tables on pages 128-136 for a breakout of grade and tonnages. Vale S.A. Mineral Reserves have been prepared in accordance with SEC Industry Guide 7 and in accordance with those disclosure standards, mineral resources for the Northern and Southeastern Iron Ore Systems have not been publicly reported. Please see “Mineral Reserve and Resource Estimates” for further information on reporting under SEC Industry Guide 7 on page 151 3 For Ro yalty Ounce calculation, the Vale Royalty covers certain mining concessions in the Northern and Southeastern Systems reflecting the properties owned by Vale at privatization. At the Northern System, all of the Mineral Reserves are estimated to be covered by the Vale Royalty and at the Southeastern System, 60% of Mineral Reserves are estimated to be covered by the Vale Royalty. Historically, approximately 70% of Southeastern System production has been attributable to the Vale Royalty and is expected to remain at that level over the medium-term. The Mineral Reserves of the Southeastern System include non-approved projects that are not covered by the Vale Royalty (e.g., the Apolo project). In addition, Franco-Nevada accounts for moisture, mass recovery, and allowable deductions under the Vale Royalty, as described more fully on Vale's website. For the Royalty Ounce calculation associated with the Mineral Reserves of the Sossego mine, Franco-Nevada accounts for allowable deductions and mineral recovery. Refer to Vale’s 2020 20-F annual report for additional information Vale's Northern System, Brazil
FRANCO-NEVADA CORPORATION 105 THE GOLD INVESTMENT THAT WORKS DIVERSIFIED ASSETS RESERVES AND RESOURCES ADDITIONAL INFORMATION Iron Ore World class iron ore mines producing high quality iron ore for low emission steel Strong potential for growth and multi-decade mine lives Fully integrated production provides cost advantage Large land package of approximately 15,000 km 2 The Southeastern System located in the Ir on Quadrangle of Minas Gerais, Brazil is a key global producer of pellet feed and is a fully integrated complex with rail, maritime facilities and a port. Contributions to the Royalty will start once a cumulative sales threshold of 1.7 Bt of iron ore has been reached, expected by Vale during 2024-2025. The Royalty provides partial coverage of the three Southeastern System mining complexes. The primary complexes within the Royalty area are: Itabira, Minas Centrais (Brucutu mine), Mariana (Fazendao and, to a lesser extent, Capanema mines). We estimate attributable production capacity of 75-85 Mtpa from these complexes over the medium to long term (or approximately 70% of system capacity). Vale expects the Southeastern System to increase capacity to 93 Mt by end of 2022, increasing to 110-120 Mtpa long term. In 2022, Vale is starting up tailings filtration plants at Brucutu and Itabira. Sossego The Royalty also provides for a 2.5% (0.367% attributable) net sales royalty on certain copper and gold assets. The Royalty applies on a 50% basis (i.e. 1.25% of net sales, 0.183% attributable) to Sossego, reflecting Vale’s ownership at the time of issuance. Sossego is located in Carajas, Para state, Brazil and is an open pit operation with nominal capacity of approximately 93 kt per year of copper in concentrate. Sossego pr oduced 81.8 kt of copper in 2021. The Royalty further covers certain adjacent satellite deposits to Sossego which are being studied by Vale as replacement/life extensions for the operation. Other Additionally, the Royalty provides for a 1% (0.147% attributable) net sales royalty on all other minerals (covered mining rights include prospective deposits for other minerals including zinc, manganese, amongst others), subject to certain thresholds. A 1% rate (0.147% attributable) applies to net proceeds in the event of an underlying asset sale. In total, the Royalty covers approximately 15,000 km 2 of prospective geology. Vale's Southeastern System, Brazil Northern System The Royalty terms, on a 100% basis, provide for a 1.8% (0.264% attributable) net sales royalty on iron ore sales from the Northern System mines. The Northern System located in Car ajas, Para state, Brazil is a fully integrated operation inclusive of mines, railroad, maritime facilities and a port. The Northern System includes the Serra Sul (i.e. S11A-D), Serra Norte and Serra Leste mines and represents one of the largest mining complexes globally with long-life reserves and excellent potential for mine life extensions. The Northern System has been in operation since 1984 with the most recent development of the Serra Sul (S11D) mine in 2016. The current reserve complex life extends through the 2050s. The Northern System pr oduced 189 Mt of premium high-grade iron ore in 2021. Production capacity is expected by Vale to be 205 Mt by end of 2022 and to increase to 240-260 Mt long term through the approved expansion of Serra Sul and other growth projects. Southeastern System The Royalty terms, on a 100% basis, provide for a 1.8% (0.264% attributable) net sales royalty on iron ore sales from the portion of production covered by the Royalty in the Southeastern System.
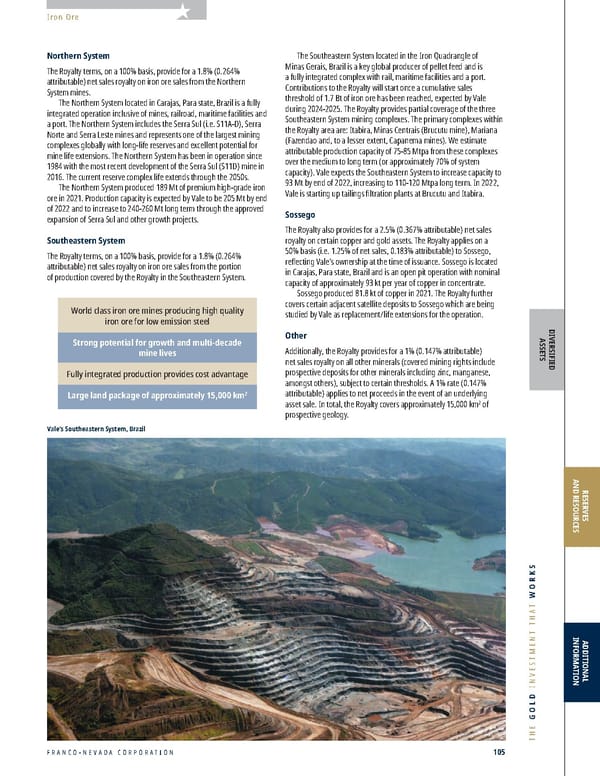
2022 ASSET HANDBOOK 106 FNV TSX NYSE DIVERSIFIED ASSETS LIORC Iron Ore Newfoundland & Labrador, Canada Operator: Rio Tinto plc Royalty: GORR 0.7% Iron Ore, IOC Equity 1.5% Diversified Franco-Nevada holds 6.3 million common shares (a 9.9% equity investment) in Labrador Iron Ore Royalty Corporation (“LIORC”). The position was acquired over a number of years for a total investment of C$93 million, representing an average cost of C$14.72/share. The investment in LIORC functions similar to a r oyalty given the flow through of revenue generated from LIORC’s underlying 7% gross overriding royalty interest (0.7% attributable), C$0.10 per tonne commission (C$0.01 per tonne attributable), and 15.1% equity inter est (1.5% attributable) in Iron Ore Company of Canada’s (“IOC”) Carol Lake mine, operated by Rio Tinto plc (“Rio Tinto”). LIORC normally pays cash dividends from net income derived from IOC to the maximum extent possible, while maintaining appropriate levels of working capital. IOC pr oduces high grade +65% Fe iron ore concentrate for sale and pellets with a reserve-only 23-year mine life and a large mineral resource supporting further extensions. IOC has nominal capacity of 23.3 Mtpa (combined concentrate and pellets) with 2021 attributable sales of 16.8 Mt and Rio Tinto has provided 2022 guidance of saleable production between 17.0 Mt and 18.7 Mt. IOC benefits from integrated infrastructure, including the mine, concentrator/pellet facilities, railway, and a port at Sept-Îles, Quebec. IOC has a long history as a supplier of high quality , low impurity, premium iron ore and pellets which has typically received premium prices from the European steel making industry. Producer of high-quality pellets and fines 23-year reserve life with large resource base to support extensions Fully integrated from mine to port, operated by Rio Tinto +50-year track record Iron Ore 2021 Revenue to Franco-Nevada ($ million) $ 30.2 P&P Reserves (Tonnes 000s) 1,144,000 M&I Resource (Tonnes 000s) 1,930,000 Inferred Resource (Tonnes 000s) 895,000 P&P Royalty Ounces (000s) 2 207 M&I Royalty Ounces (000s) 1, 2 349 Inf Royalty Ounces (000s) 2 162 1 Please r efer to the tables on pages 128-136 for a breakout of grade and tonnages by Mineral Resource category; all M&I categories are inclusive of Mineral Reserves 2 For Ro yalty Ounce calculation, calculation based on overriding royalty interest only and takes into account moisture, mass recovery, and allowable deductions. Refer to LIORC's annual report for additional information LIORC, Newfoundland & Labrador
FRANCO-NEVADA CORPORATION 107 THE GOLD INVESTMENT THAT WORKS Diversified Assets – Other Mining DIVERSIFIED ASSETS RESERVES AND RESOURCES ADDITIONAL INFORMATION 2021 2020 2019 Revenue to Franco-Nevada ($ million) $ – $ – $ – P&P Reserves (Mlbs Cu) 1 12,078 12,078 11,862 M&I Resource (Mlbs Cu) 1 16,068 16,068 15,852 Inferred Resource (Mlbs Cu) 1 5,752 5,752 5,752 P&P Royalty Ounces (000s) 2 250 258 270 M&I Royalty Ounces (000s) 1, 2 349 359 379 Inf Royalty Ounces (000s) 2 143 147 157 1 Please r efer to the tables on pages 128-136 for a breakout of grade and tonnages by Mineral Resource category; all M&I categories are inclusive of Mineral Reserves 2 For Ro yalty Ounce calculation, Franco-Nevada estimates 100% of the Mineral Reserves and Mineral Resources are subject to our royalty interest and estimates a rate of 1.275% (which factors a NSR smelting charge of 15%) and excludes the first four years of production from estimates. Copper has been converted to Royalty Ounces assuming $3.50 per pound ($3.50 per pound in 2020, $3.00 per pound in 2019) NuevaUnión (Relincho) Cu, Au, Mo Chile, South America Operator: Teck Resources Limited / Newmont Corporation Royalty: NSR: 1.5% Diversified Franco-Nevada has a 1.5% NSR royalty covering the Relincho property that is part of the NuevaUnión project being advanced by 50/50 joint venture partners, Teck Resources Limited (“Teck”) and Newmont Corporation (“Newmont”). The NuevaUnión project was formed in 2015 combining Teck’s Relincho project with Newmont’s La Fortuna (formerly El Morro) deposit, located approximately 40 km apart in the Atacama region of Chile. Franco-Nevada’s 1.5% NSR is subject to a maximum price of $6.00/lb copper and threshold price of $1.50/lb copper, inflation adjusted. No royalty is paid if the average price for the quarter is less than the threshold price and royalty payments commence four years after commercial production. Franco-Nevada acquired the royalty through its acquisition of Lumina Royalty Corp. in December 2011. Nue vaUnión is one of the largest undeveloped copper-gold- molybdenum projects in the Americas. A prefeasibility study was completed in the first quarter of 2018 which incorporated key design changes to improve project economics and respond to local community and ESG input versus the prior preliminary economic assessment. The prefeasibility study assumed an increased mine life from 32 to 36 years which did not include 205 million tonnes of Inferred Mineral Resources contained within the current pit designs. The thr ee-phase development approach assumed life of mine average production of 251,000 tonnes of copper equivalent production based on $10 per pound molybdenum and $1,300 per ounce gold. By combining the two projects, initial capital costs were reduced by achieving significant infrastructure synergy through the use of a single desalination plant, port, transmission line, concentrator and a common tailings facility. The Relincho and La Fortuna deposits will be bulk open-pit mining operations that will be developed in three production phases. Phase 1 (Years 1 - 3) sees mining and processing facilities at the Relincho site assuming processing of 104,000 tonnes per day (“tpd”). In Phase 2 (Years 4 - 18), mining activities transfer to the La Fortuna site utilizing an ore conveyance system to transport ore to the processing facilities at Relincho (116,000 tpd in Phase 2). Phase 3 (Years 19 - 36) sees mining activities transfer back to Relincho with an expansion to the processing facilities increasing processing to 208,000 tpd. T eck has disclosed that a feasibility study was completed in 2020 and is in the process of being optimized. While details have not been disclosed, the study considers a project with the potential to produce 254 ktpa CuEq with C1 cash costs of US$1.00-$1.10/lb Cu. N NuevaUnión (Relincho) Royalty Area 1.5% NSR Km 0 10 Mining and Royalty Area Pit Royalty Area Proposed Pit Proposed Mill N Arica Iquique Antofagasta La Serena Santiago Copiapo Relincho CHILE ARGENTINA BOLIVIA PERU Candelaria Marte-Lobo El Morro Pascua-Lama Cerro Casali Andacollo Regalito One of the largest undeveloped Cu-Au-Mo projects in the Americas Joint venture combines Relincho and La Fortuna to one project Project synergies estimated to significantly reduce capital expenditure NuevaUnión (Relincho), Chile

2022 ASSET HANDBOOK 108 FNV TSX NYSE Taca Taca Royalty Area 1.08% NSR N Arica Iquique Antofagasta La Serena Santiago Copiapo NuevaUnión (Relincho) CHILE ARGENTINA BOLIVIA PERU Vizcachitas San Jorge Taca Taca Km 0 5 Pit Royalty Area First Quantum 2020 Technical Report Ultimate Pit Design DIVERSIFIED ASSETS Taca Taca Cu, Au, Mo Argentina, South America Operator: First Quantum Minerals Ltd. Royalty: NSR: 1.08% Diversified Franco-Nevada has a 1.08% NSR royalty on all copper, gold and molybdenum produced from Taca Taca which was acquired through the acquisition of Lumina Royalty Corp. in December 2011. The property hosts a very large copper-gold-molybdenum porphyry system and is located in the Puna region of northwestern Argentina in Salta Province, 230 km west of the provincial capital of Salta. The royalty is subject to a buy-back provision. In No vember 2020, First Quantum filed an updated NI 43-101 technical report and declared a maiden Mineral Reserve of over 7.7 million tonnes of contained copper. First Quantum’s technical report considers an open-pit mine plan which contemplates processing throughput of up to 60 million tonnes per annum through a conventional flotation circuit with a mine life of approximately 32 years. The Measured and Indicated Mineral Resource is 2,203 million tonnes, grading 0.43% copper, and contains 9,451,000 tonnes of contained copper, 265,000 tonnes of molybdenum and 6,052,000 ounces of gold. The Proven and Probable Mineral Reserve has been estimated at 1,759 million tonnes, grading 0.44% copper, for 7,735,000 tonnes of contained copper, 214,000 tonnes of molybdenum and 5,087,000 ounces of gold. First Quantum is continuing with pr e-development work and feasibility study activities for the project. The primary Environmental and Social Impact Assessment (“ESIA”) for the project, which covers the principal proposed project sites, was submitted in 2019 and assessment by the authorities continues. Separate ESIA’s for project support infrastructure were submitted to the relevant authorities during Q2 2021. First Quantum is seeking an improved fiscal environment before making a decision to proceed with the project, which is not expected before 2023/2024. Large porphyry deposit with reserve of over 7.7 million tonnes of contained copper and 5.1 million ounces of gold Potentially First Quantum’s next development project Feasibility study and permitting work underway Diversified Assets – Other Mining 2021 2020 2019 Revenue to Franco-Nevada ($ million) $ – $ – $ – P&P Reserves (Mlbs Cu) 1 17,052 17,052 – M&I Resource (Mlbs Cu) 1 20,835 20,835 21,150 Inferred Resource (Mlbs Cu) 1 4,863 4,863 7,550 P&P Royalty Ounces (000s) 2 359 368 – M&I Royalty Ounces (000s) 1, 2 437 448 476 Inf Royalty Ounces (000s) 2 100 102 165 1 Please r efer to the tables on pages 128-136 for a breakout of grade and tonnages by Mineral Resource category; all M&I categories are inclusive of Mineral Reserves 2 For Ro yalty Ounce calculation, Franco-Nevada estimates 100% of the Mineral Reserves and Mineral Resources are subject to our royalty interest and estimates a rate of 0.918% is applicable for the copper Royalty Ounces (which factors in a NSR smelting charge of 15%). Copper has been converted to Royalty Ounces assuming $3.50 per pound ($350 per pound in 2020, $3.00 per pound in 2018) Taca Taca, Argentina
FRANCO-NEVADA CORPORATION 109 THE GOLD INVESTMENT THAT WORKS DIVERSIFIED ASSETS RESERVES AND RESOURCES ADDITIONAL INFORMATION Diversified Assets – Other Mining Other Central America & Mexico Assets Central America & Mexico Diversified Please refer to the tables on pages 128-136 for a breakout of grade and tonnages by Mineral Resource category. Franco-Nevada has a production payment royalty on the Milpillas copper mine in Sonora, Mexico operated by Industrias Peñoles, S.A.B. de C.V. (“Peñoles”). The royalty is based on $0.04/lb of copper produced, if the price of copper is above $1.20/lb, and covers an estimated 30 km 2 . The project is an underground copper mine and heap leach operation and was acquired by Franco-Nevada in September 2020 as part of a portfolio of 24 royalties from Freeport-McMoRan Inc. Milpillas paused active mining in mid-2020 and transitioned to residual leaching. Minimal production from Milpillas is expected in the near term; however, potential exists for the operation to restart active mining in the future. Franco-Nevada has not included Milpillas in Royalty Ounce estimates Milpillas Cu Mexico, Central America & Mexico Operator: Industrias Peñoles, S.A.B. de C.V. Royalty: Production Payment Diversified Franco-Nevada has a 4.1% equity interest in Falconbridge Dominicana, C. por A. (“Falcondo”) that is economically similar to a profit royalty except that payments are received through discretionary dividend distributions. Falcondo is a ferronickel surface mining operation with production capacity of 29,000 tonnes of contained nickel per annum located in the Dominican Republic with operations dating back to 1971. Falcondo is typically a swing producer and was put on care and maintenance when nickel prices fell in October 2013. In 2015, Glencore sold its 85.26% ownership in the operation to Americano Nickel Limited, a private equity company which has subsequently restarted the mine. Franco-Nevada has not received any dividends in recent years. For Royalty Ounce calculation, Franco-Nevada estimates 100% of the Mineral Reserves and Mineral Resources are subject to our equity interest and estimates a margin of 20% is applicable. Nickel has been converted to Royalty Ounces assuming $9.00 per pound ($7.00 in 2020, $7.25 per pound in 2019) Falcondo Ni Dominican Republic, Central America & Mexico Operator: Americano Nickel Limited Royalty: 4.1% Dividend Diversified Falcondo, Dominican Republic
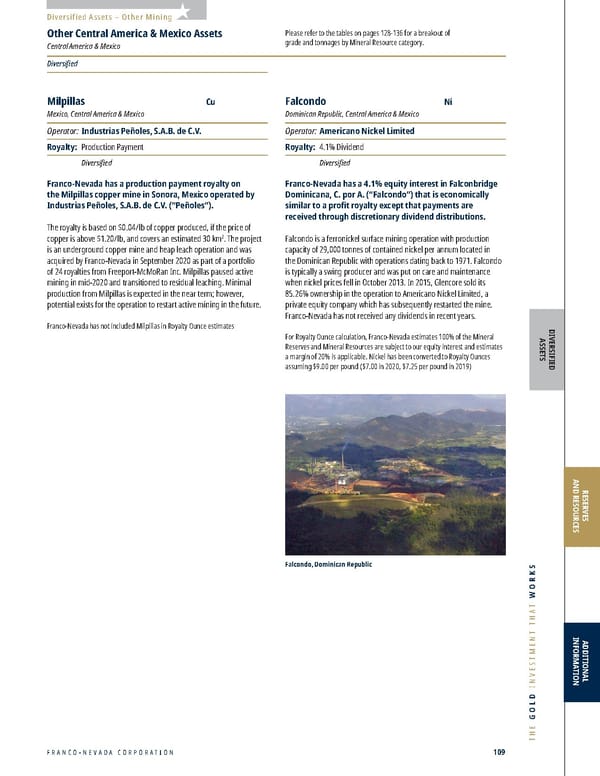
2022 ASSET HANDBOOK 110 FNV TSX NYSE 2021 2020 2019 Revenue to Franco-Nevada ($ million) $ – $ – $ – P&P Reserves (Mlbs Cu) 1, 3 5,328 5,328 5,328 M&I Resource (Mlbs Cu) 1, 3 10,915 8,757 8,757 Inferred Resource (Mlbs Cu) 1, 3 1,539 412 412 P&P Royalty Ounces (000s) 2, 3 181 136 171 M&I Royalty Ounces (000s) 1, 2, 3 372 223 281 Inf Royalty Ounces (000s) 2, 3 52 11 13 1 Please r efer to the tables on pages 128-136 for a breakout of grade and tonnages by Mineral Resource category; all M&I categories are inclusive of Mineral Reserves 2 For Ro yalty Ounce calculation, Franco-Nevada estimates 99% (100% in 2020, 100% in 2019) of the Mineral Reserves and Mineral Resources are subject to our royalty interest and estimate a rate of 1.772% in 2021 (1.275% in 2020, 1.275% in 2019) (which factors a NSR smelting charge of 15%). Copper has been converted to Royalty Ounces assuming $3.50 per pound ($3.50 in 2020, $3.00 per pound in 2019) 3 Does not include silver or molybdenum Miner al Reserve and Mineral Resource estimates Rosemont/Copper World Cu, Mo, Ag, Au Arizona, United States Operator: Hudbay Minerals Inc. Royalty: NSR: 2.085% Diversified Franco-Nevada has a 2.085% NSR royalty covering all metals, including copper, molybdenum, silver and gold extracted from the majority of claims covering the Rosemont project and Copper World deposits in Pima County, approximately 30 miles southeast of Tucson, Arizona. Hudbay Minerals Inc. (“Hudbay”) is the operator of the asset following its acquisition of Augusta Resource Corporation. The broader Rosemont property contains the Rosemont deposit along with seven other mineral deposits over a 7 km strike area, known as Copper World. The property is situated near a number of large porphyry style producing copper mines. In No vember 2021, Franco-Nevada acquired an existing 0.585% NSR royalty interest on the Rosemont copper project from certain private sellers. The royalty has identical terms as an existing 1.5% NSR royalty that Franco-Nevada held and covers the same land package, including most of the Copper World deposits. Hudbay r eceived the Final Record of Decision (“FROD”) for the Rosemont project in June 2017 and, in March 2019, received the Section 404 Water Permit from the U.S. Army Corps of Engineers. In July 2019, the U.S. District Court for Arizona issued a ruling that vacated the FROD issued by the U.S. Forest Service. As a result, the construction of Rosemont was suspended. Hudbay has appealed the ruling and is awaiting a decision from the U.S. Court of Appeals for the Ninth Circuit. As Hudbay e valuates next steps for the Rosemont project, the company continues to advance the Copper World deposits (including Bolsa, Broad Top Butte, Copper World, Peach, Elgin, South Limb and North Limb) which are largely on private land covered by Franco-Nevada’s royalty. In December 2021, Hudbay announced an initial mineral resource estimate at its Copper World project, Franco-Nevada’s royalty covers all metals, including copper, molybdenum, silver and gold Exploration and development studies focused on Copper World targets on private land In production, the Rosemont project will be one of the largest copper mines in the United States of 272 million tonnes at 0.36% copper of Indicated Mineral Resources and 142 million tonnes at 0.36% copper of Inferred Mineral Resources. The resources are comprised of both oxide and sulphide mineralogy and are potentially amenable to heap leach and flotation processing, respectively. A preliminary economic assessment is underway contemplating the development of the Copper World deposits in conjunction with the Rosemont deposit. Results are expected in the first half of 2022, followed by additional drilling and the commencement of a prefeasibility study. DIVERSIFIED ASSETS Diversified Assets – Other Mining Rosemont/Copper World, Arizona
FRANCO-NEVADA CORPORATION 111 THE GOLD INVESTMENT THAT WORKS DIVERSIFIED ASSETS RESERVES AND RESOURCES ADDITIONAL INFORMATION Diversified Assets – Other Mining Other United States Assets United States Diversified Please refer to the tables on pages 128-136 for a breakout of grade and tonnages by Mineral Resource category. The Robinson open-pit mining complex, operated by KGHM, produces copper, gold and molybdenum and is located near Ely, Nevada. Franco-Nevada has three royalties covering the Robinson mine: 1) a 0.225% NSR on all base metal and associated precious metal production; 2) a 10% NSR on 51% of the gold production from the property in excess of 60,000 ounces of gold per year; and 3) under a copper agreement, a price participation royalty on 51% of 40% of each pound of copper production from the property in excess of 130 million pounds of copper produced per annum, multiplied by the spot price, less $1.00 per pound adjusted for inflation (based on 1990 dollars). Amounts are only payable in any year in which the average price of copper during that year exceeds a $1 per pound threshold, as adjusted for inflation (based on 1990 dollars). Copper production for the first nine months of 2021 was approximately 93 million pounds, up 21% from the same period in 2020, while gold production for the first nine months of 2021 was 29,200 ounces. Franco-Nevada will likely only be paid on the base 0.225% NSR royalty for 2022 as production is expected to be below the royalty threshold level. For Royalty Ounce calculation, Franco-Nevada estimates 100% of the gold and copper Mineral Reserves and Mineral Resources are subject to our royalty interest and estimates an average rate of 0.225% is applicable for gold and 0.1913% for copper (which factors a NSR smelting charge of 15%). Copper has been converted to Royalty Ounces assuming $3.50 per pound ($3.50 in 2020, $3.00 per pound in 2019) Robinson Cu, Au Nevada, United States Operator: KGHM International Ltd. Royalty: NSR: 0.225% / other Diversified EaglePicher is a diatomaceous earth operation in Pershing County, Nevada, located about 23 miles northwest of Lovelock. The royalty is based on a fixed payment per ton which fluctuates based on the average sales price from the prior year’s sales. The royalty covers approximately 15 km 2 of checkerboard lands. The intervening lands are public and EaglePicher holds unpatented placer claims on those lands as needed for mining. The mine has been in continuous operation since the 1950s with approximately 65% of production coming from Franco-Nevada land. The revenue received from EaglePicher in 2020 and 2021 was $296,000 and $393,000, respectively. Franco-Nevada has not included EaglePicher in Royalty Ounce estimates EaglePicher De Nevada, United States Operator: EP Minerals, LLC Royalty: Production Payment Diversified KGHM Robinson, Nevada
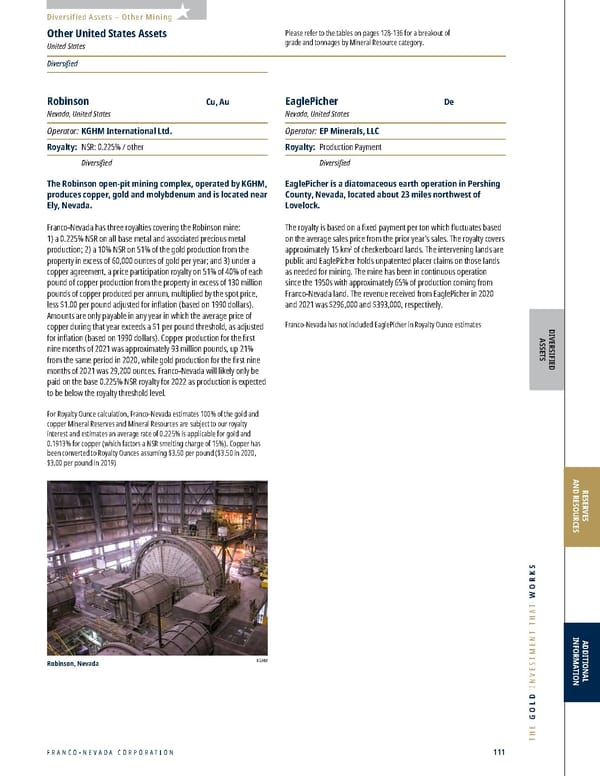
2022 ASSET HANDBOOK 112 FNV TSX NYSE DIVERSIFIED ASSETS Diversified Assets – Other Mining Ring of Fire Cr, Ni, Cu, PGM Ontario, Canada Operator: Wyloo Metals Pty Ltd. Royalty: NSR/GR: 1-3% Diversified In April 2015, Franco-Nevada acquired royalty rights in the Ring of Fire mining district of Ontario by providing a loan and royalty financing to Noront Resources Ltd. (“Noront”). The financing package enabled Noront to acquire the mining claims held by subsidiaries of Cliffs Natural Resources Inc. (“Cliffs”) in the Ring of Fire mining district, located 500 km northeast of Thunder Bay. The royalty rights provide Franco-Nevada with a long-term interest in a potential new mining camp with exposure to one of the largest chromite resources globally, in addition to a nickel, copper and PGM deposit. The total royalty concession is estimated to cover over 1,000 km 2 . As part of the April 2015 financing package, Fr anco-Nevada provided Noront with a $25 million loan for a period of five years at a 7% interest rate. Franco-Nevada paid an additional $3.5 million in cash as part of the granting of royalties over the existing Noront property. Franco-Nevada received a 3% royalty over the Black Thor chromite deposit, a 2% royalty over all of Noront’s property in the region (excluding the Eagle’s Nest deposit, see below), 2% on certain other properties previously being advanced by Cliffs, and a number of other third-party exploration royalties. In December 2019, Fr anco-Nevada acquired a 1% gross royalty on Noront’s Eagle’s Nest nickel, copper and PGM deposit, for $3.8 million. Eagle’s Nest currently has over 20 million tonnes of Measured, Indicated and Inferred Mineral Resources containing high-grade nickel mineralization with significant copper, palladium and platinum content. Franco-Nevada also extended the term of its $25 million loan to September 30, 2022, from its original maturity of April 28, 2020, under substantially the same terms and conditions. During the course of 2021, Nor ont was the subject of competing take-over efforts by Wyloo Metals and BHP for control of the Ring of Fire. In December 2021, Nor ont and Wyloo Metals, a private company, entered into a binding agreement for the acquisition of Noront for C$1.10 per share. and the acquisition was completed in April 2022. Andrew Forrest, founder of Fortescue Metals Group, is the principal investor in Wyloo Metals. The loan, which is repayable upon a change of control at Franco-Nevada’s discretion, had a balance of $39.7 million at December 31, 2021. Royalty concession estimated to cover over 1,000 km 2 Wyloo Metals as new operator 2021 2020 2019 Revenue to Franco-Nevada ($ million) $ – $ – $ – Ring of Fire (Cr) P&P Reserves (Tonnes 000s) 1 – – – M&I Resource (Tonnes 000s) 1 192,760 192,760 192,800 Inferred Resource (Tonnes 000s) 1 54,580 54,580 54,600 Eagle's Nest (PGM) P&P Reserves (koz PGM) 1 1,489 1,489 1,489 M&I Resource (koz PGM) 1 1,627 1,627 1,627 Inferred Resource (koz PGM) 1 1,459 1,459 1,489 Eagle's Nest (Ni) P&P Reserves (Mlbs Ni) 1 413 413 413 M&I Resource (Mlbs Ni) 1 432 432 432 Inferred Resource (Mlbs Ni) 1 228 228 228 P&P Royalty Ounces (000s) 2 23 22 21 M&I Royalty Ounces (000s) 1,2 227 233 284 Inf Royalty Ounces (000s) 2 77 78 91 1 Please r efer to the tables on pages 128-136 for a breakout of grade and tonnages by Mineral Resource category; all M&I categories are inclusive of Mineral Reserves 2 For the Ring of Fir e Royalty Ounce calculation, Franco-Nevada estimates 100% of the Mineral Resources are subject to our royalty interest and estimates a dollar per tonne value of $1.90/tonne. For the Eagle’s Nest Royalty Ounce calculation, FNV management estimates 100% of the PGM and nickel Mineral Reserves and Mineral Resources are subject to our royalty interest and estimates an average rate of 1.0% is applicable for PGM and 0.7% for nickel (which factors a NSR smelting charge of 30%). PGM ounces are converted into Royalty Ounces assuming $1,000/ounce Pt and $2,100/ounce Pd and nickel has been converted to Royalty Ounces assuming $9.00 per pound. Copper Mineral Reserves and Mineral Resources are not included in the Royalty Ounce calculation Ring of Fire, Ontario
FRANCO-NEVADA CORPORATION 113 THE GOLD INVESTMENT THAT WORKS DIVERSIFIED ASSETS RESERVES AND RESOURCES ADDITIONAL INFORMATION Diversified Assets – Other Mining 2021 2020 2019 Revenue to Franco-Nevada ($ million) $ 2.3 $ 1.2 $ 1.7 P&P Reserves (Mlbs Ni) 1 1,087 1,135 1,187 M&I Resource (Mlbs Ni) 1 2,390 2,442 2,452 Inferred Resource (Mlbs Ni) 1 275 275 275 P&P Royalty Ounces (000s) 2 19 16 22 M&I Royalty Ounces (000s) 1, 2 42 34 44 Inf Royalty Ounces (000s) 2 5 4 5 1 Please r efer to the tables on pages 128-136 for a breakout of grade and tonnages by Mineral Resource category; all M&I categories are inclusive of Mineral Reserves 2 For Ro yalty Ounce calculation, Franco-Nevada estimates 100% of the Mineral Reserves and Mineral Resources are subject to our royalty interest and estimates a rate of 0.50% is applicable. Franco-Nevada has also applied a NSR smelting charge of 30%. Nickel has been converted to Royalty Ounces assuming $9.00 per pound ($7.00 per pound in 2020, $7.25 per pound in 2019) Mt Keith Ni Australia, Rest of World Operator: BHP Billiton Limited Royalty: NPI: 0.25% / GR: 0.375% Diversified Franco-Nevada has a 0.375% gross royalty and a 0.25% NPI royalty on lands including the Mt Keith nickel operation in Western Australia, located 460 km north of Kalgoorlie. BHP Billiton Limited (“BHP Billiton”) is the operator and the project is a large, low-grade disseminated nickel sulphide ore body with an open-pit mine. Franco-Nevada’s royalties cover 236 km 2 and includes the Jericho Nickel Deposit located approximately 25 km northwest of Mt Keith, and covers part of the Yakabindie Deposits located approximately 25 km south of Mt Keith. Mining commenced in 1993 with the first nickel concentr ate produced in 1994. In June 2021, BHP Billiton reported that Mt Keith had an estimated mine life of 15 years. Mt Keith concentr ator ore throughput is approximately 11.5 Mtpa with 64% recoveries. Production capacity is 35,000-40,000 tonnes per annum of nickel in concentrate. Mt Keith is part of Nickel West, BHP Billiton’s integrated business unit for Australian nickel assets, along with four other mines, a concentrator, a smelter and a refinery. BHP Billiton reported that Mt Keith total production for 2021 was 27,943 tonnes of nickel. During 2019, BHP Billiton developed the Goliath and Six Mile Well Nickel Deposits at Yakabindie as satellite operations. Franco-Nevada’s royalty does not cover Goliath or the southern half of Six Mile Well. It is estimated that royalty area production accounted for 84% of Mt Keith total production in 2021. Yakabindie satellite deposits are expected to provide the majority of ore to the Mt Keith concentrator going forward. In August 2018, BHP Billiton commenced a concept study to expand the Mt Keith concentrator to 50,000 tonnes per annum of nickel in concentrate. 15-year mine life at Mt Keith Yakabindie satellite deposits developed in 2019 - largely outside royalty area Study to expand Mt Keith concentrator to 50,000 tonnes per annum Exploration upside on large land package N Albion Downs Jericho Mt Keith Cliffs Yakabindie Kingston Royalty Area Total: 236.5 km 2 122.5 km 2 Mt Keith Kingston Royalty Area Perth Wiluna Port Hedland Kalgoorlie Mt Keith Royalty Area 114 km 2 Kilometres O 5 10 Mt Keith, Australia
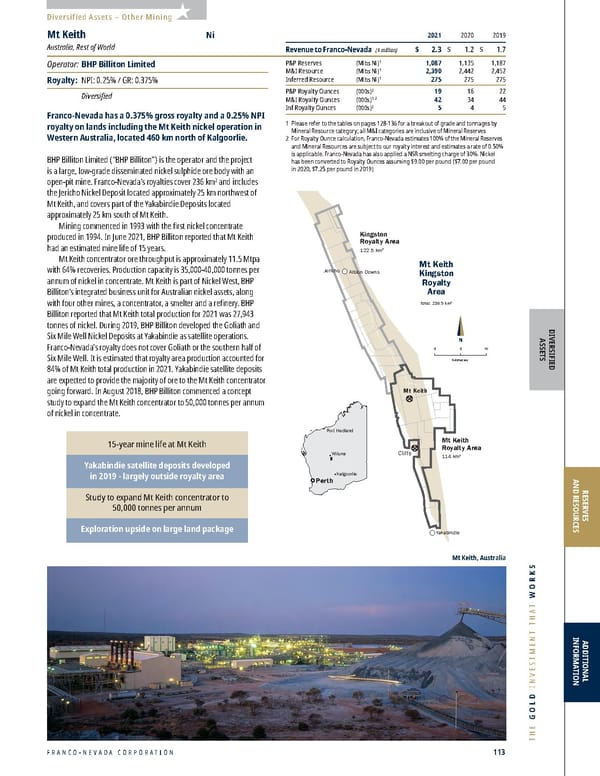
2022 ASSET HANDBOOK 114 FNV TSX NYSE DIVERSIFIED ASSETS Diversified Assets – Other Mining Other Rest of World Assets Rest of World Diversified Please refer to the tables on pages 128-136 for a breakout of grade and tonnages by Mineral Resource category. Mining Exploration Assets as at April 8, 2022 Asset Oper ator Inter est and % 1 DIVERSIFIED – IRON ORE & OTHER MINING South America Para South Iron Project , Brazil T alon Metals Corp. 0.5-1% NSR (All Metals) Trairao Iron Project , Brazil T alon Metals Corp. $0.2995/tonne (Fe) Various-Vale , Brazil V ale S.A. V arious (Fe) Vizcachitas , Chile Los Andes Copper Limited 0.51-2% NSR (All Minerals) United States Chilito-Cyprus Christmas , Arizona Grupo Me xico (Asarco LLC) $0.02/lb (Cu) ; beyond 650M lbs production Copper Creek Redhawk , Arizona CopperBank Resour ces (Copper Creek Project LLC) 1% NSR plus other (All Minerals) Zeolites , Arizona Imagin Miner als et al $1.50/ton plus escalator (Clay) EaglePicher Diatomite II , Nevada EP Miner als, LLC $0.25/short ton plus other (Diatomite) Boling Dome , Texas T otal E&P USA Inc./H&L Newgulf $0.0028225 per long ton (Sulfur) Hobson Pearson , Texas Bridge Oil 20% OR (Uranium) Shirley Basin (Davy Crockett), Wyoming Ur-Ener gy Inc. (Pathfinder Mines Corporation) 4% GR (Uranium) Franco-Nevada has a 2% gross royalty on the southern portion of the Flying Fox nickel mine located in the Forrestania Greenstone belt in Western Australia. Flying Fox is a high-grade underground nickel mine operated by Western Areas Ltd. which has been in production since 2007 and produced 5,707 tonnes of nickel in 2021. In December 2021, Flying Fox Ni Australia, Rest of World Operator: Western Areas Ltd. Royalty: GR: 2% Diversified Diversified Assets – Exploration MINING EXPLORATION ASSETS Diversified - Iron Ore and Other Mining The following table is a list of the diversified (mining) exploration assets of Franco-Nevada as at April 8, 2022. A list of the precious metals exploration assets can be found on page 97. Assets that have had their terms or leases expire and have been written off are not listed. IGO Limited announced an A$1.1 billion takeover offer for Western Areas Ltd. The takeover is expected to be completed in April 2022. During 2021, approximately 56% of Flying Fox production was subject to Franco-Nevada’s royalty, and Franco-Nevada received $0.9 million of royalty revenue from Flying Fox for the year. Franco-Nevada has not included Flying Fox in Royalty Ounce estimates
FRANCO-NEVADA CORPORATION 115 THE GOLD INVESTMENT THAT WORKS DIVERSIFIED ASSETS RESERVES AND RESOURCES ADDITIONAL INFORMATION Diversified Assets – Exploration MINING EXPLORATION ASSETS Diversified - Iron Ore and Other Mining Continued DIVERSIFIED – IRON ORE & OTHER MINING Asset Oper ator Inter est and % 1 Canada Carruthers , British Columbia Cariboo Rose Resour ces Ltd. 2.5% NSR (All Minerals) (buy-back option on 1.5%) Trout Lake (MAX Moly Mine), British Columbia Cameo Industries Corp. 2.5% NSR (All Minerals) Golden Ridge , New Brunswick Darryl Leblanc 2% NSR (All Minerals) Buchans , Newfoundland & Labrador Buchans Resour ces Limited (Buchans Minerals Corporation) 2% NSR (All Minerals) (buy-back option on 1%) LabMag (Taconite), Newfoundland & Labrador Abaxx T echnologies 1.666% GR (Iron Ore-Taconite) Mary March , Newfoundland & Labrador Canstar Resour ces Inc. 1% NSR plus other (All Minerals) Mazenod , NWT BFR Copper & Gold Inc. 2% NSR (All Minerals) (buy-back option on 1%) Redstone (Coates Lake), NWT Copper North Mining Corp. (Redbed Resour ces Corp.) 3-4% NSR (Cu, Ag) Bull Lake , Ontario Wyloo Metals Pty Ltd. (Nor ont Muketei Minerals Ltd.) 2% NSR (All Minerals) Butler and Sanderson (Diagnos), Ontario MacDonald Mines Explor ation Ltd. ROFR on Diagnos Ro yalty (Diamonds/Base Metals) Cline Lake , Ontario Alamos Gold Inc. 0.75% NSR (All Minerals) Diagnos , Ontario Debut Diamonds Inc. 2% NSR (All Minerals) Eagle’s Nest , Ontario Wyloo Metals Pty Ltd. 1% GR (All Minerals) Folson Lake , Ontario Wyloo Metals Pty Ltd. (Nor ont Muketei Minerals Ltd.) 2% NSR (All Minerals) Kyle , Ontario Renforth Resour ces Inc. 2% NSR (All Minerals) MacFadyen & Pele , Ontario Wyloo Metals Pty Ltd. (Nor ont Muketei Minerals Ltd.) 2% NSR (All Minerals) Ring of Fire (Black Thor), Ontario Wyloo Metals Pty Ltd. (Nor ont Muketei Minerals Ltd.) 2-3% NSR (Cr, Ni, Cu) Ring of Fire (Original Noront Properties), Ontario Wyloo Metals Pty Ltd. (Nor ont Muketei Minerals Ltd.) 2% GR (Cr) plus other Sungold , Ontario Interbanc Capital Corp. 2% NSR (All Minerals) Timmins (Project 81-Crawford), Ontario Canada Nickel Company Inc. 2% NSR (All Minerals) Benoist , Quebec Cartier Resour ces Inc. 1% NSR (All Minerals) (buy-back option on 0.5%) Dalhousie , Quebec Wyloo Metals Pty Ltd. (Nor ont Muketei Minerals Ltd.) 2% NSR (All Minerals) Matagami JV , Quebec Glencor e Canada Corporation 2% NSR (All Minerals) Matagami PD1 , Quebec Glencor e Canada Corporation Net Carried Inter est plus other (All Minerals) Crawford Lake , Saskatchewan Denison Mines Corp. 2% NSR (All Minerals) (buy-back option on 1%) Australia Mt Fitch , Northern Territory Northern T erritories Resources Pty Ltd. 1-3% NSR (Cu, Pb, Zn, Co, Ni, U) Bowen Basin (Various), Queensland (32 assets) Peabody Ener gy Corp/Pembroke Resources South Pty Ltd. Pr oduction Payment (Coal) Millmerran (Power Station), Queensland Millmerr an Power Partnership 8.3125% NPI of cashflo w; NPV threshold (Coal) Peculiar Knob , S. Australia GFG Alliance Pr oduction Payment (Fe) Third Plain , S. Australia Perilya Limited/Minotaur Explor ation Ltd. 0.5% NSR (Zn) Moina , Tasmania Geotech International Pty Ltd. A$125K lump sum at commencement of mining Rosebery Extension , Tasmania MMG Limited 2.6305% (Au, Ag, Other Minerals) Agnew (Miranda Nickel), W. Australia Gold Fields Limited 0.5% of pr oduction (Ni) Agnew (Miranda Nickel No2), W. Australia Ramelius Resour ces Limited 0.5% of pr oduction (Ni) Camelback , W. Australia GME Resour ces Limited $0.50/tonne (Ni) FMG Hamersley , W. Australia Fortescue Metals Gr oup Ltd. $0.05/tonne; capped at A$1M (Fe) Heather Bore/Mount Clifford , W. Australia Independence Gr oup NL 1-2% NSR (Cu, Zn, Other Metals) Mt Newman-Victory , W. Australia St Barbar a Limited/Astro Resources NL 0.07% GR (All Minerals) South Kalgoorlie (Location 48), W. Australia BHP Billiton Limited 1-1.75% NSR (Au, Ag, Other Minerals) Rest of World NPI , Philippines Nickel Asia Corpor ation Pr oduction Payment; capped at $10M Rogozna (KMC), Serbia Ibaer a Capital Advisers Pty Ltd. 1.5-2% NSR (Au, Base and Other Metals) Kasese , Uganda Scully Ro yalty Ltd. 10% of fr ee cash flow; capped at $10M (Co) 1 Ro yalty terms have been simplified for presentation purposes. Different terms may apply to certain portions of properties or by commodity. Some royalties may have sliding scales tied to commodity price. Others may include participation in sale pr oceeds of property or gross sales.
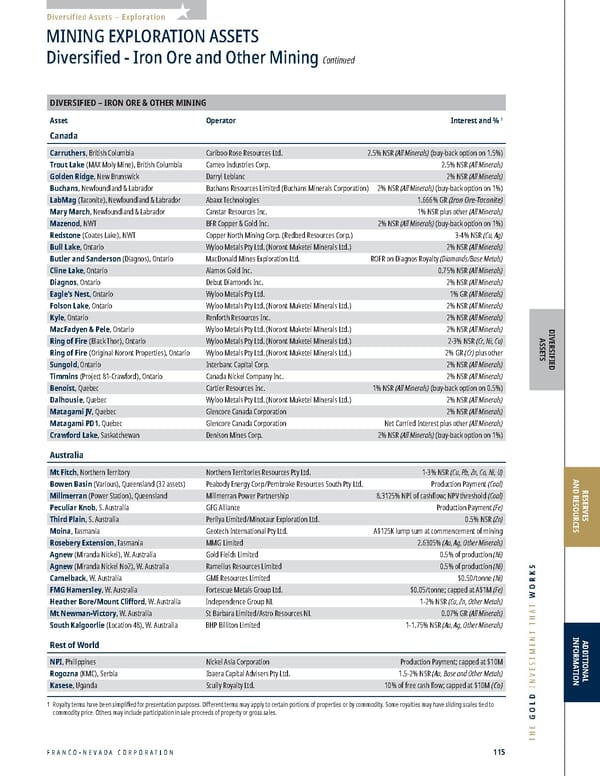
2022 ASSET HANDBOOK 116 FNV TSX NYSE Island Gold Millmerran Red October Henty Mt Keith Duketon Yandal (Bronzewing/Julius) King Vol Bowen Basin South Kalgoorlie (Mt Martin) Flying Fox Sterling Robinson Fire Creek Bald Mountain Marigold EaglePicher Pinson Midas Goldstrike Gold Quarry South Arturo Hollister Nevada Australia Subika (Ahafo) Tasiast Sabodala Edikan MWS Perama Hill Kiziltepe Karma Sissingue Pandora Cobre Panama Falcondo Cerro San Pedro Castle Mountain Rosemont Mesquite Courageous Lake Musselwhite Hemlo New Prosperity Hardrock Detour Lake Midale Weyburn Goldfields Monument Bay Edson Timmins West Sudbury Kirkland Lake Golden Highway Canadian Malartic Nevada Stibnite Gold Cariboo SCOOP Midland Orion Dublin Gulch (Eagle) Red Mountain Delaware STACK Franco-Nevada Australia Office Franco-Nevada Head Office Franco-Nevada U.S. Office Franco-Nevada Barbados Office Kivivic 2 Marcellus Guadalupe-Palmarejo Brucejack CentroGold (Gurupi) Cerro Moro Taca Taca NuevaUnión (Relincho) San Jorge Antamina Salares Norte/ Rio Baker Valentine Lake Antapaccay Candelaria Calcatreu Stillwater Alpala Red Lake (Bateman) Milpillas Haynesville Agate Creek White Dam Condestable Séguéla Edna May Higginsville (Lake Cowan) Aphrodite Matilda (Wiluna) Agnew (Vivien) South Kalgoorlie (New Celebration/ Mt Marion Lithium) Cue Gold (Day Dawn) Agi Dagi ̆ ̆ Carol Lake Vale N. System Vale S.E. System Sossego Producing Advanced Producing (Energy) Edson Cardium Formation Cold Lake Anadarko Basin Permian Basin Midland Delaware STACK SCOOP Peace River Orion Athabasca Weyburn Williston Basin Midale Appalachian Basin Marcellus Oil Gas Geothermal Haynesville Neal Hot Springs DIVERSIFIED ASSETS U.S. AND CANADIAN ENERGY
FRANCO-NEVADA CORPORATION 117 THE GOLD INVESTMENT THAT WORKS Our energy investments have allowed us to be opportunistic through the commodity cycles, adding growth and diversity to our portfolio. “ ” DIVERSIFIED ASSETS RESERVES AND RESOURCES ADDITIONAL INFORMATION Diversified Assets - Energy ENERGY ASSETS North America Island Gold Millmerran Red October Henty Mt Keith Duketon Yandal (Bronzewing/Julius) King Vol Bowen Basin South Kalgoorlie (Mt Martin) Flying Fox Sterling Robinson Fire Creek Bald Mountain Marigold EaglePicher Pinson Midas Goldstrike Gold Quarry South Arturo Hollister Nevada Australia Subika (Ahafo) Tasiast Sabodala Edikan MWS Perama Hill Kiziltepe Karma Sissingue Pandora Cobre Panama Falcondo Cerro San Pedro Castle Mountain Rosemont Mesquite Courageous Lake Musselwhite Hemlo New Prosperity Hardrock Detour Lake Midale Weyburn Goldfields Monument Bay Edson Timmins West Sudbury Kirkland Lake Golden Highway Canadian Malartic Nevada Stibnite Gold Cariboo SCOOP Midland Orion Dublin Gulch (Eagle) Red Mountain Delaware STACK Franco-Nevada Australia Office Franco-Nevada Head Office Franco-Nevada U.S. Office Franco-Nevada Barbados Office Kivivic 2 Marcellus Guadalupe-Palmarejo Brucejack CentroGold (Gurupi) Cerro Moro Taca Taca NuevaUnión (Relincho) San Jorge Antamina Salares Norte/ Rio Baker Valentine Lake Antapaccay Candelaria Calcatreu Stillwater Alpala Red Lake (Bateman) Milpillas Haynesville Agate Creek White Dam Condestable Séguéla Edna May Higginsville (Lake Cowan) Aphrodite Matilda (Wiluna) Agnew (Vivien) South Kalgoorlie (New Celebration/ Mt Marion Lithium) Cue Gold (Day Dawn) Agi Dagi ̆ ̆ Carol Lake Vale N. System Vale S.E. System Sossego Producing Advanced Producing (Energy) Edson Cardium Formation Cold Lake Anadarko Basin Permian Basin Midland Delaware STACK SCOOP Peace River Orion Athabasca Weyburn Williston Basin Midale Appalachian Basin Marcellus Oil Gas Geothermal Haynesville Neal Hot Springs Energy Assets Franco-Nevada has owned and invested in energy assets since inception. Our energy investments allow us to be opportunistic through the commodity cycles, adding growth and diversity to our portfolio. Energy revenue was 16% of Franco-Nevada’s overall revenue in 2021. The scale of the energy sector along with its many participants provides a diverse set of operators and a broad range of royalty opportunities. Until 2016, Fr anco-Nevada’s focus was primarily on the Western Canadian Sedimentary Basin. Starting in late 2016, we added exposure to the SCOOP/STACK basins in Oklahoma and the Midland/Delaware basins in Texas due to their attractive economics, favourable regulatory environment and access to market. In the last few years the energy additions to the portfolio have been in natural gas. In 2019, we added royalty assets in the Marcellus shale in Appalachia, and in late 2020 a portfolio of royalties in the Haynesville shale in East Texas. In 2021, Fr anco-Nevada updated the methodology used to account for undrilled inventory locations for our shale assets in the U.S. The locations are now based on third party reserve estimates for the Proved, Probable, Possible, and Contingent resource categories for currently producing formations. Relative to our prior methodology, these estimates do not include all hydrocarbon-bearing formations at depth and future well locations are typically constrained to shorter distances away from existing wells. Major Producing Assets as at April 8, 2022 UNITED STATES Mar cellus Range Resour ces Haynesville Rockcliff Ener gy/Various SC OOP/STACK Continental Resour ces/Various Permian Basin V arious CANADA W eyburn Unit Whitecap Resour ces Orion Str athcona Resources Orion processing facilities, Alberta
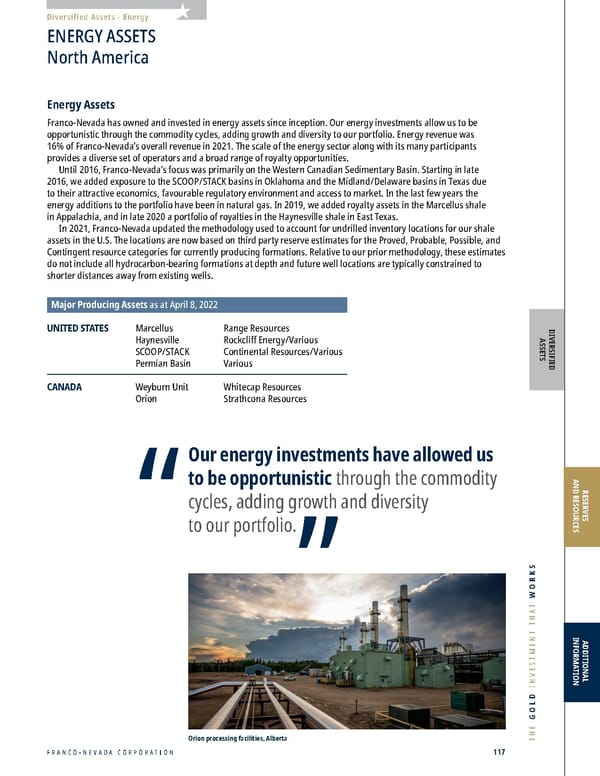
2022 ASSET HANDBOOK 118 FNV TSX NYSE Appalachian Basin Marcellus Energy–U.S. 2021 2020 2019 Revenue to Franco-Nevada ($ million) $ 36.1 $ 20.4 $ 18.0 Production (Mboe) 1 1,458 1,615 1,138 Commodity Split (%) 2 Oil 6% 5% 9% Gas 56% 56% 55% NGL 38% 39% 36% 1 Pr oduction is referenced in barrels of oil equivalent, although is comprised mostly of gas and natural gas liquids 2 Per centage based on production revenue from each commodity 3 Inventory locations ar e based on third party reserve estimates for the Proved, Probable, Possible, and Contingent resource categories for currently producing formations Franco-Nevada has a 1% royalty on the majority of Range Resources Corporation’s (“Range”) operated position in Southwest Pennsylvania. The royalty is calculated as 1% of gross production less minor allowed deductions from approximately 350,000 net acres of Range’s working interest position in Washington, Western Allegheny and Southern Beaver counties in Pennsylvania. The royalty applies to existing production and future development from the Marcellus shale formation as well as future potential development from the Utica and Upper Devonian formations. The royalty is registered on title and is a direct interest in real property. The Mar cellus is one of the most prolific and active gas and liquids plays in North America. Range’s acreage is in a liquids-rich portion of the Marcellus, enhancing well economics and the overall cost structure. Range helped pioneer the Marcellus shale in 2004 with the successful drilling of the Renz #1 well in Washington County, Pennsylvania. Since that time, Range has developed a track record of growing reserves and production from its asset base. In 2021, Fr anco-Nevada received $36.1 million in revenue from the Marcellus royalty. During the year Range drilled and completed 64 wells in the Marcellus on royalty lands, which is an increase from 59 wells in 2020. The land base has a potential inventory of 1,270 futur e well locations 3 implying approximately 20 years of additional drilling (based on the prior year drilling rate), followed by many years of additional production as the wells decline. There is additional potential in the Utica and Upper Devonian formations not included in the above estimate of well locations that may increase the longevity of the asset. Diverse exposure to natural gas and natural gas liquids Long-life asset with strong underlying economics Secure land title with exposure to undeveloped formations at depth DIVERSIFIED ASSETS Marcellus Natural Gas & NGLs SW Pennsylvania, United States Operator: Range Resources Royalty: 1% overriding royalty Energy Range Resources drill pad, SW Pennsylvania
FRANCO-NEVADA CORPORATION 119 THE GOLD INVESTMENT THAT WORKS Energy–U.S. DIVERSIFIED ASSETS RESERVES AND RESOURCES ADDITIONAL INFORMATION 1 Re venue from October 1 st effective date until December 31, 2020 2 Pr oduction is referenced in barrels of oil equivalent, although is comprised mostly of natural gas 3 Per centage based on production revenue from each commodity 4 Inventory locations ar e based on third party reserve estimates for the Proved, Probable, Possible, and Contingent resource categories for currently producing formations In December of 2020, Franco-Nevada acquired a portfolio of royalty rights in the Haynesville natural gas play in Texas from Mesa Minerals Partners LLC, a Quantum Energy Partners portfolio company, for $135 million. The Haynesville represents one of the most active natural gas plays in North America, owing to its strong well performance and close proximity to infrastructure along the U.S. Gulf Coast, which reduces transportation costs. The r oyalties consist of approximately 2,740 net acres of mineral rights, located in Harrison and Panola counties and provide a perpetual interest in land. The royalty position is situated in a core area of the East Texas portion of the Haynesville, which represents a shallower part of the basin where the producing formation is thickest. The portfolio was assembled in strategic partnership with Rockcliff Energy II LLC (“Rockcliff”), which allowed for acreage to be selected on the basis of geologic quality as well as prioritization under the company’s drilling schedule. Approximately 75% of the royalty position is operated by Rockcliff, who has been the most active operator in the East Texas Haynesville. 2021 2020 2019 Revenue to Franco-Nevada ($ million) $ 38.5 $ 4.21 1 $ – Production (Mboe) 1 1,904 340 – Commodity Split (%) 2 Oil 1% 0% – Gas 97% 100% – NGL 2% 0% – Haynesville Natural Gas East Texas, United States Operator: Rockcliff Energy, Others Royalty: Various Royalty Rates Energy Natural gas exposure concentrated under strong operator Close proximity to U.S. Gulf Coast enhances economics Secure land title with proven production history Kilometres 0 15 N Harrison County Panola County Texas Haynesville FNV Royalty Acreage Haynesville Fairway Louisiana TEXAS Eagle Ford Barnett Haynesville-Bossier NEW MEXICO LOUISIANA OKLAHOMA ARKANSAS Regional Basins Tuscaloosa Fayetteville Woodford Spraberry Bend Permian Basin Anadarko Basin Ardmore Basin Arkomo Basin Fort Worth Basin Miles 0 10 The portfolio principally gener ates revenue from dry natural gas production and generated $38.5 million in 2021. During 2021, approximately 95 wells were drilled and completed on royalty lands. The land base has a potential inventory of 550 future well locations 4 implying approximately 6 years of additional drilling (based on the prior year drilling rate), followed by many years of additional production as the wells decline. The royalties also provide further development potential in the Cotton Valley formation, which may be further exploited in the future. The Haynesville portfolio has performed well since acquisition and the activity levels are expected to remain robust in 2022. Rockcliff Energy drill rig, East Texas
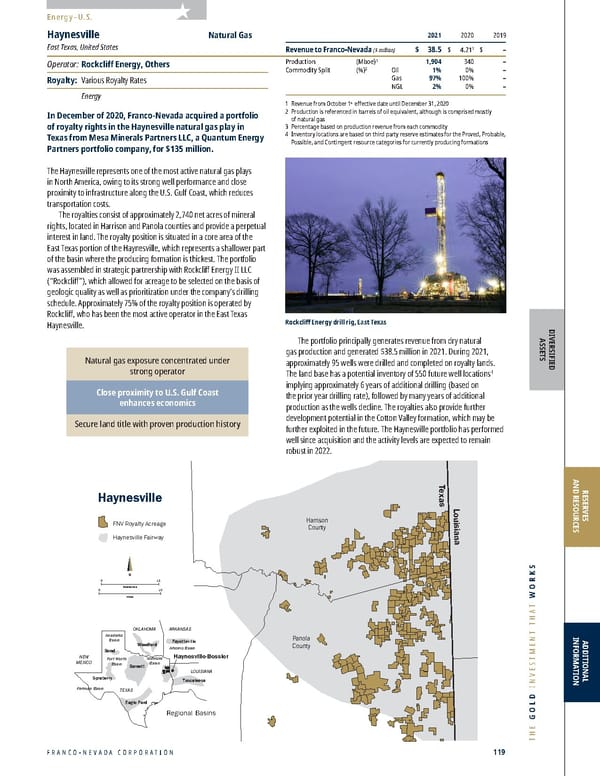
2022 ASSET HANDBOOK 120 FNV TSX NYSE Energy–U.S. DIVERSIFIED ASSETS 1 Re venue refers only to payments made to Franco-Nevada 2 Includes r evenue and production from both Continental Royalty Acquisition Venture and Other SCOOP/STACK royalties 3 Per centage based on production revenue from each commodity 4 Inventory locations ar e based on third party reserve estimates for the Proved, Probable, Possible, and Contingent resource categories for currently producing formations SCOOP/STACK Oil & Natural Gas Oklahoma, United States Operator: Continental Resources, Ovintiv Inc., De von Energy, Others Royalty: Various Royalty Rates Energy 2021 2020 2019 Revenue to Franco-Nevada ($ million) 1,2 $ 36.4 $ 21.6 $ 26.2 Production (Mboe) 2 893 1,174 949 Commodity Split (%) 3 Oil 48% 60% 70% Gas 47% 32% 24% NGL 6% 8% 6% assets and Franco-Nevada does not incur any administrative burden. The venture was established to acquire royalty rights in areas primarily within acreage operated by Continental. These areas offer excellent economics, proximity to infrastructure and future upside via stacked hydrocarbon- bearing horizons. As at December 31, 2021, Fr anco-Nevada had contributed $428.4 million to the venture, with a remaining commitment of approximately $91.6 million. Continental’s drilling activity remained stable for much of 2021 although increased towards the end of the year. The expectation is that volumes will continue to grow with increased drilling activity as energy prices increase. SCOOP/STACK provides exposure to both oil and gas-rich areas Exposure to multiple formations at depth Royalty volumes in the Royalty Acquisition Venture are supported by volume targets from Continental GARFIELD N Kilometres 0 40 Black Oil Volatile Oil Condensate Dry Gas DEWEY BLAINE KINGFISHER MAJOR CANADIAN OKLAHOMA LINCOLN CREEK OKFUSKEE HUGHES COAL ATOKA BRYAN MARSHALL JOHNSTON PONTOTOC SEMINOLE POTTAWATOMIE CLEVELAND MCCLAIN GARVIN MURRAY CARTER LOVE JEFFERSON STEPHENS CLAY COTTON WICHITA WILBARGER TILLAMAN JACKSON KIOWA GRADY GREER WASHITA COMANCHE LOGAN PAYNE CADDO CUSTER Pressure Transition Miles 0 25 SCOOP/STACK STACK Gross SCOOP/STACK Royalty Exposure Oklahoma City OKLAHOMA SCOOP TEXAS KANSAS ARKANSAS NEW MEXICO MISSOURI COLORADO Anadarko Basin STACK SCOOP Through several discrete transactions, Franco-Nevada has accumulated a large royalty position in the SCOOP and STACK plays in Oklahoma. In the fourth quarter of 2016, Franco-Nevada purchased royalty rights in the STACK shale play in Oklahoma’s Anadarko basin for approximately $100 million. The current focus is on the Meramec formation, although the royalties have exposure to multiple horizons at depth, including the Woodford and Osage formations. In the second quarter of 2017, Fr anco-Nevada acquired additional mineral title and royalty interests for $27.6 million, which added to its existing position in the STACK and provided new exposure to the SCOOP shale play to the south. In total, the assets consist of GORRs and mineral title rights which apply to approximately 1,430 acres (net to Franco-Nevada). The top thr ee operators on the acreage are Ovintiv Inc. (formerly Encana), Devon Energy, and Continental Resources, Inc. (“Continental”). These operators reduced their drilling activity in the play in 2020 owing to a sharp drop in commodity prices, and while the drilling rates increased in 2021, they remain below peak levels achieved in 2019. In 2021, 30 wells were drilled and completed on royalty lands. The land base has a potential inventory of 1,070 future well locations 4 implying approximately 36 years of additional drilling (based on the prior year drilling rate), followed by many years of additional production as the wells decline. In the fourth quarter of 2018, Fr anco-Nevada and Continental entered into a transaction whereby Franco-Nevada acquired $120 million in existing royalties owned by Continental and formed a jointly owned entity (the “Royalty Acquisition Venture”) to jointly acquire up to $400 million in royalty rights under Continental’s area of operations. With the Royalty Acquisition Venture, Franco-Nevada funds 80% of the acreage cost and receives 50-75% of distributions, depending on performance against pre-set volume targets. In exchange for the partial capital carry in favour of Continental, the venture provides Franco- Nevada with an opportunity to acquire royalty rights at the grass-roots level, leverage the value of Continental’s drilling plans, and benefit from the company’s knowledge of local land title and geology. In addition, Continental manages the Continental Resources drill rig, Oklahoma
FRANCO-NEVADA CORPORATION 121 THE GOLD INVESTMENT THAT WORKS 2021 2020 2019 Revenue to Franco-Nevada ($ million) 1 $ 34.9 $ 18.5 $ 20.0 Production (Mboe) 2 708 737 524 Commodity Split (%) 3 Oil 78% 88% 88% Gas 11% 5% 4% NGL 11% 7% 8% 1 Re venue refers only to payments made to Franco-Nevada 2 Net to the Oil & Gas Inter ests 3 Per centage based on production revenue from each commodity 4 Inventory locations ar e based on third party reserve estimates for the Proved, Probable, Possible, and Contingent resource categories for currently producing formations Permian Basin Oil Texas, United States Operator: Pioneer Natural Resources, Occidental Petr oleum, Coterra Energy, others Royalty: Various Royalty Rates Energy Franco-Nevada has exposure to the Permian Basin in West Texas, through both the Midland and Delaware sub-basins. Both of these basins are considered among the most economic and prolific shale oil plays in the U.S. and have been the key drivers behind U.S. oil production growth over the last decade. Effective in the first quarter of 2017, Fr anco-Nevada purchased a package of royalties in the Midland Basin for approximately $115 million. The Midland Basin comprises the eastern portion of the broader Permian Basin. The Permian is the most active shale play in North America. The royalty acreage is very diversified, covering a significant portion of the core of the Midland basin and providing exposure to multiple benches in the Wolfcamp and Spraberry formations. The royalties consist of approximately 97% mineral title rights, along with some GORR interests, which apply to approximately 1,012 acres (net to Franco-Nevada). The acreage is host to numerous operators, however, Pioneer Natural Resources (“Pioneer”) is the operator for the largest portion of royalty acreage and is one of the largest companies operating in the basin. Pioneer is focused solely on its Midland Basin acreage and achieves some of the best well results in the area. In the thir d quarter of 2017, Franco-Nevada acquired a package of royalties in the Delaware Basin for approximately $101 million. The Delaware Basin comprises the western portion of the broader Permian Basin, which is located in West Texas and southeast New Mexico. Sitting to the west of the Midland Basin, the Delaware Basin shares many similarities geologically, and has been increasing in focus for operators, due to the stacked pay potential and premier economics. The royalties consist of approximately 94% mineral title rights, along with some GORR interests, which apply to approximately 670 acres (net to Franco-Nevada). There are various operators across the acreage who continue to direct capital toward the Delaware Basin, which will result in continued development of our assets over time. Energy–U.S. Royalties provide exposure to Midland and Delaware Basins Permian represents one of the most active and economic plays in North America Exposure to upside through multiple formations at depth DIVERSIFIED ASSETS RESERVES AND RESOURCES ADDITIONAL INFORMATION REAGAN GLASSCOCK MIDLAND ECTOR UPTON CRANE HOWARD MARTIN ANDREWS BORDEN DAWSON CROCKETT IRION Midland Basin Net Royalty Acres by County Permian Basin Gross Royalty Acreage N Kilometres 0 16 Miles 0 10 Texas Midland Basin Delaware Basin New Mexico WINKLER PECOS REEVES WARD CULBERSON LOVING LEA EDDY JEFF DAVIS New Mexico Texas San Simon Channel Northwest Shelf Central Basin Platform Permian Basin Delaware Basin 23% Reeves 16% Martin 15% Glasscock 11% Midland 8% Howard 7% Loving 5% Reagan 4% Upton 3% Ward 3% Culberson 3% Eddy 1.% Lea 1% Other In 2021, Fr anco-Nevada generated $34.9 million from the Permian Basin royalties. During the year, 585 wells were drilled and completed on royalty lands, which is an increase from the 359 wells drilled in 2020. The land base has a potential inventory of 7,012 future well locations 4 implying approximately 12 years of additional drilling (based on the prior year drilling rate), followed by many years of additional production as the wells decline. The inventory estimate relates to currently active formations, however the Permian has additional stacked formations that may be exploited in the future. In 2021, there was a rebound of activity levels on royalty lands and combined with higher commodity prices, the Permian assets had a significant increase in revenue. Drill rig in the Permian Basin, Texas
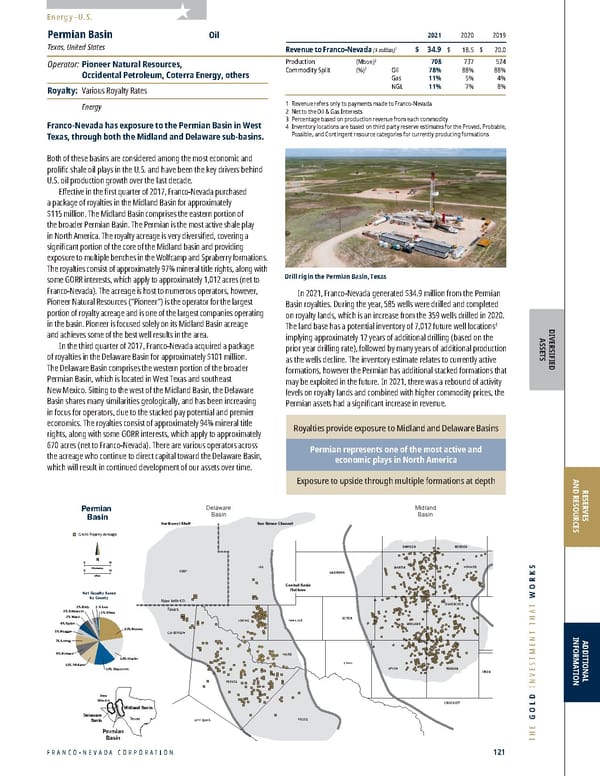
2022 ASSET HANDBOOK 122 FNV TSX NYSE Energy–Canada Weyburn Unit Oil Saskatchewan, Canada Operator: Whitecap Resources Inc. Royalty: NRI: 11.71% /ORR: 0.44% / WI: 2.56% Energy Franco-Nevada, after Whitecap Resources Inc. (“Whitecap”), has the second largest economic interest in the Weyburn Unit, one of the world’s largest geological CO 2 storage projects. The Weyburn Unit is located approximately 129 km southeast of Regina, Saskatchewan and encompasses approximately 216 km 2 on a gross basis (net 31 km 2 ) in which the Mississippian Midale beds are unitized. As of December 31, 2021, Franco-Nevada held an 11.71% NRI, a 0.44% ORR and a 2.56% WI in the Weyburn Unit. Production commenced from the Midale zone within the unitized area in 1955 under primary depletion (solution gas expansion). Establishment of the Weyburn Unit occurred in 1963 for the purpose of implementing a waterflood pressure maintenance scheme. In 2000, Cenovus, the operator at that time, began injecting CO 2 in a portion of the Weyburn Unit as an enhanced oil recovery (“EOR”) method. Gr oss production of the Weyburn Unit is approximately 22,000 Boe/d of light oil. Weyburn is a long-life asset with a proven and probable reserve life of almost 20 years. For 2021, r evenue received by Franco-Nevada from the Weyburn Unit was $43.8 million. Revenue for the NRI is recorded net of deductions for capital and operating costs, which results in increased leverage to the oil price. Oil production, including NGLs, net to Franco-Nevada was 2,015 Boe/d. Franco-Nevada takes product-in-kind for its WI and NRI share of this production and markets it through a third party marketer. Weyburn is a highly economic reservoir, although our NRI and Working Interest in the unit have higher leverage to commodity price swings that our revenue based royalties. Our interests benefited from the recovery in commodity prices in 2021 following the pandemic lows in 2020. CO 2 EOR project commenced in 2000 and continues to be rolled out Interests are highly leveraged to commodity prices Low decline asset with proven production history DIVERSIFIED ASSETS Weyburn Unit wells Unitized land Note: not to scale T7 T6 T5 R13W2 R12W2 R14W2 N Weyburn Unit Note: not to scale R15W2 R14W2 R13W2 R12W2 R11W2 R10W2 R9W2 R8W2 R15W2 R14W2 R13W2 R12W2 R11W2 R10W2 R9W2 R8W2 T9 T8 T7 T6 T5 T4 T3 T9 T8 T7 T6 T5 T4 T3 Weyburn, SK Unitized land Midale, SK N Pacific Ocean Alberta British Columbia Saskatchewan Manitoba United States Weyburn 2021 2020 2019 Revenue to Franco-Nevada ($ million) 1 $ 43.8 $ 16.0 $ 33.8 Production (Mboe) 2 736 511 681 Commodity Split (%) 3 Oil 100% 100% 100% Gas 0% 0% 0% NGL 0% 0% 0% 1 Re venue refers only to payments made to Franco-Nevada 2 Net to the Oil & Gas Inter ests based on 0.44% ORR, 11.71% NRI and 2.56% WI. ORR and W.I. volumes are a percentage of gross production. NRI volumes are pro-rated based on our profit, reflecting a net interest 3 Per centage based on production revenue from each commodity Weyburn processing facility, Saskatchewan
FRANCO-NEVADA CORPORATION 123 THE GOLD INVESTMENT THAT WORKS Energy–Canada DIVERSIFIED ASSETS RESERVES AND RESOURCES ADDITIONAL INFORMATION Franco-Nevada acquired a 4% GORR on the Orion Thermal Project in the Cold Lake region of Alberta from OSUM Oil Sands Corp. for C$92.5M in 2017. In 2021, OSUM was acquired by Strathcona Resources Ltd. (“Strathcona”), who now operates the project. The royalty applies to the Clearwater formation and allows for the deduction of transportation and diluent costs associated with transporting the product to market. Orion is a Steam Assisted Gr avity Drainage (“SAGD”) operation that began commercial production in 2007. Infrastructure at the project consists of a central processing facility surrounded by several well pads which supply the plant. The asset has a large resource base capable of supporting the production of heavy oil beyond 2050 on a Proven and Probable reserve basis. As at year-end 2021 Orion was producing approximately ~16,000 barrels per day of bitumen. The prior operator had plans to increase production beyond 20,000 barrels per day. Fr anco-Nevada recorded revenue of $10.8 million in 2021. Royalty payments are based on the WCS benchmark price and are impacted by changes in the differential with WTI as well as by the price of diluent, which is required to transport the product to market. Long-life resource located in Canada Stable year over year production volumes Potential for future capacity expansion Grand Prairie Calgar y Lloydminster Hardisty Edmonton Fort McMurray Cold Lake Peace River Alberta Saskatchewan Orion Athabaska Lloydminster Hardisty Edmonton Cold Lake Orion N Orion Alberta Saskatchewan Liquids Pipeline 2021 2020 2019 Revenue to Franco-Nevada ($ million) 1 $ 10.8 $ 5.9 $ 10.2 Production (Mboe) 2 237 281 271 Commodity Split (%) 3 Oil 100% 100% 100% Gas 0% 0% 0% NGL 0% 0% 0% 1 Re venue refers only to payments made to Franco-Nevada 2 Net to the Oil & Gas Inter ests 3 Per centage based on production revenue from each commodity Orion Oil Alberta, Canada Operator: Strathcona Resources Ltd. Royalty: Royalty Rate 4% Energy Orion processing facilities, Alberta
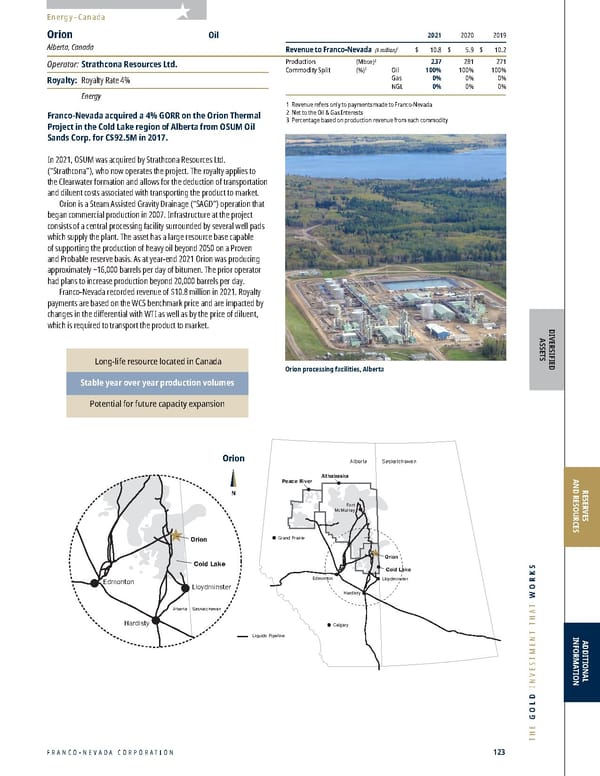
2022 ASSET HANDBOOK 124 FNV TSX NYSE Energy–Canada/U.S. Franco-Nevada has other interests in Western Canada which generate revenue primarily through lessor royalties and GORRs. Aside from the major producing assets of Weyburn and Orion, Franco-Nevada has 44 Other Producing Assets that generate revenue. These interests cover more than 2,250 km 2 . In Saskatche wan and Manitoba, the assets are focused primarily in high quality oil plays and are operated by companies such as Crescent Point Energy, Saturn Oil & Gas Inc., Vermilion Energy Inc. and Tundra Oil & Gas Partnership. The most significant producing assets are comprised of the Midale Unit and the Tidewater royalties. Franco- Nevada holds a 1.14% gross override royalty interest and a 1.59% working interest in the Midale Unit in Southeast Saskatchewan where Cardinal Energy produces approximately 4,000 Boe/d through CO 2 Enhanced Oil Recovery (“EOR”) techniques. The Tidewater royalties in Saskatchewan generate oil production from the Shaunavon and other formations and are managed by various operators. In Alberta and BC, the inter ests generate revenue primarily from natural gas production from shallow gas formations such as Milk River and Medicine Hat. In northern Alberta, the interests provide exposure to deeper conventional gas targets including the Shunda, Grosmont and Elkton formations. Franco-Nevada’s most significant assets in the region are the Edson property operated by Canadian Natural Resources Ltd. (“CNRL”) and the Medicine Hat Consolidated Unit No.1, operated by Canlin Resources Partnership. Franco-Nevada has an approximate 15% overriding royalty in the Edson property where CNRL extracts gas and natural gas liquids by exploiting resources in the Cardium Formation. The Medicine Hat Unit has been producing gas since 1963 and is located approximately 257 km southeast of Calgary. Other production comes from unitized and non-unitized wells, including gross overriding royalty positions in ten different Units across Alberta. Other operators on the interests include, CNRL and Imperial Oil. In 2020, Fr anco-Nevada acquired a royalty on the Neal Hot Springs geothermal operation in Oregon as part of a broader portfolio transaction. The plant produces approximately 22 MW of geothermal energy and is operated by Ormat Technologies, Inc. Primarily quality oil plays in Saskatchewan and Manitoba Exposure to shallow gas and deeper conventional gas in Alberta and BC Interest in the Neal Hot Springs geothermal operation DIVERSIFIED ASSETS N Kilometres 0 80 BRITISH COLUMBIA MONTANA IDAHO WASHINGTON Montney Deep Basin Edson Cardium Duvernay Alberta Bakken Lloydminster Heavy Oil Shallow Gas CBM (HSCN) Redwater Viking CALGARY Peace River Oil Sands Athabasca Oil Sands Cold Lake Oil Sands Alberta/ British Columbia Oil & Gas Interests ALBERTA EDMONTON SASKATCHEWAN Company Core Land Company Non Core Land Major City MANITOBA SASKATCHEWAN NORTH DAKOTA MONTANA Sanish Oil Torquay Oil SE Saskatchewan Lower Bakken & Mississippian Oil Williston Basin Bakken Dodsland Viking Shallow Gas Spearfish Oil REGINA Lloydminster Heavy Oil Shaunavon Oil N Kilometres 0 80 Saskatchewan/Manitoba Oil & Gas Interests Weyburn/ Midale ALBERTA Company Core Land Company Non Core Land Major City Other Producing Energy Assets BC / AB / SK / MB, Canada and Oregon, U.S. Operator: Various Royalty: ORR/FH: 0.5-20% Energy 2021 2020 2019 Revenue to Franco-Nevada ($ million) 1 $ 8.9 $ 5.1 $ 7.7 Production (Mboe) 2 257 319 323 Commodity Split (%) 3 Oil 67% 70% 79% Gas 20% 16% 10% NGL 13% 14% 11% 1 Re venue refers only to payments made to Franco-Nevada; includes revenue received from lease and bonus payments 2 Net to the Oil & Gas Inter ests and does not include production from Neal Hot Springs 3 Per centage based on production revenue from each commodity
FRANCO-NEVADA CORPORATION 125 THE GOLD INVESTMENT THAT WORKS DIVERSIFIED ASSETS RESERVES AND RESOURCES ADDITIONAL INFORMATION Energy–Canada/U.S. Other Producing Energy Assets Location Alameda Oil Saskatche wan Alida Oil Saskatche wan Benson Oil Saskatche wan Carnduff Oil Saskatche wan Cessford Gas Alberta Claresholm Gas Alberta E. Crossfield Gas Alberta Edson Gas Alberta Elswick Oil Saskatche wan Enchant Gas Alberta Ferrybank Gas Alberta Ghost Pine Gas Alberta Hanlan Gas Alberta Harmattan Gas Alberta Harvest - AB Gas Alberta Huntoon Oil Saskatche wan Innes Oil Saskatche wan Inverness Oil Alberta Laglace Gas Alberta Lesser Slave Oil Alberta Lochend Gas Alberta Lone Pine Gas Alberta Location Macoun Oil Saskatche wan Manitoba Oil Manitoba Medicine Hat Gas Alberta Midale Royalties Oil Saskatche wan Midale WI Oil Saskatche wan Montreal Trust Oil Saskatche wan Neal Hot Springs Geothermal Or egon Oungre Oil Saskatche wan Pearmac - AB Gas Alberta Pearmac - MB Oil Manitoba Pearmac - SK Oil Saskatche wan Prudential - AB Gas Alberta Qu’Appelle Oil Saskatche wan Queensdale Oil Saskatche wan Rainbow South Oil Alberta Rocanville Oil Saskatche wan Royce Gas Alberta Stoughton Oil Saskatche wan Swalwell Gas Alberta Tidewater Oil Saskatche wan Watts/Craig Oil Alberta Viewfield Oil Saskatche wan Pump jack near Weyburn, Saskatchewan
2022 ASSET HANDBOOK 126 FNV TSX NYSE DIVERSIFIED ASSETS Energy Exploration Assets AB / MB / SK, Canada & Nevada, U.S. Operator: Various Royalties: 0.1-18% and WI: 2-100% Energy In addition to its producing assets, Franco-Nevada has exposure to a portfolio of undeveloped, non-producing oil & gas interests. These are grouped into 27 different assets covering an area of over 1,500 km 2 and are located in Alberta, Saskatchewan and Manitoba along with a small amount of acreage in Nevada. Much of the interests consist of mineral title which is currently unleased. Exploration Assets Location Big Bend Alberta Carbon Alberta Cindy/Belloy Alberta Colgate Saskatche wan Devil Alberta Dixonville Alberta Elko Mineral Rights Nevada Flatrock British Columbia Granor Alberta Harvest - SK Saskatche wan Hotchkiss Alberta Killam Alberta Kimiwan Alberta Location Liege Alberta Long Coulee Alberta Melville Saskatche wan Paradise British Columbia Provost Alberta Prudential - MB Manitoba Prudential - SK Saskatche wan Steelman Saskatche wan Swift Current Saskatche wan Touchwood Alberta Turner Alberta W. Calling Lake Alberta Widewater Alberta Numerous future opportunities in Western Canada and the U.S. Energy–Canada/U.S. Drill rig near Weyburn, Saskatchewan
FRANCO-NEVADA CORPORATION 127 THE GOLD INVESTMENT THAT WORKS Mineral Reserves and Resources 128 Gold Mineral Reserves 130 Gold Mineral Resources 132 Silver Mineral Reserves and Resources 133 PGM, Copper Mineral Reserves and Resources 134 Nickel, Chromite, Iron Ore Mineral Reserves and Resour ces RESERVES AND RESOURCES
2022 ASSET HANDBOOK 128 FNV TSX NYSE RESERVES AND RESOURCES Reserves and Resources Reserves and Resources Gold Mineral Reserves Pr oven Pr obable Proven & Probable T onnes Gr ade Contained T onnes Gr ade Contained Tonnes Gr ade Contained Notes 000s g/t 000 o z 000s g/t 000 o z 000s g/t 000 o z Gold - South America Candelaria 3,4 540,929 0.12 2,100 134,645 0.16 700 675,574 0.12 2,700 Antapaccay 5 189,000 0.08 486 286,000 0.08 736 475,000 0.08 1,222 Condestable 6 20,546 0.19 128 7,376 0.18 42 27,922 0.19 170 Sossego 7 59,200 0.24 457 39,100 0.10 126 98,300 0.19 583 Cerr o Moro 8 365 9.27 109 1,384 7.82 348 1,749 8.12 457 Salar es Norte 9 – – – 21,079 5.13 3,476 21,079 5.13 3,476 Cascabel 10 – – – – – – – – – Posse (Mar a Rosa) 11 11,800 1.20 456 12,000 1.16 446 23,800 1.18 902 T aca Taca 12 408,300 0.13 1,750 1,350,200 0.08 3,337 1,758,500 0.09 5,087 Centr oGold (Gurupi) 13 – – – – – – – – – Calcatr eu 14 – – – – – – – – – San Jor ge 15 – – – – – – – – – V olcan 16 – – – – – – – – – Gold - Central America & Mexico Cobr e Panama 17 236,000 0.11 835 2,790,500 0.07 6,270 3,026,600 0.07 7,104 Guadalupe-Palmar ejo 2,18 3,406 2.26 247 11,012 1.80 637 14,418 1.91 884 Gold - United States Carlin T rend 19 39,024 6.01 7,317 130,081 2.70 11,220 162,602 3.46 17,886 Marigold 20 – – – 203,800 0.52 3,410 203,800 0.52 3,410 Bald Mountain 21 – – – 40,980 0.60 798 40,980 0.60 798 Mesquite 22 34 0.79 1 30,264 0.48 470 30,298 0.48 471 Castle Mountain 23 84,910 0.55 1,498 172,990 0.48 2,670 257,900 0.51 4,168 Fir e Creek/Midas 2,24 – – – – – – – – – Hollister 2,25 – – – – – – – – – Stibnite Gold 26 4,996 2.35 378 99,630 1.39 4,441 104,626 1.43 4,819 Sandman 27 – – – – – – – – – Robinson 28 110,513 0.15 533 8,860 0.12 34 119,374 0.15 576 Gold - Canada Detour Lake 29 80,269 1.13 2,917 493,044 0.76 12,117 573,313 0.82 15,034 Sudbury 30 not available not available not available Hemlo 31 360 4.79 55 6,100 5.19 1,000 6,400 5.16 1,100 Brucejack 32 2,400 7.90 600 12,000 8.40 3,300 14,400 8.30 3,900 Kirkland Lake 33 237 15.30 116 3,315 16.32 1,740 3,551 16.26 1,856 Dublin Gulch (Eagle) 34 30,000 0.71 694 118,000 0.63 2,366 148,000 0.64 3,061 Musselwhite 35 2,800 5.07 460 6,700 6.07 1,310 9,500 5.77 1,770 Timmins W est 36 1,518 3.03 148 4,172 2.94 393 5,690 2.96 541 Canadian Malartic 37 42,932 0.84 1,160 57,516 1.28 2,376 100,510 1.09 3,534 Island Gold 38 834 9.33 250 3,278 10.33 1,088 4,112 10.12 1,338 Golden Highway - Holt Comple x 39 – – – – – – – – – Golden Highway - Hislop 40 – – – – – – – – – Golden Highway - Aquarius 41 – – – – – – – – – Gr eenstone (Hardrock) 42 5,623 1.28 232 129,700 1.27 5,307 135,323 1.27 5,538 V alentine Lake 43 29,700 1.46 1,400 17,400 1.17 700 47,100 1.36 2,100 Eskay Cr eek 44 13,500 4.25 1,850 12,900 2.46 1,020 26,400 3.37 2,870
FRANCO-NEVADA CORPORATION 129 THE GOLD INVESTMENT THAT WORKS RESERVES AND RESOURCES ADDITIONAL INFORMATION Reserves and Resources Reserves and Resources Gold Mineral Reserves Pr oven Pr obable Proven & Probable T onnes Gr ade Contained T onnes Gr ade Contained Tonnes Gr ade Contained Notes 000s g/t 000 o z 000s g/t 000 o z 000s g/t 000 o z Gold - Canada (continued) Red Lake (Bateman) 45 339 5.76 63 3,223 5.52 572 3,563 5.54 635 Cour ageous Lake 46 12,000 2.41 1,000 79,000 2.17 5,500 91,000 2.20 6,500 Goldfields 47 – – – – – – – – – Monument Bay 48 – – – – – – – – – Red Mountain 49 2,194 6.68 471 351 5.51 62 2,545 6.52 534 Fenelon-Martiniere 50 – – – – – – – – – Gold - Australia Duketon 51 14,000 0.50 210 55,000 1.00 1,780 69,000 0.90 1,990 Matilda (Wiluna) 52 330 3.06 33 36,090 1.07 1,236 36,410 1.08 1,269 South Kalgoorlie 53 655 4.80 101 1,073 5.36 185 1,727 5.15 286 Y andal (Bronzewing) 54 3,600 2.00 234 11,891 1.50 557 15,491 1.60 791 Aphr odite 55 – – – 7,105 2.51 573 7,105 2.51 573 Red October 56 – – – – – – – – – Henty 57 – – – – – – – – – Bullabulling 58 – – – – – – – – – Edna May 59 600 0.50 9 380 3.20 40 980 1.55 49 Glenbur gh 60 – – – – – – – – – Gold - Rest of World MWS 61 50,000 0.24 390 164,900 0.26 1,358 214,900 0.25 1,749 Sabodala-Massawa Comple x 62 17,300 1.25 696 60,100 2.12 4,101 77,400 1.93 4,796 Tasiast 63 48,563 1.30 1,961 63,910 2.20 4,443 112,473 1.80 6,404 Subika (Ahafo) 64 49,500 1.80 2,860 52,400 1.92 3,240 101,900 1.86 6,100 Karma 65 300 0.40 4 5,200 0.93 154 5,500 0.90 158 Edikan 66 14,100 1.06 480 22,300 1.17 837 36,400 1.13 1,318 Kiziltepe 67 466 2.06 31 451 2.65 38 926 2.39 71 Seguela 68 – – – 12,100 2.80 1,088 12,100 2.80 1,088 Per ama Hill 69 3,088 4.03 400 9,410 2.81 850 12,498 3.11 1,250 Aği Daği 70 1,450 0.76 36 52,911 0.66 1,130 54,361 0.67 1,166 Sissingue 71 3,800 1.51 184 700 2.58 58 4,600 1.64 242 TOTAL GOLD MINERAL RESERVES 35,339 99,679 134,323
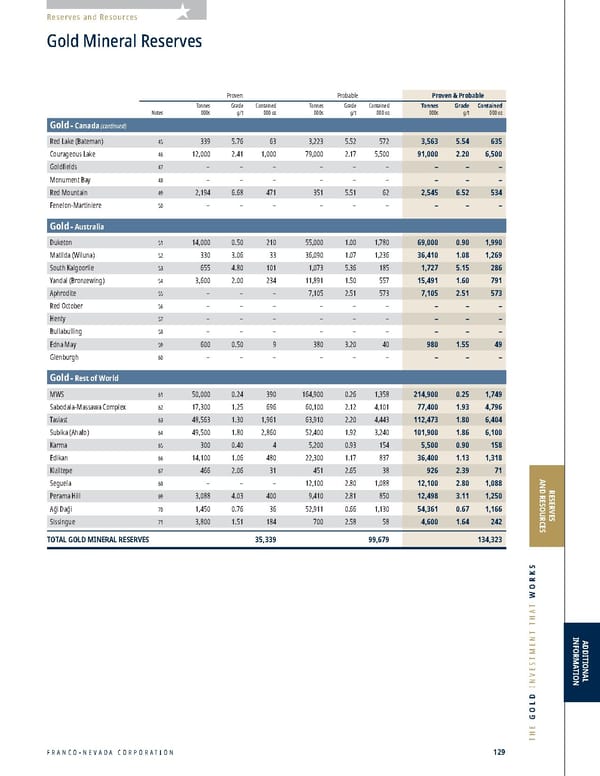
2022 ASSET HANDBOOK 130 FNV TSX NYSE Reserves and Resources RESERVES AND RESOURCES Gold Mineral Resources Inclusive of Reserves Measur ed (M) Indicated (I) (M)+(I) Inferr ed T onnes Gr ade Contained T onnes Gr ade Contained Contained T onnage Gr ade Contained Notes 000s g/t 000 o z 000s g/t 000 o z 000 o z 000s g/t 000 o z Gold - South America Candelaria 3,4 874,003 0.13 3,700 370,541 0.16 1,900 5,600 99,029 0.16 500 Antapaccay 5 266,000 0.08 684 1,009,000 0.08 2,595 3,279 238,000 0.05 383 Condestable 6 33,392 0.24 259 55,934 0.24 430 701 60,600 0.24 480 Sossego 7 not available not available – not available Cerr o Moro 1,8 542 7.98 139 2,144 6.31 435 574 1,488 4.73 226 Salar es Norte 9 – – – 23,714 4.99 3,804 3,804 1,842 1.84 109 Cascabel 10 1,192,000 0.39 15,000 1,703,000 0.14 7,800 22,900 751,000 0.13 3,140 Posse (Mar a Rosa) 11 14,000 1.20 510 19,000 1.10 640 1,200 100 0.60 2 T aca Taca 12 421,500 0.14 1,853 1,781,800 0.07 4,200 6,052 716,900 0.05 1,183 Centr oGold (Gurupi) 13 – – – 21,000 1.90 1,300 1,300 7,300 1.80 410 Calcatreu 14 – – – 9,841 2.11 669 669 8,078 1.34 348 San Jor ge 15 79,518 0.22 584 104,091 0.19 626 1,211 11,235 0.16 59 Volcan 16 105,918 0.74 2,513 283,763 0.70 6,368 8,881 41,553 0.50 671 Gold - Central America & Mexico Cobr e Panama 17 234,800 0.12 906 3,318,700 0.06 6,490 7,396 1,093,800 0.04 1,301 Guadalupe-Palmar ejo 1,2,18 6,758 2.03 442 26,776 1.73 1,489 1,931 4,276 1.79 246 Gold - United States Carlin T rend 19 82,927 4.68 12,683 276,423 2.20 19,512 30,894 110,569 2.10 7,480 Marigold 1,20 – – – 319,100 0.49 5,004 5,004 21,800 0.36 252 Bald Mountain 1,21 9,150 0.80 233 232,355 0.56 4,157 4,390 45,716 0.50 669 Mesquite 22 126 0.74 3 140,670 0.42 1,921 1,924 85,419 0.34 928 Castle Mountain 23 88,026 0.57 1,604 256,074 0.52 4,315 5,919 86,271 0.58 1,608 Fir e Creek/Midas 1,2,24 20 17.14 11 171 15.06 83 94 69,473 1.43 3,185 Hollister 1,2,25 16 19.05 10 64 19.59 40 51 582 14.58 273 Stibnite Gold 26 4,902 2.42 382 127,367 1.38 5,652 6,034 36,169 1.07 1,246 Sandman 27 – – – 18,550 0.73 433 433 3,246 0.58 61 Robinson 28 317,942 0.18 1,840 40,173 0.15 194 2,072 11,942 0.18 69 Gold - Canada Detour Lake 1,29 106,106 1.23 4,189 1,039,244 0.77 25,563 29,752 52,370 0.71 1,196 Sudbury 30 not available not available – not available Hemlo 31 680 4.50 99 38,000 2.03 2,500 2,600 9,100 2.80 820 Brucejack 32 4,300 8.00 1,100 18,100 10.70 6,200 7,200 9,400 10.30 3,100 Kirkland Lake 1,33 489 15.71 247 18,538 6.19 3,687 3,934 25,886 4.54 3,781 Dublin Gulch (Eagle) 34 37,400 0.71 850 180,000 0.61 3,547 4,397 21,500 0.52 361 Musselwhite 1,35 4,200 4.59 620 9,000 5.46 1,580 2,200 3,200 4.22 440 Timmins W est 1,36 1,770 3.13 178 5,139 3.01 497 675 174 4.36 24 Canadian Malartic 1,37 43,192 0.84 1,166 73,812 1.71 4,050 5,214 67,230 2.89 6,236 Island Gold 1,38 854 9.21 253 4,354 9.79 1,371 1,624 7,906 13.59 3,454 Golden Highway - Holt Comple x 1,39 5,806 4.29 800 5,884 4.75 898 1,699 9,097 4.48 1,310 Golden Highway - Hislop 1,40 – – – 1,337 4.00 173 173 804 3.80 97 Golden Highway - Aquarius 1,41 – – – 23,112 1.49 1,106 1,106 502 0.87 14 Gr eenstone (Hardrock) 42 5,700 1.30 237 141,800 1.51 6,868 7,105 25,500 3.78 3,095 V alentine Lake 43 32,587 1.83 1,920 24,069 1.57 1,218 3,138 29,585 1.72 1,639 Eskay Cr eek 44 17,657 4.19 2,380 20,848 2.26 1,518 3,898 5,668 1.27 231
FRANCO-NEVADA CORPORATION 131 THE GOLD INVESTMENT THAT WORKS RESERVES AND RESOURCES ADDITIONAL INFORMATION Reserves and Resources Gold Mineral Resources Inclusive of Reserves Measur ed (M) Indicated (I) (M)+(I) Inferr ed T onnes Gr ade Contained T onnes Gr ade Contained Contained T onnage Gr ade Contained Notes 000s g/t 000 o z 000s g/t 000 o z 000 o z 000s g/t 000 o z Gold - Canada (continued) Red Lake (Bateman) 1,45 775 6.12 153 4,498 6.03 873 1,025 1,562 6.83 343 Cour ageous Lake 46 13,401 2.53 1,090 93,914 2.28 6,884 7,974 53,587 2.27 3,914 Goldfields 47 – – – 22,600 1.34 975 975 6,000 0.92 176 Monument Bay 1,48 – – – 36,581 1.52 1,787 1,787 41,946 1.32 1,781 Red Mountain 49 1,920 8.81 544 1,271 5.85 239 783 405 5.32 69 Fenelon-Martiniere 50 – – – 43,558 1.91 2,671 2,671 31,778 1.69 1,724 Gold - Australia Duketon 51 19,000 0.82 500 113,000 0.95 3,450 3,950 16,000 1.19 610 Matilda (Wiluna) 52 1,430 1.24 57 57,100 1.91 3,495 3,552 19,900 3.09 1,978 South Kalgoorlie 53 1,120 6.19 223 2,876 5.25 485 708 2,058 4.46 295 Y andal (Bronzewing) 54 2,800 2.60 237 17,116 1.90 1,045 1,282 5,310 1.50 263 Aphr odite 55 – – – 17,614 2.10 1,163 1,163 7,892 2.00 500 Red October 56 105 8.40 28 519 5.60 93 122 4,392 3.44 485 Henty 57 – – – 1,800 4.50 257 257 700 4.30 100 Bullabulling 58 – – – 68,805 0.99 2,190 2,190 26,595 1.19 1,020 Edna May 59 600 0.50 9 23,290 1.03 770 779 7,036 1.04 236 Glenbur gh 60 – – – 13,500 1.00 431 431 2,800 0.90 79 Gold - Rest of World MWS 61 82,900 0.22 588 164,900 0.26 1,358 1,946 – – – Sabodala-Massawa Comple x 62 19,400 1.38 862 82,700 2.17 5,778 6,640 24,300 2.21 1,728 Tasiast 1,63 57,029 1.22 2,240 125,228 1.68 6,752 8,992 12,678 2.40 971 Subika (Ahafo) 1,64 50,000 1.79 2,870 99,000 2.04 6,480 9,350 24,300 2.21 1,730 Karma 65 300 0.40 4 47,700 1.24 1,894 1,898 16,200 1.30 679 Edikan 66 24,800 1.01 803 46,100 1.03 1,522 2,326 5,600 1.60 300 Kiziltepe 67 600 3.01 58 698 2.33 52 110 1,180 2.09 79 Seguela 68 – – – 14,000 3.00 1,328 1,328 1,500 2.20 104 Per ama Hill 69 3,093 4.15 412 10,973 2.73 962 1,374 16,006 1.53 787 Aği Daği 1,70 2,516 0.74 60 104,453 0.63 2,132 2,192 19,551 0.52 330 Sissingue 71 4,400 1.46 206 1,200 2.18 84 290 130 1.67 7 TOTAL GOLD MINERAL RESOURCES 68,338 195,982 263,123 70,915
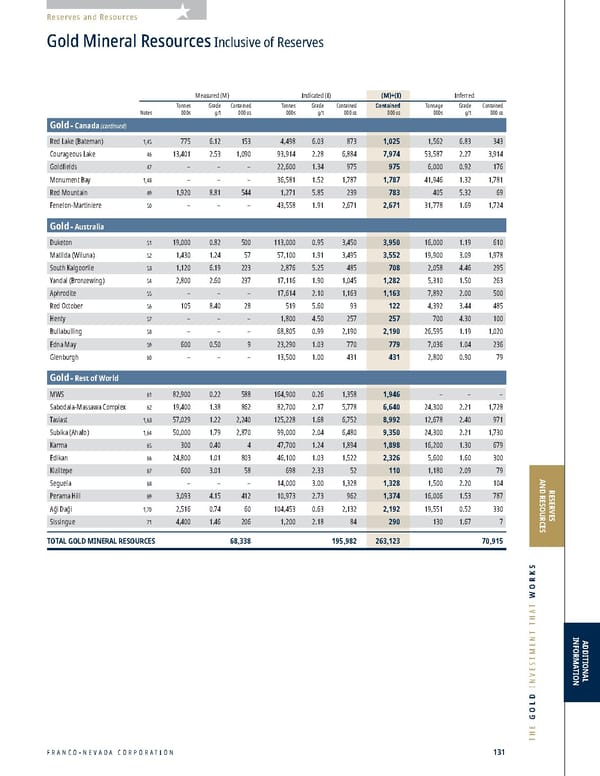
2022 ASSET HANDBOOK 132 FNV TSX NYSE Reserves and Resources RESERVES AND RESOURCES Mineral Reserves and Resources Silver Silver Silver Mineral Reserves Pr oven Pr obable Proven & Probable T onnes Gr ade Contained T onnes Gr ade Contained Tonnes Gr ade Contained Notes 000s g/t 000 o z 000s g/t 000 o z 000s g/t 000 o z Candelaria 72,4 540,929 1.73 30,000 134,645 2.08 9,000 675,574 1.80 39,000 Antapaccay 73 189,000 1.19 7,231 286,000 1.13 10,390 475,000 1.15 17,621 Antamina 74,75 186,000 8.80 52,701 149,800 11.20 54,011 335,800 9.90 106,969 Condestable 76 20,546 5.66 3,739 7,376 6.37 1,510 27,922 5.85 5,249 Cerr o Moro 77 365 593.50 6,964 1,384 342.00 15,215 1,749 394.50 22,180 Salar es Norte 78 – – – 21,079 57.94 39,263 21,079 57.94 39,263 Cascabel 79 – – – – – – – – – Calcatr eu 80 – – – – – – – – – Cobr e Panama 81 236,000 1.44 10,926 2,790,500 1.36 121,758 3,026,600 1.37 133,049 Fir e Creek/Midas 2,82 – – – – – – – – – Eskay Cr eek 83 13,500 124.00 53,700 12,900 64.00 26,500 26,400 94.00 80,200 TOTAL SILVER MINERAL RESERVES 165,262 277,647 443,532 Silver Miner al Resources - Inclusive of Reserves Measur ed (M) Indicated (I) (M)+(I) Silver Inferred Mineral Resources T onnes Gr ade Contained T onnes Gr ade Contained Contained T onnage Gr ade Contained Notes 000s g/t 000 o z 000s g/t 000 o z 000 o z 000s g/t 000 o z Candelaria 72,4 874,003 1.99 56,000 370,541 2.27 27,000 83,000 99,029 2.20 7,000 Antapaccay 73 266,000 1.57 13,441 1,009,000 1.76 57,150 70,591 238,000 0.81 6,168 Antamina 1,74,75 306,500 9.77 96,264 618,800 11.48 228,384 324,905 1,260,600 11.00 447,741 Condestable 76 33,392 5.88 6,315 55,934 6.29 11,308 17,624 60,600 6.29 12,256 Cerr o Moro 1,77 542 475.85 8,292 2,144 315.11 21,721 30,014 1,488 170.60 8,159 Salar es Norte 78 – – – 23,714 56.29 42,915 42,915 1,842 12.61 747 Cascabel 79 1,192,000 1.37 52,400 1,470,000 0.84 39,800 92,200 554,000 0.61 10,600 Calcatr eu 80 – – – 9,841 19.83 6,275 6,275 8,078 13.09 3,399 Cobr e Panama 81 234,800 1.50 11,323 3,318,700 1.33 141,573 152,896 1,093,800 1.08 38,085 Fir e Creek/Midas 1,2,82 20 43.64 28 171 98.68 544 572 69,473 5.98 13,349 Eskay Cr eek 83 17,657 117.42 66,655 20,848 52.14 34,945 101,600 5,668 27.38 4,990 TOTAL SILVER MINERAL RESOURCES 310,719 611,615 922,592 552,494
FRANCO-NEVADA CORPORATION 133 THE GOLD INVESTMENT THAT WORKS RESERVES AND RESOURCES ADDITIONAL INFORMATION Reserves and Resources Mineral Reserves and Resources Copper PGM PGM PGM Mineral Reserves Pr oven Pr obable Proven & Probable T onnes Gr ade Contained T onnes Gr ade Contained Tonnes Gr ade Contained Notes 000s g/t 000 o z 000s g/t 000 o z 000s g/t 000 o z Stillwater 84 8,200 15.40 4,100 60,100 12.00 23,200 68,300 12.40 27,300 Sudbury 85 not available not available not available Eagle ’s Nest 86 5,264 4.65 787 5,867 3.72 702 11,131 4.16 1,489 Mar athon (Sally) 87 – – – – – – – – – Pandor a 88 2,195 4.20 244 19,756 4.08 2,683 21,951 4.09 2,927 T OTAL PGM MINERAL RESERVES 5,131 26,585 31,716 PGM Miner al Resources - Inclusive of Reserves Measur ed (M) Indicated (I) (M)+(I) PGM Inferred Mineral Resources T onnes Gr ade Contained T onnes Gr ade Contained Contained T onnage Gr ade Contained Notes 000s g/t 000 o z 000s g/t 000 o z 000 o z 000s g/t 000 o z Stillwater 84 39,900 14.70 18,900 59,100 13.80 26,100 45,000 113,600 12.20 44,600 Sudbury 85 not available not available not available Eagle ’s Nest 86 5,346 4.79 823 5,643 4.41 800 1,627 10,581 4.29 1,459 Mar athon (Sally) 87 – – – 24,801 0.62 494 494 14,019 0.48 218 Pandor a 88 22,195 4.81 3,415 147,317 4.60 21,707 25,122 21,220 4.72 3,171 TOTAL PGM MINERAL RESOURCES 23,138 49,101 72,243 49,447 Copper Mineral Reserves Pr oven Pr obable Proven & Probable T onnes Gr ade Contained T onnes Gr ade Contained Tonnes Gr ade Contained Notes 000s % Mlbs 000s % Mlbs 000s % Mlbs Sossego 89 59,200 0.89 1,162 39,100 0.40 345 98,300 0.69 1,495 Cascabel 90 – – – – – – – – – Nue vaUnion (Relincho) 91 576,400 0.34 4,320 977,400 0.36 7,757 1,553,800 0.35 12,078 T aca Taca 92 408,300 0.59 5,295 1,350,200 0.39 11,757 1,758,500 0.44 17,052 Vizcachitas 93 – – – – – – – – – Rosemont/Copper W orld 94 426,100 0.48 4,509 111,000 0.31 759 537,100 0.45 5,328 Robinson 95 110,513 0.42 1,023 8,860 0.28 55 119,374 0.41 1,078 TOTAL COPPER MINERAL RESERVES 16,309 20,673 37,031 Copper Miner al Resources - Inclusive of Reserves Measur ed (M) Indicated (I) (M)+(I) Copper Inferred Mineral Resources T onnes Gr ade Contained T onnes Gr ade Contained Contained T onnage Gr ade Contained Notes 000s % Mlbs 000s % Mlbs Mlbs 000s % Mlbs Sossego 89 n/a n/a n/a n/a n/a n/a n/a n/a n/a n/a Cascabel 90 1,192,000 0.48 12,566 1,703,000 0.28 10,428 22,994 751,000 0.24 4,012 Nue vaUnion (Relincho) 1,91 895,400 0.29 5,657 1,440,400 0.33 10,411 16,068 724,700 0.36 5,752 T aca Taca 92 421,500 0.60 5,606 1,781,800 0.39 15,229 20,835 716,900 0.31 4,863 Vizcachitas 93 254,400 0.44 2,462 1,029,670 0.39 8,740 11,202 788,820 0.34 5,861 Rosemont/Copper W orld 1,94 587,400 0.45 5,860 757,900 0.30 4,984 10,915 204,300 0.34 1,539 Robinson 95 317,942 0.47 3,294 40,173 0.34 301 3,553 11,942 0.38 100 TOTAL COPPER MINERAL RESOURCES 35,446 50,093 85,567 22,127 Copper
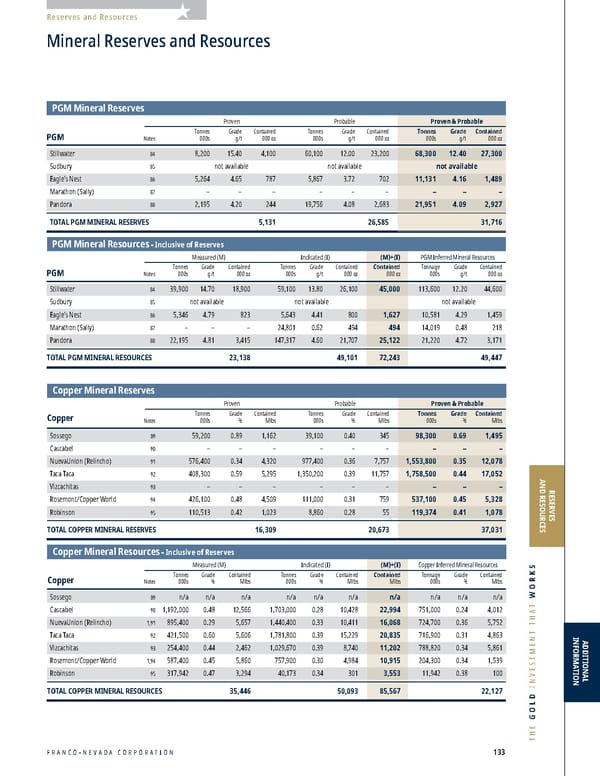
2022 ASSET HANDBOOK 134 FNV TSX NYSE Reserves and Resources RESERVES AND RESOURCES Mineral Reserves and Resources Nickel Nickel Nickel Mineral Reserves Pr oven Pr obable Proven & Probable T onnes Gr ade Contained T onnes Gr ade Contained Tonnes Gr ade Contained Notes 000s % M lbs 000s % Mlbs 000s % Mlbs Falcondo 96 44,900 1.28 1,267 26,300 1.36 789 71,200 1.31 2,056 Eagle ’s Nest 97 5,264 2.02 234 5,867 1.38 178 11,131 1.68 413 Cr awford 98 – – – – – – – – – Mt Keith 99 67,600 0.57 847 19,990 0.55 240 87,600 0.56 1,087 TOTAL NICKEL MINERAL RESERVES 2,348 1,207 3,556 Nickel Miner al Resources - Inclusive of Reserves Measur ed (M) Indicated (I) (M)+(I) Nickel Inferred Mineral Resources T onnes Gr ade Contained T onnes Gr ade Contained Contained T onnage Gr ade Contained Notes 000s % Mlbs 000s % Mlbs Mlbs 000s % Mlbs Falcondo 96 40,500 1.42 1,268 31,100 1.53 1,049 2,320 4,900 1.40 151 Eagle ’s Nest 97 5,346 2.08 245 5,643 1.50 187 432 10,581 0.98 228 Cr awford 98 240,000 0.29 1,509 413,600 0.24 2,216 3,725 497,200 0.24 2,610 Mt Keith 99 136,600 0.54 1,622 67,000 0.52 768 2,390 24,000 0.52 275 TOTAL NICKEL MINERAL RESOURCES 4,645 4,219 8,868 3,265 Chromite Iron Ore Iron Ore Chr omite Mineral Resources - Inclusive of Reserves Measur ed (M) Indicated (I) Chromite Inferred Mineral Resources Tonnes Gr ade Tonnes Gr ade Tonnage Gr ade Notes 000s % Cr2O3 000s % Cr2O3 000s % Cr2O3 Ring of Fir e 100 140,190 32.5 52,570 29.8 54,580 30.8 TOTAL CHROMITE MINERAL RESOURCES 140,190 52,570 54,580 Ir on Ore Mineral Reserves Pr oven Pr obable Proven & Probable T onnes Gr ade T onnes Gr ade Tonnage Grade Notes 000s % Fe 000s % Fe 000s % Fe V ale (Northern & Southeastern System) 101 4,288,500 56.7 6,484,700 58.9 10,773,200 58.0 LIORC 102,103 696,000 39.0 448,000 38.0 1,144,000 38.0 TOTAL IRON ORE MINERAL RESERVES 4,984,500 6,932,700 11,917,200 Ir on Ore Mineral Resources - Inclusive of Reserves Measur ed (M) Indicated (I) Iron Ore Inferred Mineral Resources Tonnes Gr ade Tonnes Gr ade Tonnage Gr ade Notes 000s % Fe 000s % Fe 000s % Fe V ale (Northern & Southeastern System) 101 not available not available not available LIORC 1,102,103 854,000 39.4 1,076,000 38.6 895,000 38.0 TOTAL IRON ORE MINERAL RESOURCES 854,000 1,076,000 895,000
FRANCO-NEVADA CORPORATION 135 THE GOLD INVESTMENT THAT WORKS RESERVES AND RESOURCES ADDITIONAL INFORMATION Reserves and Resources Notes and Sources • All Miner al Reserves and Resources have been calculated in accordance with CIM or acceptable foreign codes for the purposes of NI 43-101, including S-K 1300, SEC Industry Guide 7, JORC, or SAMREC guidelines • Miner al Resources which are not Mineral Reserves do not have demonstrated economic viability • Unless otherwise noted, Miner al Resources were reported by the operator inclusive of Mineral Reserves • Contained metal does not take into account recovery losses • Fr anco-Nevada’s royalties or stream interests may not cover the operator’s entire property or all estimated Mineral Reserves and Resources or a combination of both • Miner al Reserve estimates reported by Vale S.A. have been prepared and reported in accordance with SEC Industry Guide 7 and as such no Mineral Resources are reported • The gr ade of platinum group elements has been reported by the operators as either the sum of the individual platinum group elements grades or the individual grades. In the cases where individual platinum group element grades have been reported, the Company’s Qualified Person has calculated the sum of the platinum group element grades for presentation purposes • Miner al Reserves and Resources based on publicly disclosed information available as of March 11, 2022 • Ro ws and columns may not add up due to rounding • Inferr ed Resources are in addition to Measured and Indicated Resources. See “Cautionary Note to US Investors Regarding Reserve and Resource Reporting Standards” 1 Miner al Resources reported by operator exclusive of Mineral Reserves. The Company's QP determined the inclusive Mineral Resources by adding the exclusive Measured and Indicated Mineral Resources to the Proven and Probable Reserves 2 Miner al Reserves and Resources are reported by the operator in non-metric units. The Company's QP calculated the metric conversion using 1 opt = 34.286 g/t, 1 short ton = 0.9018 metric tonnes, 1 oz = 31.1035 g 3 Lundin Mining Corpor ation; Company Press Release, September 13, 2021 4 The str eam agreement applies to 100% of the property, but only with respect to the ownership interest of Lundin Mining Corporation which indirectly owns 80% of the Candelaria Copper Mining Complex 5 Glencor e; Resources & Reserves as at December 31, 2021 6 Southern Peaks Mining LP; Miner al Reserves: Feasibility Study Condestable Mine, October 15, 2021. Mineral Resources: Letter to Franco-Nevada (Barbados) Corporation, February 4, 2022, containing global, in situ, resource estimate 7 V ale S.A., Form 20-F as filed with the Securities and Exchange Commission on March 23, 2021 8 Y amana Gold Inc.; News Release, February 8, 2022 9 Gold Fields Limited; Miner al Resources and Mineral Reserves Supplement to the Integrated Annual Report 2020 10 SolGold Plc; Annual Report 2021 & Ne ws Release, October 19, 2021 11 Hochschild Mining Plc; Ne ws Release, November 30, 2021 12 First Quantum Miner als Ltd.; News Release, November 30, 2020 13 O Z Minerals Ltd.; Mineral Resource Estimate and Ore Reserve Statement as at May 6, 2019 and June 24, 2019 14 Patagonia Gold Corp.; Investor Pr esentation, November 2021 15 Cor o Mining Corp.; NI 43-101 Technical Report, Preliminary Feasibility Study, San Jorge 25kt/y Copper Leach Project, March 2012 16 Hochschild Mining Plc; Corpor ate Website, February 10, 2022 17 First Quantum Miner als Ltd.; Annual Information Form, March 29, 2021 18 Coeur Mining, Inc.; Ne ws Release, February 16, 2022 19 Barrick Gold Corpor ation; Press Release, February 10, 2022. Carlin Trend includes Goldstrike, Gold Quarry and South Arturo as well as other properties where Franco-Nevada has no royalties or stream interests 20 SSR Mining Inc.; T echnical Report, February 2022 21 Kinr oss Gold Corporation; News Release, February 16, 2022 22 Equino x Gold Corp.; Mineral Reserves and Mineral Resources, September 20, 2021 23 Equino x Gold Corp.; Mineral Reserves and Mineral Resources, September 20, 2021 24 Hecla Mining Company; Company Pr ess Release, February 17, 2022 25 Hecla Mining Company; Company Pr ess Release, February 17, 2022 26 Midas Gold Corp. (no w Perpetua Resources Idaho, Inc.); NI 43-101 Feasibility Study Technical Report, December 22, 2020 27 Gold Bull Resour ces Corp.; News Release, February 2, 2021 28 K GHM; Mineral Resources and Reserves Report, December 31, 2014 29 Agnico Eagle Mines Ltd.; Miner al Reserves and Mineral Resources as of December 31, 2021 30 K GHM does not provide updated Mineral Reserve and Mineral Resource estimates. As such, Franco-Nevada has chosen not to display the historical figure moving forward 31 Barrick Gold Corpor ation; Press Release, February 10, 2022 32 Pr etium Resources Inc.; 2021 Brucejack Mine Mineral Reserves and Mineral Resources 33 Agnico Eagle Mines Ltd.; Miner al Reserves and Mineral Resources as of December 31, 2021 34 Victoria Gold Corp.; Corpor ate Website, January 2022 35 Ne wmont Corporation; News Release, February 24, 2022 36 Pan American Silver Corp.; NI 43-101 T echnical Report, June 30, 2021 37 Y amana Gold Inc.; News Release, February 8, 2022 38 Alamos Gold Inc.; Pr ess Release, February 22, 2022 39 Agnico Eagle Mines Ltd.; Miner al Reserves and Mineral Resources as of December 31, 2021 40 Agnico Eagle Mines Ltd.; Miner al Reserves and Mineral Resources as of December 31, 2021 41 Agnico Eagle Mines Ltd.; Miner al Reserves and Mineral Resources as of December 31, 2021 42 Equino x Gold Corp.; Mineral Reserves and Mineral Resources, September 20, 2021 43 Mar athon Gold Corporation; NI 43-101 Technical Report & Feasibility Study, April 15, 2021 44 Skeena Resour ces Ltd.; NI 43-101 Technical Report and Prefeasibility Study, July 22, 2021 45 Evolution Mining Limited; ASX Announcement, 20 May 2021, NI 43-101 Technical Report, January 27, 2021 prepared for Battle North Gold Corp. 46 Seabridge Gold Inc.; Miner al Reserves and Resources, December 2020 47 Fortune Bay Corp.; T echnical Report: Resource Estimate for the Goldfields Project, May 4, 2021 48 Y amana Gold Inc.; News Release, February 8, 2022 49 Ascot Resour ces Ltd.; Premier & Red Mountain Gold Project Feasibility Study NI 43-101 Technical Report, April 15, 2020 Continued on next page
2022 ASSET HANDBOOK 136 FNV TSX NYSE RESERVES AND RESOURCES Reserves and Resources Continued from page 135 50 W allbridge Mining Company Limited; NI 43-101 Technical Report, December 23, 2021 51 Regis Resour ces Limited; ASX Announcement, June 15, 2021 52 Wiluna Mining Corpor ation Limited; ASX Announcements, March 16, 2021 & November 17, 2021 53 Northern Star Resour ces Limited; ASX Announcement, May 3, 2021 54 Northern Star Resour ces Limited; ASX Announcement, May 3, 2021 55 Bar doc Gold Ltd.; December 2021 Quarterly Activities Report 56 Matsa Resour ces Ltd.; ASX Announcement, September 2, 2021 & AngloGold Ashanti Limited; Mineral Resource and Ore Reserve Report as at December 31, 2020 57 Catalyst Metals Limited; ASX Announcement, October 5, 2021 58 Norton Gold Fields Limited; Corpor ate Website, February 1, 2022 59 Ramelius Resour ces Limited; ASX Release, September 10, 2021 60 Gasco yne Resources Limited; Corporate Presentation, January 20, 2022 61 Harmony Gold Mining Company Limited; Miner al Resources and Mineral Reserves Report 2021 62 Endeavour Mining Corp.; Annual Information Form, March 31, 2021 63 Kinr oss Gold Corporation; News Release, February 16, 2022 64 Ne wmont Corporation; News Release, February 24, 2022 65 Endeavour Mining Corp.; Annual Information Form, March 31, 2021 66 Perseus Mining Ltd.; Company Pr ess Release, August 24, 2021 67 Ariana Resour ces PLC; Press Release, February 1, 2022 68 Fortuna Silver Mines Inc.; NI 43-101 T echnical Report, Seguela Project Feasibility Study (Prepared for Roxgold), May 26, 2021 69 Eldor ado Gold Corp.; News Release, December 15, 2021 70 Alamos Gold Inc.; Pr ess Release, February 22, 2022 71 Perseus Mining Ltd.; Company Pr ess Release, August 24, 2021 72 Lundin Mining Corpor ation; Company Press Release, September 13, 2021 73 Glencor e; Resources & Reserves as at December 31, 2021 74 T eck Resources Limited; Annual Information Form, February 23, 2022 75 The str eam agreement applies to 100% of the property, but only with respect to the ownership interest of Teck Resources Limited which indirectly owns a 22.5% interest in Compañía Minera Antamina S.A. 76 Southern Peaks Mining LP; Miner al Reserves: Feasibility Study Condestable Mine, October 15, 2021. Mineral Resources: Letter to Franco-Nevada (Barbados) Corporation, February 4, 2022, containing global, in situ, resource estimate 77 Y amana Gold Inc.; News Release, February 8, 2022 78 Gold Fields Limited; Miner al Resources and Mineral Reserves Supplement to the Integrated Annual Report 2020 79 SolGold Plc; Annual Report 2021 80 Patagonia Gold Corp.; Investor Pr esentation, November 2021 81 First Quantum Miner als Ltd.; Annual Information Form, March 29, 2021 82 Hecla Mining Company; Company Pr ess Release, February 17, 2022 83 Skeena Resour ces Ltd.; NI 43-101 Technical Report and Prefeasibility Study, July 22, 2021 84 Sibanye-Stillwater; Market Release, Mar ch 2, 2022 85 K GHM does not provide updated Mineral Reserve and Mineral Resource estimates. As such, Franco-Nevada has chosen not to display the historical figure moving forward 86 Nor ont Resources Ltd.; NI 43-101 Technical Report Feasibility Study, September 4, 2012 87 Gener ation Mining Limited; Corporate Presentation, January 2022 88 Lonmin Plc; Miner al Resource and Mineral Reserve Statement 2017 89 V ale S.A., Form 20-F as filed with the Securities and Exchange Commission on March 23, 2021 90 SolGold Plc; Annual Report 2021 & Ne ws Release, October 19, 2021 91 T eck Resources Limited; Annual Information Form, February 23, 2022 92 First Quantum Miner als Ltd.; News Release, November 30, 2020 93 Los Andes Copper Ltd.; Corpor ate Presentation, January 17, 2022 94 Hudbay Miner als Inc.; Investor Presentation, February 2022 95 K GHM; Mineral Resources and Reserves Report, December 31, 2014 96 Glencor e; Resources & Reserves as at December 31, 2014 97 Nor ont Resources Ltd.; NI 43-101 Technical Report Feasibility Study, September 4, 2012 98 Canada Nickel Company Inc.; Corpor ate Presentation, February 2022 99 BHP Gr oup Limited; Annual Report 2021 100 Nor ont Resources Ltd.; Corporate Website, March 7, 2022 101 V ale S.A., Form 20-F as filed with the Securities and Exchange Commission on March 23, 2021 102 Labr ador Iron Ore Royalty Corporation; Annual Information Form, March 11, 2022 103 Fr anco-Nevada holds a 9.9% equity interest in Labrador Iron Ore Royalty Corporation (“LIORC”). LIORC, directly and through its wholly-owned subsidiary, owns a 15.1% equity interest in Iron Ore Company of Canada and receives a 7% gross overriding royalty on the operation and also receives a C$0.10/t commission on sales of iron ore
FRANCO-NEVADA CORPORATION 137 Additional Information 138 Asset Counts, Acreage of Assets 140 Mine Life Index 142 Board of Directors, Executive Management, Corporate Organization 146 Glossary 148 Non-GAAP Financial Measures 150 Technical and Third Party Information, Forward Looking Information ADDITIONAL INFORMATION
ASSET COUNTS Additional Information 138 FNV TSX NYSE ADDITIONAL INFORMATION 2022 ASSET HANDBOOK Franco-Nevada’s assets are categorized by commodity and stage of development. By commodity, assets are characterized as “Precious Metals” or “Diversified”. “Precious Metals” includes gold, silver and PGM assets. “Diversified” includes iron ore, other mining and energy assets (which encompass oil, gas and natural gas liquids). “Producing” assets are those that have generated revenue from steady-state operations for Franco-Nevada or are expected to in the next year. “Advanced” assets are interests on projects which are not yet producing, but where in management’s view, the technical feasibility and commercial viability of extracting a mineral resource are demonstrable. “Exploration” assets represent interests on projects where technical feasibility and commercial viability of extracting a mineral resource are not demonstrable. Management uses the following criteria in its assessment of technical feasibility and commercial viability: (i) Geology: ther e is a known mineral deposit which contains mineral reserves or resources; or the project is adjacent to a mineral deposit that is already being mined or developed and there is sufficient geologic certainty of converting the deposit into mineral reserves or resources. (ii) Accessibility and authorization: ther e are no significant unresolved issues impacting the accessibility and authorization to develop or mine the mineral deposit, and social, environmental and governmental permits and approvals to develop or mine the mineral deposit appear obtainable. For accounting purposes, the number of assets has been counted in different manners depending on the category. Royalties on a producing or advanced property are generally counted as a single asset even if Franco-Nevada has multiple different royalties on the property, such as at the Goldstrike complex. Streams covering a group of mines in close proximity and operated by a common operator such as the Sudbury streams have also been counted as one asset. However, royalties and streams on producing properties that have significant co-products have been counted twice, such as the Robinson royalties for gold and copper or the Sudbury streams for gold and PGM. Exploration royalties are simply counted by the number of royalty contracts and no effort has been made to consolidate royalties on the same property. Franco-Nevada’s energy interests are subdivided into Producing Assets, which are assets that are currently producing oil or natural gas, or Exploration Assets, which are undeveloped assets that are not producing oil or natural gas. Franco-Nevada’s energy interests consist of a variety of working interests and royalty interests which are derived from a large number of underlying leases, contractual agreements and mineral title covering land positions primarily in western Canada and Oklahoma, Pennsylvania and Texas in the United States. For accounting purposes, these leases, contracts and mineral title have been grouped into distinct land areas and tabulated as individual assets. In many cases, Franco-Nevada owns multiple royalties or working interests that pertain to the same land area, and in these circumstances, the interests are counted as a single asset. As of April 8, 2022, Franco-Nevada estimates that it holds 221 precious metals assets and 183 diversified assets for a total of 404 assets. Franco-Nevada Asset Counts at April 8, 2022 Precious Metals Diversified T OTAL Pr oducing 45 67 1 112 Advanced 35 7 42 Explor ation 141 109 2 250 T OTAL 221 183 404 1 12 Mining Assets/55 Ener gy Assets. 2 82 Mining Assets/27 Ener gy Assets.
FRANCO-NEVADA CORPORATION 139 ADDITIONAL INFORMATION THE GOLD INVESTMENT THAT WORKS Additional Information ACREAGE OF ASSETS The following is a tabulation of the acreage of Precious Metals and Diversified lands subject to Franco-Nevada’s royalty, stream or other interests as at April 8, 2022. Acreage amounts are approximate or estimated and are compiled from information contained in asset agreements and updated when possible using various sources including government recording offices, operator information such as technical reports, presentations and other sources. Acreage has been converted into standard measure by Franco-Nevada. Franco-Nevada Acreage Tabulation (1) Producing Advanced Explor ation T OTAL Pr ecious Metals South America 471,393 359,441 346,136 1,176,970 Centr al America & Mexico 63,763 – 675 64,438 United States 105,561 73,919 141,668 321,148 Canada 123,347 257,972 544,013 925,332 Austr alia 1,283,285 295,750 691,369 2,270,404 Rest of W orld 1,676,132 108,965 52,863 1,837,960 Total 3,723,481 1,096,047 1,776,724 6,596,252 Diversified - Ir on Ore & Other Mining South America 767,069 54,516 3,096,230 3,917,815 Centr al America & Mexico 6,605 59,552 – 66,157 United States 29,234 14,900 12,540 56,674 Canada 44,973 494 354,994 400,461 Austr alia 169,406 51,445 964,565 1,185,416 Rest of W orld – – 265,842 265,842 Total 1,017,287 180,907 4,694,171 5,892,365 Diversified - Ener gy (2) United States 2,080,799 – 53,994 2,134,793 Canada 615,123 – 328,112 943,235 Total 2,695,922 – 382,106 3,078,028 T otal Estimated Acreage 15,566,645 T otal km 2 62,996 (1) Repr esents management’s best available information as at April 8, 2022 (2) Gr oss Acreage
140 FNV TSX NYSE Franco-Nevada’s asset portfolio is comprised of a large variety of properties and operations with a range of projected production profiles. The chart (opposite) provides an estimated mine life index for some of the producing and advanced assets with published Mineral Reserve and Mineral Resource estimates. For each asset, management has estimated a mine life index by dividing the Proven and Probable Mineral Reserves as well as the Measured and Indicated Mineral Resources (inclusive of Mineral Reserves) by management’s best estimate of the average annual forward looking production. Franco-Nevada has not included any Inferred Mineral Resources in the analysis. This metric is to provide investors and analysts with an indication of the potential for the assets in which Franco-Nevada has interests and should not be viewed as a definitive mine life estimate. In an effort to provide a more accurate picture for the mine life index of the overall portfolio, Franco-Nevada has divided its total M&I Royalty Ounces (inclusive of Mineral Reserves) by the midpoint of its 2022 Precious Metal and Diversified Mining production guidance. The average mine life index of the mining portfolio using this methodology is approximately 32 years. We do not have published reserves for our Energy assets and have not included them in this analysis. Nonetheless, our significant producing energy assets in Canada and the U.S. have long lives and are expected to generate revenue to Franco-Nevada for several decades. MINE LIFE INDEX Additional Information ADDITIONAL INFORMATION 2022 ASSET HANDBOOK Antapaccay mill, Peru
FRANCO-NEVADA CORPORATION 141 Additional Information Candelaria Antapaccay Antamina Cerro Moro Salares Norte Cobre Panama Guadalupe-Palmarejo Stillwater Carlin Trend Marigold Bald Mountain Mesquite Castle Mountain Stibnite Gold Detour Lake Hemlo Brucejack Kirkland Lake Dublin Gulch (Eagle) Musselwhite Timmins West Canadian Malartic Island Gold Greenstone (Hardrock) Valentine Lake MWS Sabodala-Massawa Complex Tasiast Subika (Ahafo) Karma Duketon Edikan Vale (Northern & Southeastern System) LIORC Based on P&P 1 Based on M&I 1 (inclusive of P&P) Precious Metals - SOUTH AMERICA Precious Metals - CENTRAL AMERICA & MEXICO 2 Precious Metals - CANADA Precious Metals - REST OF WORLD Precious Metals - UNITED STATES 1 Mineral Reserves and Resources used in the Mine Life Index calculation are based on publicly disclosed information as of March 11, 2022 2 Mineral Reserves and Resources used for Carlin Trend in the Mine Life Index reflect FNV management’s best estimate of Goldstrike, Gold Quarry and South Arturo only 3 Mine life as disclosed by Vale S.A. in its most recent 20-F. In the case of the Northern and Southeastern System, the mine life reflects the mine life for the operating mine with the longest projected exhaustion date in the system/complex as of December 31, 2020 4 Mine life as disclosed by LIORC in its most recent annual report, based on reserves only – 5 10 15 20 YEARS Diversified 4 3 ADDITIONAL INFORMATION THE GOLD INVESTMENT THAT WORKS
142 FNV TSX NYSE David Har quail David Harquail is Chair of the Board. Mr. Harquail was the founding CEO of the Corporation. Prior to his appointment as Chair in May 2020, Mr. Harquail served as the Corporation’s CEO for more than 13 years since its initial public offering in 2007. He serves as a director of the Bank of Montreal and is a past director and former Chair (2017-2020) of the World Gold Council. He has also held senior executive roles and served as a director of numerous public mining companies and has been actively involved in industry organizations. Mr. Harquail holds a B.A.Sc. in Geological Engineering from the University of Toronto, an MBA from McGill University and is a registered Professional Engineer in Ontario. He is also a major benefactor of the School of Earth Sciences and its Mineral Exploration Research Centre (MERC) at Laurentian University in Sudbury as well as the Centre for Neuromodulation at Sunnybrook Health Sciences in Toronto. In 2021, Mr. Harquail was the recipient of the Association of Mineral Exploration’s Murray Pezim Award for significant contributions to the mineral exploration and mining community by a financier. Paul Brink Paul Brink is President & CEO and a director of Franco-Nevada. Prior to his appointment as CEO, Mr. Brink served as President & Chief Operating Officer of Franco-Nevada from May 2018 to May 2020. He has been with Franco-Nevada since its IPO in 2007 and successfully led its business development activities as SVP, Business Development from 2008 until his promotion to President & Chief Operating Officer in 2018. Mr. Brink is active with a number of not-for-profit organizations. He previously had roles in corporate development at Newmont, investment banking at BMO Nesbitt Burns and project financing at UBS. Mr. Brink holds a Bachelor’s degree in Mechanical Engineering from the University of Witwatersrand and a Master’s degree in Management Studies from Oxford University. T om Albanese Tom Albanese is a director of Franco- Nevada. He served as CEO of Vedanta Resources plc (2014 to 2017), CEO of Vedanta Limited (2014 to 2017) and was CEO of Rio Tinto plc (2007 to 2013). Mr. Albanese is a director of CoTec Holdings Corp. and is the lead independent director of Nevada Copper Corp. He previously served on the boards of Vedanta Resources plc, Vedanta Limited, Rio Tinto plc, Ivanhoe Mines Limited, Palabora Mining Company and Turquoise Hill Resources Limited. Mr. Albanese holds a Master’s of Science degree in Mining Engineering and a Bachelor of Science degree in Mineral Economics both from the University of Alaska Fairbanks. Der ek Evans Derek Evans is President & CEO of MEG Energy Corp. and is a director of Franco- Nevada. He served as President and CEO and a director of Pengrowth Energy Corporation from 2009 until March 15, 2018. Mr. Evans has over 40 years of experience in a variety of operational and senior executive positions in the oil and gas business in Western Canada. Mr. Evans is also active in not-for-profit organizations and is a board member of MaRS (an innovation hub). Mr. Evans holds a Bachelor of Science degree in Mining Engineering from Queen’s University and is a registered Professional Engineer in Alberta. Mr. Evans is also a member of the Institute of Corporate Directors. Dr . Catharine Farrow Catharine Farrow is a director of Franco- Nevada. She is a Registered Professional Geoscientist (PGO) with more than 26 years of mining industry experience. She also serves as a director of Centamin plc, Eldorado Gold Corporation and Aclara Resources Inc. She is also active in the mining industry in both private companies and academia. From 2012 to 2017 she was Founding CEO, Director and Co-Founder of TMAC Resources Inc. Dr. Farrow has served on the Board of a number of not-for-profit and government Advisory Boards. She has been honoured as one of the 100 Global Inspirational Women in Mining (2015 and 2018) and is a past recipient of the William Harvey Gross Medal of the Geological Association of Canada (2000) and the Distinguished Alumni Award from the Acadia Alumni Association (2020). Dr. Farrow obtained her BSc (Hons) from Mount Allison University, her MSc from Acadia University and her PhD from Carleton University. She also holds the ICD.D designation. BOARD OF DIRECTORS Additional Information ADDITIONAL INFORMATION 2022 ASSET HANDBOOK
FRANCO-NEVADA CORPORATION 143 Additional Information Louis Gignac Louis Gignac is Chair of G Mining Ventures Corp. (a public mining exploration and development company) and of G Mining Services Inc. (a private consultancy) and is a director of Franco-Nevada. Mr. Gignac previously served as President, CEO and a director of Cambior Inc., from 1986 to 2006 and previously held management positions with Falconbridge Copper Company and Exxon Minerals Company and has served as a director of several public companies. Mr. Gignac is a member of the Ordre des ingénieurs du Québec. Mr. Gignac holds a Doctorate of Engineering in Mining Engineering from the University of Missouri Rolla, a Master’s degree in Mineral Engineering from the University of Minnesota, and a Bachelor of Science degree in Mining Engineering from Laval University. He also holds the ICD.D designation. Mr. Gignac was inducted into the Canadian Mining Hall of Fame in 2016. Maur een Jensen Maureen Jensen is a director of Franco- Nevada. She served as Chair and Chief Executive Officer of the Ontario Securities Commission (the “OSC”) from 2016 until April 2020 and was previously the Executive Director and Chief Administrative Officer of the OSC from 2011 to 2016. Before joining the OSC, Ms. Jensen was Senior Vice-President, Surveillance and Compliance at the Investment Industry Regulatory Organization of Canada. Ms. Jensen has held senior regulatory and business positions at the Toronto Stock Exchange and had a 20-year career in the mining industry. Ms. Jensen is a director and chair-nominee of Canada’s Ombudsman for Banking Services and Investments and is also active in other not-for-profit organizations including the Toronto Centre for Global Leadership in Financial Supervision, as Chair of The Prosperity Project and as a Public Governor of FINRA in the United States. Ms. Jensen is a Registered Professional Geoscientist (PGO), holds the ICD.D designation, has a BSc, Doctor of Laws (Honoris Causa) and is a member of the Investment Industry Hall of Fame. Jennifer Maki Jennifer Maki is a director of Franco- Nevada. She is also a director of Baytex Energy Corp. and Pan American Silver Corp. She previously served as Chief Executive Officer of Vale Canada and Executive Director of Vale Base Metals (2014 to 2017) and previously held several other positions with Vale Base Metals, including Chief Financial Officer & Executive Vice-President and Vice-President & Treasurer. She has also served on the boards of not-for-profit organizations. Ms. Maki has a Bachelor of Commerce degree from Queen’s University and a postgraduate diploma from the Institute of Chartered Accountants, both in Ontario, Canada. She also holds the ICD.D designation. Randall Oliphant Randall Oliphant is a director of Franco- Nevada. He has worked in natural resources in many capacities for over 30 years. From 1999 to 2003, Mr. Oliphant was the President and Chief Executive Officer of Barrick Gold Corporation and since that time he has served on the boards of numerous public companies and not- for-profit organizations. He served as Executive Chairman of New Gold from 2009 to 2017. Mr. Oliphant presently serves on the advisory board of Metalmark Capital LLC, a leading private equity firm. Mr. Oliphant also served as Chairman of the World Gold Council from 2013 to 2017. Mr. Oliphant is a CPA, CA and was granted the designation of FCPA in 2016 in recognition of his outstanding contribution to his profession. Elliott Pe w Elliott Pew is a director of Franco-Nevada. He has over 40 years of diverse experience in the oil and gas industry. Previously, Mr. Pew served as Board Chair and a Member of the Audit and Risk Committee of Enerplus Corporation, as a director of Southwestern Energy Company, and as co-founder, executive and member of the board of managers of Common Resources I, II and III (private E&P). Prior to that, Mr. Pew held senior executive positions with Newfield Exploration Company in Houston and was Senior Vice President, Exploration of American Exploration Company. He holds an M.A. in Geology from the University of Texas at Austin and an A.B. in Geology from Franklin and Marshall College and is a member of the ICD and NACD. ADDITIONAL INFORMATION THE GOLD INVESTMENT THAT WORKS
144 FNV TSX NYSE ADDITIONAL INFORMATION 2022 ASSET HANDBOOK EXECUTIVE MANAGEMENT Additional Information Paul Brink , President & CEO Paul Brink is President & CEO and a director of Franco-Nevada. Prior to his appointment as CEO, Mr. Brink served as President & Chief Operating Officer of Franco-Nevada from May 2018 to May 2020. He has been with Franco-Nevada since its IPO in 2007 and successfully led its business development activities as SVP, Business Development from 2008 until his promotion to President & Chief Operating Officer in 2018. Mr. Brink is active with a number of not-for-profit organizations. He previously had roles in corporate development at Newmont, investment banking at BMO Nesbitt Burns and project financing at UBS. Mr. Brink holds a Bachelor’s degree in Mechanical Engineering from the University of Witwatersrand and a Master’s degree in Management Studies from Oxford University. Sandip Rana , Chief Financial Officer Sandip Rana, Chief Financial Officer, joined Franco-Nevada in April 2010. He previously served in treasurer and controller roles at old Franco-Nevada until 2002 and then acted as an international controller for Newmont. From 2003 to April 2010, Mr. Rana held financial roles at Four Seasons Hotels Limited where he last served as Vice-President Corporate Finance. Mr. Rana holds a Bachelor of Business Administration degree from the Schulich School of Business and is a Chartered Professional Accountant, CA. In February 2019, Mr. Rana was recognized as a Top Gun CFO by Brendan Wood International. Lloyd Hong , Chief Legal Officer & Corporate Secretary Lloyd Hong, Chief Legal Officer & Corporate Secretary, joined Franco-Nevada in December 2012. He previously was the Senior Vice‐President, Legal Counsel and Assistant Secretary of Uranium One Inc. Prior to that, he was a partner with the Canadian law firm of Davis LLP (now DLA Piper (Canada) LLP) with a practice focused on corporate finance and mergers and acquisitions. Mr. Hong holds a Bachelor of Commerce degree from the University of Alberta and a Bachelor of Laws degree from Queen’s University. Mr. Hong is a member of The Law Society of Ontario and The Law Society of British Columbia (non-practising). Eaun Gray , Senior Vice President, Business Development Eaun Gray, Senior Vice President, Business Development, heads Franco-Nevada’s mining business development group. Mr. Gray was previously a Vice President at Rothschild & Co where he advised on mergers and acquisitions and debt and stream transactions. Prior to that, Mr. Gray worked for CIBC in investment and corporate banking. Mr. Gray completed a Master of Business Administration degree at the Tuck School at Dartmouth College (Edward Tuck Scholar), is a CFA Charterholder and received a Bachelor of Commerce from Queen’s University (First Class Honours). Jason O’Connell , Senior Vice President, Diversified Jason O’Connell, Senior Vice President, Diversified, has been with Franco-Nevada since 2008. His role includes leading business development activities for diversified mining and energy opportunities and managing the company’s Energy portfolio. Mr. O’Connell led the growth of the company’s US Energy portfolio and prior to that held roles in the business development group and managed investor relations. Prior to joining Franco-Nevada, he worked in mining equity research with the Bank of Montreal. Mr. O’Connell holds a Master of Business Administration degree from Dalhousie University and Bachelor of Science degree with honours in Geology from Acadia University.
FRANCO-NEVADA CORPORATION 145 ADDITIONAL INFORMATION THE GOLD INVESTMENT THAT WORKS CORPORATE ORGANIZATION Additional Information Minera Global Copper Chile S.A. Properties in Chile unless noted Exploration: • Volcan 9 Franco-Nevada LRC Holdings Corp. Advanced: • NuevaUnión (Relincho) - Chile • San Jorge - Argentina • Taca Taca - Argentina Exploration: • Vizcachitas - Chile 8 FN Subco Inc. Properties in Ghana unless noted Producing: • Subika 10 Franco-Nevada Delaware LLC Properties in the US unless noted Producing: • SCOOP/STACK (O&G) 12 Franco-Nevada Idaho Corporation Properties in the US unless noted Advanced: • Stibnite Gold 11 Franco-Nevada Australia Pty Ltd. (Australia) Franco-Nevada (Barbados) Corporation (Barbados) Franco-Nevada Canada Holdings Corp. (Canada) Franco-Nevada Corporation (Canada) Franco-Nevada U.S. Corporation (Delaware) Franco-Nevada Delaware LLC (Delaware) 100% 100% 100% 100% 100% Franco-Nevada Corporation Properties in Canada unless noted Producing: • Brucejack • Canadian Malartic • Cerro San Pedro - Mexico • Edikan - Ghana • Golden Highway • Hemlo • Ity - Cote d’ivoire • Kirkland Lake (Macassa) • Kiziltepe - Turkey • Musselwhite • Pandora - South Africa • Sissingue - Cote d’Ivoire • Timmins West Other Advanced & Exploration Oil & Gas Assets 1 Franco-Nevada U.S. Corporation Properties in the US unless noted Producing: • Bald Mountain • EaglePicher • Gold Quarry • Goldstrike • Hollister • Marigold • Mesquite • Robinson • South Arturo • Stillwater Other Advanced & Exploration 2 Franco-Nevada Australia Pty Ltd. Properties in Australia unless noted Producing: • Agnew (Vivien Gold Mine) • Bowen Basin (Moorvale) • Duketon • Flying Fox • Henty • King Vol • Matilda • Matilda (Wiluna) • Mt Keith • Osborne • Red October • South Kalgoorlie (New Celebration) Other Advanced & Exploration 3 Franco-Nevada GLW Holdings Corp. Properties in Canada unless noted Producing: • Fire Creek - US • Midas - US • Sudbury-Levack (Morrison) Other Advanced & Exploration 4 Franco-Nevada Canada Holdings Corp. Properties in Canada unless noted Producing: • Detour • Kirkland Lake • Tasiast - Mauritania 6 Franco-Nevada (Barbados) Corporation Properties in South Africa unless noted Producing: • Antapaccay - Peru • Candelaria - Chile • Guadalupe-Palmarejo - Mexico • Karma - Burkina Faso • MWS • Sabodala - Senegal Advanced: • Cobre Panama - Panama Other Exploration 5 Intermediate holding companies omitted Franco-Nevada Texas LP Properties in the US unless noted Producing: • Midland/Delaware (O&G) 13 FN Holdings ULC Properties in Peru unless noted Producing: • Antamina 7 FN Holdings ULC (Alberta) 100%
2022 ASSET HANDBOOK 146 FNV TSX NYSE “ A$ ” means Australian dollars. “ Adjusted EBITDA and Adjusted EBITDA per share ” are non-IFRS measures, which exclude the following from net income and earnings per share: income tax expense/recovery; finance expenses and finance income; depletion and depreciation; non-cash costs of sales; impairment charges related to royalty, stream and working interests and investments; gains/losses on the sale of royalty, stream and working interests and investments; foreign exchange gains/ losses and other income/expenses; and unusual non-recurring items. For addi - tional information and a reconciliation of these measures to various IFRS measures, refer to the Company’s MD&A. “ Adjusted Net Income ” and “ Adjusted Net Income per share ” are non-IFRS financial measures, which exclude the following from net income and earnings per share: impairment charges related to royalty, stream and working interests and investments; gains/losses on the sale of royalty, stream and working interests and investments; foreign exchange gains/losses and other income/expenses; unusual non-recurring items; and the impact of income taxes on these items. For additional information and a reconciliation of these measures to various IFRS measures, refer to the Company’s MD&A. “ Ag ” means the chemical symbol for the element silver. “ AMR ” means Advanced Minimum Royalty and is rent paid to the royalty holder prior to the payment of royalties on production. Once production begins, the AMR payments are then credited in full against stream of production royalty payments. “ Au ” means the chemical symbol for the element gold. “ bbl ” means barrel. “ Bbls/d ” means barrels per day. “ Bcf ” means billion cubic feet. “ Boe ” mean barrels of oil equivalent. “ Boe/d ” means barrels of oil equivalent per day. “ CAGR ” means Compounded Annual Growth Rate. “ CIM ” means the Canadian Institute of Mining, Metallurgy and Petroleum. “ CIM Definitions ” means the CIM Standards on Mineral Resources and Reserves Definition and Guidelines adopted by CIM Council on May 19, 2014, as amended from time to time. “ concentrate ” is the product of physical concentration process, such as flotation or gravity concentration, which involves separating ore minerals from unwanted waste rock. Concentrates require subsequent processing (such as smelting or leaching) to break down or dissolve the ore minerals and obtain the desired elements, usually metals. “ Cu ” means the chemical symbol for the element copper. “ cut-off grade ” means the lowest grade of Mineral Resource considered economic; used in the calculation of Mineral Reserves and Mineral Resources in a given deposit. “ diamond drill ” is a type of drill in which the rock cutting is done by abrasion, with a diamond impregnated bit, rather than by percussion. The drill cuts a core of rock which is recovered in long cylindrical sections. Syn: “core drill”. “ dip ” is the angle between a horizontal plane and an inclined surface such as a rock formation, fault or vein. “ drift ” is a horizontal passage underground that follows along the length of a vein of rock formation. “ EIS ” means environmental impact statement. “ eq ” or “ Eq ” means equivalent. “ fault ” means a fracture in a rock where there has been displacement of the two sides. “ Fe ” means the chemical symbol for the element iron. “ feasibility study ” means a comprehensive study of a mineral deposit in which all geological, engineering, legal, operation, economic, social, environmental and other relevant factors are considered in sufficient detail that it could reasonably serve as a basis by a financial institution to finance the development of a deposit for mineral production. “ FH ” means Freehold or Lessor Royalty . “ flotation ” is a process by which mineral particles are induced to become attached to bubbles and float, in an ore and water slurry, so that the valuable minerals are concentrated at the slurry surface and separated from the worthless gangue. “ fracture ” means breaks in a rock, usually due to intensive folding or faulting. “ Franco-Nevada ” means Franco- Nevada Corporation and is also referred to as “Franco”, “FNV”, “the Company”, “Corporation”, “management”, “we”, or “our” in this Asset Handbook. “ Freehold ” means an interest in real property. “ g ” represents grams. “ g/t ” means grams per tonne. “ GR ” means Gross Royalty and is a royalty based on all revenues in cash or in-kind products received by the operator for the sale of product. “ grade ” means the concentration of each ore metal in a rock sample, usually given as weight percent. Where extremely low concentrations are involved, the concentration may be given in grams per tonne (g/t) or oz per ton (oz/t). “ Guide 7 ” means the mining industry guide entitled “Description of Property by Issuers Engaged or to be Engaged in Significant Mining Operations” contained in the Securities Act Industry Guides published by the United States Securities and Exchange Commission, as amended. “ ha ” means hectares; 10,000 square metres. “ heap leaching process ” is the process of extracting gold and silver by placing broken ore on an impermeable pad and applying a diluted cyanide solution that dissolves a portion of the contained gold and silver, which are then recovered in metallurgical processes. “ Indicated Resources ” has the meaning ascribed to the term “indicated mineral resource” pursuant to CIM Definitions. “ Inf ” means Inferred. “ Inferred Resources ” has the meaning ascribed to the term “inferred mineral resource” pursuant to CIM Definitions. “ JORC ” means the Australasian Code for Reporting of Mineral Resources and Reserves prepared by the Joint Ore Reserves Committee of the Australasian Institute of Mining and Metallurgy, Australian Institute of Geoscientists and Mineral Council of Australia, as amended. “ kg ” represents kilogram. “ km ” represents kilometre. “ km 2 ” represents square kilometre. “ koz ” means thousand ounces. “ kt ” means thousand tonnes. “ lb ” represents pound. “ LOM ” means life of mine. “ m ” means metres. “ M&I ” means Measured and Indicated. “ Mbbls/mbbls ” means thousand barrels. “ Mboe/mboe ” means thousand barrels of oil equivalent. “ Mcf/mcf ” means thousand cubic feet. “ Measured Resources ” has the meaning ascribed to the term “measured mineral resource” pursuant to CIM Definitions. “ mineralization ” usually implies minerals of value occurring in rocks. “ Mineral Royalties ” means the royalty interests in precious and base metal properties and certain equity interests owned by Franco-Nevada. “ Mlbs ” means millions of pounds. “ MMbbl ” means million barrels of oil. ADDITIONAL INFORMATION GLOSSARY Additional Information
FRANCO-NEVADA CORPORATION 147 THE GOLD INVESTMENT THAT WORKS “ MMcf/mmcf ” means million cubic feet. “ MMcf/d or mmcf/d ” means million cubic feet per day. “ Mo ” means the chemical symbol for the element molybdenum. “ Moz ” means million ounces. “ Mtpa ” means million tonnes per annum. “ NGLs ” means Natural Gas Liquids. “ NI 43-101 ” means National Instrument 43-101 - Standards of Disclosure for Mineral Projects of the Canadian Securities Administrators . “ Ni ” means the chemical symbol for the element nickel. “ NPI ” means Net Profit Interest: the profits after deduction of expenses. “ NPR ” means Net Proceeds Royalties: which is a royalty on the profits after deduction of expenses. “ NRI ” means Net Royalty Interest: paid net of operating and capital costs (similar to an NPI). “ NSR ” means Net Smelter Return: Which is the proceeds returned from the smelter and/or refinery to the mine owner less certain costs. “ Oil & Gas Interests ” means the royalty interests, working interests and oil and natural gas mineral rights in oil and natural gas properties owned by Franco-Nevada. “ open pit ” is a surface working open to daylight, such as a quarry. “ ore ” means a natural aggregate of one or more minerals which may be mined and sold at a profit, or from which some part may be profitably separated. “ ORR ” means Overriding Royalty: A percentage share of production, which is free of all costs of drilling and producing, and is created by the lessee or working interest owner and paid by the lessee or working interest owner. “ oz ” represents ounce (troy). 1 troy ounce = 1.097 avoirdupois ounce. “ oz/ton ” represents troy ounces per short ton. “ P&P ” means Proven and Probable. “ Pb ” means the chemical symbol for the element lead. “ Pd ” means the chemical symbol for the element palladium. “ PFS ” means preliminary feasibility study. “ PGM ” means the platinum group of metals, including but not limited to Palladium, Platinum, Rhodium, Osmium, and Rhenium. “ porphyry ” is an igneous rock of any composition that contains conspicuous, large mineral grains (phenocrysts) in a fine-grained matrix. “ preliminary feasibility study ” means a comprehensive study of the viability of a mineral project that has advanced to a stage where the mining method, in the case of underground mining, or the pit configuration, in the case of an open pit, has been established and an effective method of mineral processing has been determined, and includes a financial analysis based on reasonable assumptions of technical, engineering, legal, operating, economic, social, and environmental factors and the evaluation of other relevant factors which are sufficient for a qualified person, acting reasonably, to determine if all or part of the mineral resource may be classified as a mineral reserve. “ Probable Reserve ” in respect of Mineral Reserves has the meaning ascribed to the term “probable mineral reserve” pursuant to CIM Definitions. “ Proven Reserve ” in respect of Mineral Reserves has the meaning ascribed to the term “proven mineral reserve” pursuant to CIM Definitions. “ Pt ” means the chemical symbol for the element platinum. “ Qualified Person ” for the purposes of NI 43-101, is an individual who is an engineer or geoscientist with at least five years of experience in mineral exploration, mine development or operation or mineral project assessment, or any combination of these; and has experience relevant to the subject matter of the mineral project; and who is a member in good standing of a recognized self-regulatory organization of engineers or geoscientists. “ Reserves ” means collectively, in respect of Mineral Reserves, Probable Reserves and Proven Reserves. “ Resources ” means a concentration or occurrence of diamonds, natural solid inorganic material, or natural solid fossilized organic material including base and precious metals, coal, and industrial minerals in or on the earth’s crust in such form and quantity and of such a grade or quality that it has reasonable prospects for economic extraction. “ Revenue-based Royalties ” are based on the value of the production or net proceeds received by the operator with defined deductions as specified by the royalty contract. Some forms of revenue-based royalties in the mining and energy industries are: “ NSR ” Net Smelter Return Ro yalty “ ORR ” Overriding Ro yalty “ GR ” Gr oss Royalty “ FH ” Fr eehold or Lessor Royalty “ run-of-mine ore ” means mined ore which has not been subjected to any pre-treatment, such as washing, sorting or crushing prior to metallurgical processing. “ SAMREC ” means the South African Code for Reporting of Mineral Resources and Mineral Reserves prepared by the South African Mineral Committee under the auspices of the South African Institute of Mining and Metallurgy, as amended. “ smelting ” is an intermediate stage metallurgical process in which metal is separated from impurities by using thermal or chemical separation techniques. “ stope ” means an excavation in an underground mine from which ore is being or has been extracted. “ Streams ” are metal purchase agreements that allow the holder of the agreement to purchase all or a portion of the gold, silver or other products from a mine in exchange for an upfront payment and an additional payment on each delivery. Streams are not royalties because they are not an interest in land and there is an ongoing cash payment required to purchase the physical metal. “ strike ” means the trend or direction of the intersection of a dipping a layer of rock, fault, vein or other geologic feature with a horizontal surface. “ tailings ” means material rejected after recoverable valuable minerals have been extracted from the ore or concentrate. “ ton ” is 2,000 pounds. Syn: short ton. “ tonne ” means 1,000 kilograms. “ tpa ” means tonnes per annum. “ vein ” means an epigenetic mineral filling of a fault or other fracture, in tabular or sheet-like form, often with associated replacement of the host rock; a mineral deposit of this form and origin. “ waste ” is rock which is not ore and usually has to be removed during the normal course of mining to get at the ore. “ WI ” means Working Interest. Holders of working interests have an ownership position in the property and operation and hence are liable for cash calls on their share of capital, operating and environmental costs usually in proportion to their ownership percentage. Working interests are not considered to be royalties because of their ongoing funding requirements although, for profitable operations, they can be economically similar in their calculations to NPIs. “ Zn ” means the chemical symbol for the element zinc. ADDITIONAL INFORMATION Additional Information
148 FNV TSX NYSE NON-GAAP FINANCIAL MEASURES Additional Information ADDITIONAL INFORMATION 2022 ASSET HANDBOOK Adjusted EBITDA and Adjusted EBITDA per share Adjusted EBITDA and Adjusted EBITDA per share are non-GAAP financial measures, which is defined by Franco-Nevada by excluding the following from net income (loss) and earnings (loss) per share (“EPS”): • Income tax e xpense/recovery; • Finance e xpenses; • Finance income; • Depletion and depr eciation; • Impairment char ges and reversals related to royalty, stream and working interests; • Impairment of investments; • Gains/losses on sale of r oyalty, stream and working interests; • Gains/losses on investments; • For eign exchange gains/losses and other income/expenses; and • Unusual non-r ecurring items. Management uses Adjusted EBITDA and Adjusted EBITDA per share to evaluate the underlying operating performance of Franco- Nevada as a whole for the reporting periods presented, to assist with the planning and forecasting of future operating results, and to supplement information in its financial statements. Management believes that in addition to measures prepared in accordance with IFRS such as Net Income and EPS, our investors and analysts use Adjusted EBITDA and Adjusted EBITDA per share to evaluate the results of the underlying business of Franco-Nevada, particularly since the excluded items are typically not included in our guidance, with the exception of depletion and depreciation expense. While the adjustments to net income and EPS in these measures include items that are both recurring and non-recurring, management believes that Adjusted EBITDA and Adjusted EBITDA per share are useful measures of Franco-Nevada’s performance because they adjust for items which may not relate to or have a disproportionate effect on the period in which they are recognized, impact the comparability of our core operating results from period to period, are not always reflective of the underlying operating performance of our business and/or are not necessarily indicative of future operating results. Adjusted EBITDA and Adjusted EBITDA per share are only intended to provide additional information to investors and analysts and should not be considered in isolation or as a substitute for measures of performance prepared in accordance with IFRS. They do not have any standardized meaning under IFRS and may not be comparable to similar measures presented by other issuers. Reconciliation of Net Income to Adjusted EBITD A: For the year ended December 31, (expressed in millions, except per share amounts) 2021 2020 Net income $ 733.7 $ 326.2 Income tax e xpense 124.1 13.3 Finance e xpenses 3.6 3.5 Finance income (3.7 ) (3.7 ) Depletion and depr eciation 299.6 241.0 Impairment (r eversals) and charges (68.0 ) 262.1 For eign exchange loss (gain) and other (income) expenses 3.0 (2.8 ) Adjusted EBITD A $ 1,092.3 $ 839.6 Basic weighted aver age shares outstanding 191.1 190.3 Basic earnings per shar e $ 3.84 $ 1.71 Income tax e xpense 0.65 0.07 Finance e xpenses 0.02 0.01 Finance income (0.02 ) (0.02 ) Depletion and depr eciation 1.57 1.27 Impairment char ges (0.36 ) 1.38 For eign exchange loss (gain) and other (income) expenses 0.02 (0.01 ) Adjusted EBITD A per share $ 5.72 $ 4.41
FRANCO-NEVADA CORPORATION 149 Additional Information ADDITIONAL INFORMATION THE GOLD INVESTMENT THAT WORKS Adjusted Net Income and Adjusted Net Income per share Adjusted Net Income and Adjusted Net Income per share are non-GAAP financial measures, which is defined by Franco-Nevada by excluding the following from net income (loss) and earnings (loss) per share: • For eign exchange gains/losses and other income/expenses; • Impairment char ges and reversals related to royalty, stream and working interests; • Impairment of investments; • Gains/losses on sale of r oyalty, stream and working interests; • Gains/losses on investments; • Unusual non-r ecurring items; and • Impact of income tax es on these items. Management uses Adjusted Net Income and Adjusted Net Income per share to evaluate the underlying operating performance of Franco-Nevada as a whole for the reporting periods presented, to assist with the planning and forecasting of future operating results, and to supplement information in its financial statements. Management believes that in addition to measures prepared in accordance with IFRS such as Net Income and EPS, our investors and analysts use Adjusted Net Income and Adjusted Net Income per share to evaluate the results of the underlying business of Franco-Nevada, particularly since the excluded items are typically not included in our guidance. While the adjustments to net income and EPS in these measures include items that are both recurring and non- recurring, management believes that Adjusted Net Income and Adjusted Net Income per share are useful measures of Franco-Nevada’s performance because they adjust for items which may not relate to or have a disproportionate effect on the period in which they are recognized, impact the comparability of our core operating results from period to period, are not always reflective of the underlying operating performance of our business and/or are not necessarily indicative of future operating results. Adjusted Net Income and Adjusted Net Income per share are intended to provide additional information to investors and analysts and should not be considered in isolation or as a substitute for measures of performance prepared in accordance with IFRS. They do not have any standardized meaning under IFRS and may not be comparable to similar measures presented by other issuers. Reconciliation of Net Income to Adjusted Net Income: For the year ended December 31, (expressed in millions, except per share amounts) 2021 2020 Net income $ 733.7 $ 326.2 Impairment (r eversals) and charges (68.0 ) 262.1 For eign exchange loss (gain) and other (income) expenses 3.0 (2.8 ) T ax effect of adjustments 17.8 (69.2 ) Other tax r elated adjustments: Recognition of pr eviously unrecognized deferred tax assets (12.9 ) – Adjusted Net Income $ 673.6 $ 516.3 Basic weighted aver age shares outstanding 191.1 190.3 Basic earnings per shar e $ 3.84 $ 1.71 Impairment char ges (0.36 ) 1.38 For eign exchange loss (gain) and other (income) expenses 0.02 (0.01 ) T ax effect of adjustments 0.09 (0.37 ) Other tax r elated adjustments: Recognition of pr eviously unrecognized deferred tax assets (0.07 ) – Adjusted Net Income per shar e $ 3.52 $ 2.71
150 FNV TSX NYSE ADDITIONAL INFORMATION 2022 ASSET HANDBOOK TECHNICAL AND THIRD PARTY INFORMATION Additional Information Philip D. Wilson, Vice President, Technical of Franco-Nevada is the qualified person that approved the scientific or technical information contained in this Asset Handbook related to mineral projects that are material (for purposes of NI 43-101) to Franco-Nevada. Franco-Nevada considers its stream interests in the Antamina project, the Antapaccay project, the Candelaria project and the Cobre Panama project to be its only material mining projects for the purposes of NI 43-101. Franco-Nevada will continue to assess the materiality of its assets as new assets are acquired or move into production. Ex cept where otherwise stated, the disclosure in this Asset Handbook relating to properties and operations on the properties on which Franco-Nevada holds royalty, stream or other interests is based on information publicly disclosed by the owners or operators of these properties and information/data available in the public domain as at March 11, 2022 (except where stated otherwise), and none of this information has been independently verified by Franco-Nevada. Specifically, as a royalty or stream holder, Franco-Nevada has limited, if any, access to properties included in its asset portfolio. Additionally, Franco-Nevada may from time to time receive operating information from the owners and operators of the properties, which it is not permitted to disclose to the public. Franco- Nevada is dependent on the operators of the properties and their qualified persons to provide information to Franco-Nevada or on publicly available information to prepare disclosure pertaining to properties and operations on the properties on which Franco-Nevada holds royalty, stream or other interests and generally has limited or no ability to independently verify such information. Although Franco-Nevada does not have any knowledge that such information may not be accurate, there can be no assurance that such third party information is complete or accurate. Some information publicly reported by operators may relate to a larger property than the area covered by Franco-Nevada’s royalty, stream or other interest. Franco-Nevada’s royalty, stream or other interests often cover less than 100% and sometimes only a portion of the publicly reported Mineral Reserves, Mineral Resources and production of a property. Reconciliation to CIM Definitions In this Asset Handbook, Franco-Nevada has disclosed a number of resource and reserve estimates covering properties related to the mining assets that are not based on Canadian Institute of Mining, Metallurgy and Petroleum (“CIM”) definitions, but instead have been prepared in reliance upon JORC, SAMREC, SEC Industry Guide 7, and S-K 1300 (collectively, the “Acceptable Foreign Codes”). Estimates based on Acceptable Foreign Codes are recognized under NI 43-101 in certain circumstances. In each case, the Miner al Resources and Mineral Reserves reported in this Asset Handbook are based on estimates previously disclosed by the relevant property owner or operator, without reference to the underlying data used to calculate the estimates. Accordingly, Franco-Nevada is not able to reconcile the resource and reserve estimates prepared in reliance on an Acceptable Foreign Code with that of CIM definitions. Franco-Nevada previously sought confirmation from one of its technical advisory firms, that is comprised of engineers experienced in the preparation of resource and reserve estimates using CIM and each of the Acceptable Foreign Codes, of the extent to which an estimate prepared under an Acceptable Foreign Code would differ from that prepared under CIM definitions. Franco-Nevada was advised that, while the CIM definitions are not identical to those of the Acceptable Foreign Codes, the resource and reserve definitions and categories are substantively the same as the CIM definitions mandated in NI 43-101 and will typically result in reporting of substantially similar reserve and resource estimates. Such advisors further confirmed, without reference to the procedures in which the estimates prepared using Acceptable Foreign Codes that are reproduced in this Asset Handbook were conducted, that in the course of their preparation of a resource or reserve estimate they would effectively use the same procedures to prepare and report the resource or reserve estimate regardless of the reliance on CIM or any of the Acceptable Foreign Codes. Such advisors noted two provisos to this confirmation, being (i) SEC Industry Guide 7 prohibited the reporting of resources, and only permitted reporting of reserves, and (ii) it was generally accepted practice that staff at the SEC expected to see metals prices based on historic three year average prices in connection with Mineral Reserves reported in accordance with SEC Industry Guide 7, while each of CIM and the other Acceptable Foreign Codes permits the author of a resource or reserve estimate to use his or her discretion to establish a reasonable assumed metal price in such calculations.
FRANCO-NEVADA CORPORATION 151 ADDITIONAL INFORMATION THE GOLD INVESTMENT THAT WORKS Additional Information Mineral Reserve and Resource Estimates This Asset Handbook has been prepared in accordance with the requirements of Canadian securities laws in effect in Canada, which differ from the requirements of U.S. securities laws. Unless otherwise indicated, all mineral resource and reserve estimates included in this Asset Handbook have been prepared by the owners or operators of the relevant properties (as and to the extent indicated by them) in accordance with NI 43-101 and the Canadian Institute of Mining and Metallurgy Classification System. NI 43-101 is a rule developed by the Canadian securities regulatory authorities which establishes standards for all public disclosure an issuer makes of scientific and technical information concerning mineral projects. NI 43-101 permits a historical estimate made prior to the adoption of NI 43-101 that does not comply with NI 43-101 to be disclosed using the historical terminology if, among other things, the disclosure: (a) identifies the source and date of the historical estimate; (b) comments on the relevance and reliability of the historical estimate; (c) states whether the historical estimate uses categories other than those prescribed by NI 43-101; and (d) includes any more recent estimates or data available. Mining disclosur e under U.S. securities law was previously required to comply with SEC Industry Guide 7 (“SEC Industry Guide 7”) under the United States Securities Exchange Act of 1934, as amended. The SEC has adopted rules to replace SEC Industry Guide 7 with new mining disclosure rules under sub-part 1300 of Regulation S-K of the U.S. Securities Act (“Regulation S-K 1300”), which became mandatory for U.S. reporting companies beginning with the first fiscal year commencing on or after January 1, 2021. Under Regulation S-K 1300, the SEC now recognizes estimates of “Measured Mineral Resources”, “Indicated Mineral Resources” and “Inferred Mineral Resources”. In addition, the SEC has amended its definitions of “Proven Mineral Reserves” and “Probable Mineral Reserves” to be substantially similar to international standards. Readers are cautioned that despite efforts to harmonize U.S. mining disclosure rules with NI 43-101 and other international requirements, there are differences between the terms and definitions used in Regulation S-K 1300 and mining terms defined in the Canadian Institute of Mining, Metallurgy and Petroleum Standards, which definitions have been adopted by NI 43 - 101, and there is no assurance that any mineral reserves or mineral resources that an owner or operator may report as “proven mineral reserves”, “probable mineral reserves”, “measured mineral resources”, “indicated mineral resources” and “inferred mineral resources” under NI 43-101 would be the same had the owner or operator prepared the reserve or resource estimates under the standards of Regulation S-K 1300. Certain r eserve or resource estimates of U.S. reporting companies presented herein (notably Vale S.A.) have been prepared in accordance with SEC Industry Guide 7. Canadian standards, including NI 43 101, differ significantly from the requirements under SEC Industry Guide 7, and reserve and resource information contained herein may not be comparable to similar information disclosed by U.S. companies. In particular, and without limiting the generality of the foregoing, the term “resource” does not equate to the term “reserves”. Under SEC Industry Guide 7, mineralization could not be classified as a “reserve” unless the determination has been made that the mineralization could be economically and legally produced or extracted at the time the reserve determination is made. The SEC’s disclosure standards did not normally permit the inclusion of information concerning “measured mineral resources”, “indicated mineral resources” or “inferred mineral resources” or other descriptions of the amount of mineralization in mineral deposits that do not constitute “reserves” in documents filed with the SEC in compliance with SEC Industry Guide 7. U.S. investors are cautioned that “inferred mineral resources” have a lower level of confidence than that applying to “indicated mineral resources” and cannot be directly converted to a “mineral reserve”. It is reasonably expected that the majority of “inferred mineral resources” could be upgraded to “indicated mineral resources” with continued exploration. Under Canadian rules, estimated “inferred mineral resources” may not form the basis of feasibility or pre-feasibility studies except in rare cases. Investors are cautioned not to assume that all or any part of an “inferred mineral resource” exists or is economically or legally mineable. Disclosure of “contained ounces” in a mineral resource is permitted disclosure under Canadian regulations; however, SEC Industry Guide 7 normally only permitted issuers to report mineralization that does not constitute “reserves” under SEC Industry Guide 7 as in-place tonnage and grade without reference to unit measures. The requirements of NI 43-101 for identification of “reserves” are also not the same as under SEC Industry Guide 7, and reserves reported by the Corporation in compliance with NI 43-101 may not qualify as “reserves” under SEC Industry Guide 7. Accordingly, information concerning mineral deposits set forth herein may not be comparable with information made public by companies that have reported in accordance with SEC Industry Guide 7. In addition to NI 43-101, a number of r esource and reserve estimates have been prepared in accordance with the JORC Code or the SAMREC Code (as such terms are defined in NI 43-101), which differ from the requirements of NI 43-101 and U.S. securities laws. Accordingly, information containing descriptions of the Corporation’s mineral properties set forth herein may not be comparable to similar information made public by U.S. companies subject to the reporting and disclosure requirements under the U.S. federal securities laws and the rules and regulations thereunder. For more information, see “Reconciliation to CIM Definitions”. Oil & Gas Information Advisory In this Asset Handbook, certain natural gas volumes have been converted to barrels of oil equivalent on the basis of six Mcf to one bbl. Boe and mboe may be misleading, particularly if used in isolation. A conversion ratio of six Mcf to one bbl is based on an energy equivalency ratio and does not represent a value equivalency.
152 FNV TSX NYSE ADDITIONAL INFORMATION 2022 ASSET HANDBOOK Additional Information FORWARD LOOKING INFORMATION This Asset Handbook contains “forward looking information” and “forward looking statements” within the meaning of applicable Canadian securities laws and the United States Private Securities Litigation Reform Act of 1995, respectively, which may include, but are not limited to, statements with respect to future events or future performance, management’s expectations regarding Franco- Nevada’s growth, results of operations, estimated future revenues, performance guidance, carrying value of assets, future dividends and requirements for additional capital, mineral reserve and mineral resource estimates, production estimates, production costs and revenue, future demand for and prices of commodities, expected mining sequences, business prospects and opportunities, the performance and plans of third party operators, audits being conducted by the Canada Revenue Agency (“CRA”), the expected exposure for current and future assessments and available remedies, the remedies relating to and consequences of the ruling of the Supreme Court of Panama in relation to the Cobre Panama project, the aggregate value of common shares which may be issued pursuant to Franco-Nevada’s at-the-market equity program (the “ATM Program”), the Company’s expected use of the net proceeds of the ATM Program, if any. In addition, statements (including data in tables) relating to reserves and resources including reserves and resources covered by a royalty, stream or other interest, gold equivalent ounces (“GEOs”) or mine lives are forward looking statements, as they involve implied assessment, based on certain estimates and assumptions, and no assurance can be given that the estimates and assumptions are accurate and that such reserves and resources, mine lives and GEOs and royalty ounces will be realized. Such forward looking statements reflect management’s current beliefs and are based on information currently available to management. Often, but not always, forward looking statements can be identified by the use of words such as “plans”, “expects”, “is expected”, “budgets”, “potential for”, “scheduled”, “estimates”, “forecasts”, “predicts”, “projects”, “intends”, “targets”, “aims”, “anticipates” or “believes” or variations (including negative variations) of such words and phrases or may be identified by statements to the effect that certain actions “may”, “could”, “should”, “would”, “might” or “will” be taken, occur or be achieved. Forwar d looking statements involve known and unknown risks, uncertainties and other factors, which may cause the actual results, performance or achievements of Franco-Nevada to be materially different from any future results, performance or achievements expressed or implied by the forward looking statements. A number of factors could cause actual events or results to differ materially from any forward looking statement, including, without limitation: the price at which common shares are sold in the ATM Program and the aggregate net proceeds received by the Corporation as a result of the ATM Program; fluctuations in the prices of the primary commodities that drive royalty and stream revenue (gold, platinum group metals, copper, nickel, uranium, silver, iron-ore and oil and gas); fluctuations in the value of the Canadian and Australian dollar, Mexican peso and any other currency in which revenue is generated, relative to the U.S. dollar; changes in national and local government legislation, including permitting and licensing regimes and taxation policies and the enforcement thereof; the adoption of a global minimum tax on corporations; regulatory, political or economic developments in any of the countries where properties in which Franco-Nevada holds a royalty, stream or other interest are located or through which they are held; risks related to the operators of the properties in which Franco-Nevada holds a royalty, stream or other interest, including changes in the ownership and control of such operators; relinquishment or sale of mineral properties; influence of macroeconomic developments; business opportunities that become available to, or are pursued by Franco-Nevada; reduced access to debt and equity capital; litigation; title, permit or license disputes related to interests on any of the properties in which Franco-Nevada holds a royalty, stream or other interest; whether or not Franco-Nevada is determined to have “passive foreign investment company” (“PFIC”) status as defined in Section 1297 of the United States Internal Revenue Code of 1986, as amended; potential changes in Canadian tax treatment of offshore streams; excessive cost escalation as well as development, permitting, infrastructure, operating or technical difficulties on any of the properties in which Franco-Nevada holds a royalty, stream or other interest; access to sufficient pipeline capacity; actual mineral content may differ from the reserves and resources contained in technical reports; rate and timing of production differences from resource estimates, other technical reports and mine plans; risks and hazards associated with the business of development and mining on any of the properties in which Franco-Nevada holds a royalty, stream or other interest, including, but not limited to unusual or unexpected geological and metallurgical conditions, slope failures or cave-ins, flooding and other natural disasters, terrorism, civil unrest or an outbreak of contagious disease; the impact of the COVID-19 (corona - virus) pandemic; and the integration of acquired assets. The forward looking statements contained in this Asset Handbook are based upon assumptions management believes to be reasonable, including, without limitation: the ongoing operation of the properties in which Franco-Nevada holds a royalty, stream or other interest by the owners or operators of such properties in a manner consistent with past practice; the accuracy of public statements and disclosures made by the owners or operators of such underlying properties; no material adverse change in the market price of the commodities that underlie the asset portfolio; the Company’s ongoing income and assets relating to determination of its PFIC status; no material changes to existing tax treatment; the expected application of tax laws and regulations by taxation authorities; the expected assessment and outcome of any audit by any taxation authority; no adverse development in respect of any significant property in which Franco-Nevada holds a royalty, stream or other interest; the accuracy of publicly disclosed expectations for the development of underlying properties that are not yet in production; integration of acquired assets; and the absence of any other factors that could cause actions, events or results to differ from those anticipated, estimated or intended. However, there can be no assurance that forward looking statements will prove to be accurate, as actual results and future events could differ materially from those anticipated in such statements. Investors are cautioned that forward looking statements are not guarantees of future performance. In addition, there can be no assurance as to the outcome of the ongoing audit by the CRA or the Company’s exposure as a result thereof. Franco-Nevada cannot assure investors that actual results will be consistent with these forward looking statements. Accordingly, investors should not place undue reliance on forward looking statements due to the inherent uncertainty therein. For additional information with respect to risks, uncertainties and assumptions, please refer to the “Risk Factors” section of our most recent Annual Information Form as well as our most recent Management’s Discussion and Analysis filed with the Canadian securities regulatory authorities on www.sedar. com and contained in Franco-Nevada’s Form 40-F filed with the SEC on www.sec.gov. The forward looking statements herein are made as at March 11, 2022 (except where stated otherwise) and Franco-Nevada does not assume any obligation to update or revise them to reflect new information, estimates or opinions, future events or results or otherwise, except as required by applicable law.
FRANCO-NEVADA CORPORATION THE GOLD INVESTMENT THAT WORKS CORPORATE INFORMATION Executive Management Paul Brink President & CEO Sandip Rana Chief Financial Officer Lloyd Hong Chief Legal Officer & Corporate Secretary Eaun Gray Senior Vice President, Business Development Jason O’Connell Senior Vice President, Diversified Directors David Harquail Chair Paul Brink President & CEO Tom Albanese Derek Evans Dr. Catharine Farrow Louis Gignac Maureen Jensen Jennifer Maki Randall Oliphant Elliott Pew Chair Emeritus Pierre Lassonde Honourary Directors Graham Farquharson Hon. David R. Peterson Head Office 199 Bay Street, Suite 2000 P.O. Box 285 Commerce Court Postal Station Toronto, Canada M5L 1G9 Tel: (416) 306-6300 Barbados Office Ground Floor, Balmoral Hall, Balmoral Gap, Hastings, Christ Church Barbados, BB14034 Tel: (246) 434-8200 U.S. Office 1745 Shea Center Drive, Suite 400 Highlands Ranch Colorado, USA 80129 Tel: (720) 344-4986 Australia Office 44 Kings Park Road, Suite 41 West Perth, WA 6005, Australia Tel: 61-8-6263-4425 Listings of Common Shares Toronto Stock Exchange: FNV New York Stock Exchange: FNV Share Capital As at April 8, 2022 Common shares outstanding 191,481,722 Reserved for: Options & other 842 ,449 Fully diluted: 192,324,171 Auditors PricewaterhouseCoopers LLP Toronto, Canada Transfer Agent Computershare Investor Services Inc. 100 University Avenue, 8th Floor Toronto, Canada M5J 2Y1 Toll Free: (800) 564-6253 Tel: (514) 982-7555 [email protected] Investor Information [email protected] www.franco-nevada.com Tel: (416) 306-6323 Toll Free: (877) 401-3833 Additional Information
FNV TSX/NYSE www.FRANCO-NEVADA.com