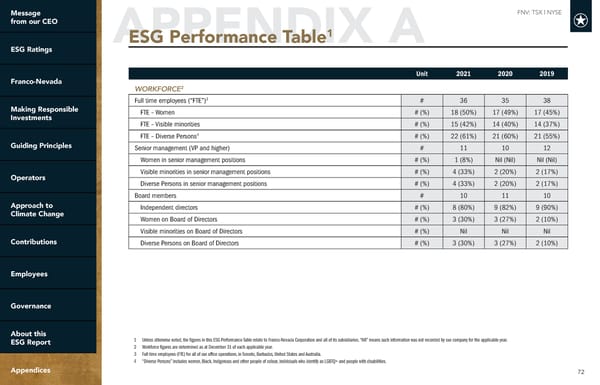
Message FNV: TSX | NYSE from our CEO 1 ESG Ratings APPENDIX AESG Performance Table Franco-Nevada Unit 2021 2020 2019 WORKFORCE2 3 Full time employees (“FTE”) # 36 35 38 Making Responsible FTE – Women # (%) 18 (50%) 17 (49%) 17 (45%) Investments FTE – Visible minorities # (%) 15 (42%) 14 (40%) 14 (37%) FTE – Diverse Persons4 # (%) 22 (61%) 21 (60%) 21 (55%) Guiding Principles Senior management (VP and higher) # 11 10 12 Women in senior management positions # (%) 1 (8%) Nil (Nil) Nil (Nil) Operators Visible minorities in senior management positions # (%) 4 (33%) 2 (20%) 2 (17%) Diverse Persons in senior management positions # (%) 4 (33%) 2 (20%) 2 (17%) Board members # 10 11 10 Approach to Independent directors # (%) 8 (80%) 9 (82%) 9 (90%) Climate Change Women on Board of Directors # (%) 3 (30%) 3 (27%) 2 (10%) Visible minorities on Board of Directors # (%) Nil Nil Nil Contributions Diverse Persons on Board of Directors # (%) 3 (30%) 3 (27%) 2 (10%) Employees Governance About this ESG Report 1 Unless otherwise noted, the figures in this ESG Performance Table relate to Franco-Nevada Corporation and all of its subsidiaries. “NR” means such information was not recorded by our company for the applicable year. 2 Workforce figures are determined as at December 31 of each applicable year. 3 Full time employees (FTE) for all of our office operations, in Toronto, Barbados, United States and Australia. 4 “Diverse Persons” includes women, Black, Indigenous and other people of colour, individuals who identify as LGBTQ+ and people with disabilities. Appendices 72
 Franco-Nevada 2022 ESG Report Page 71 Page 73