

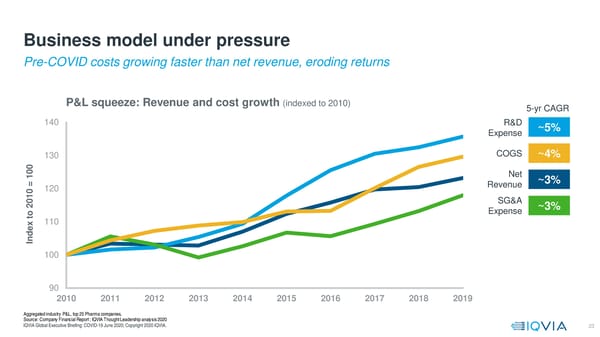
Business model under pressure Pre-COVID costs growing faster than net revenue, eroding returns P&L squeeze: Revenue and cost growth (indexed to 2010) 5-yr CAGR 140 R&D ~5% Expense 130 COGS ~4% 0 0 Net 1 ~3% = 120 Revenue 0 01 SG&A 2 ~3% Expense o t 110 ex d n I 100 90 2010 2011 2012 2013 2014 2015 2016 2017 2018 2019 Aggregated industry P&L, top 25 Pharma companies, Source: Company Financial Report ; IQVIA Thought Leadership analysis 2020 C Q Q | | S | CO CO IQVIA Global Executive Briefing: COVID-19 June 2020; Copyright 2020 IQVIA. 23
 COVID-19 Global Executive Briefing | IQVIA Page 22 Page 24