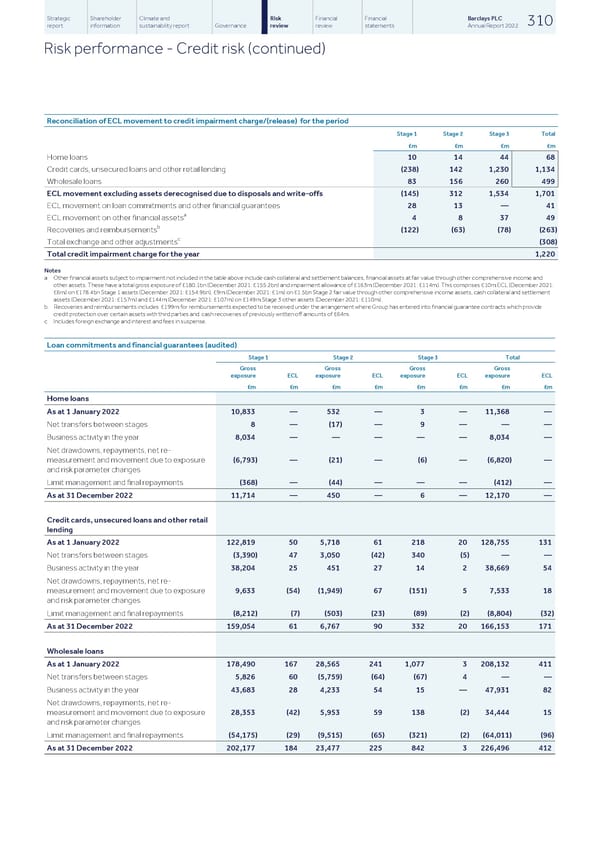
Strategic Shareholder Climate and Risk Financial Financial Barclays PLC 310 report information sustainability report Governance review review statements Annual Report 2022 Risk performance - Credit risk (continued) Reconciliation of ECL movement to credit impairment charge/(release) for the period Stage 1 Stage 2 Stage 3 Total £m £m £m £m Home loans 10 14 44 68 Credit cards, unsecured loans and other retail lending (238) 142 1,230 1,134 Wholesale loans 83 156 260 499 ECL movement excluding assets derecognised due to disposals and write-offs (145) 312 1,534 1,701 ECL movement on loan commitments and other financial guarantees 28 13 — 41 a ECL movement on other financial assets 4 8 37 49 b Recoveries and reimbursements (122) (63) (78) (263) c Total exchange and other adjustments (308) Total credit impairment charge for the year 1,220 Notes a Other financial assets subject to impairment not included in the table above include cash collateral and settlement balances, financial assets at fair value through other comprehensive income and other assets. These have a total gross exposure of £180.1bn (December 2021: £155.2bn) and impairment allowance of £163m (December 2021: £114m). This comprises £10m ECL (December 2021: £6m) on £178.4bn Stage 1 assets (December 2021: £154.9bn), £9m (December 2021: £1m) on £1.5bn Stage 2 fair value through other comprehensive income assets, cash collateral and settlement assets (December 2021: £157m) and £144m (December 2021: £107m) on £149m Stage 3 other assets (December 2021: £110m). b Recoveries and reimbursements includes £199m for reimbursements expected to be received under the arrangement where Group has entered into financial guarantee contracts which provide credit protection over certain assets with third parties and cash recoveries of previously written off amounts of £64m. c Includes foreign exchange and interest and fees in suspense. Loan commitments and financial guarantees (audited) Stage 1 Stage 2 Stage 3 Total Gross Gross Gross Gross exposure ECL exposure ECL exposure ECL exposure ECL £m £m £m £m £m £m £m £m Home loans As at 1 January 2022 10,833 — 532 — 3 — 11,368 — Net transfers between stages 8 — (17) — 9 — — — Business activity in the year 8,034 — — — — — 8,034 — Net drawdowns, repayments, net re- measurement and movement due to exposure (6,793) — (21) — (6) — (6,820) — and risk parameter changes Limit management and final repayments (368) — (44) — — — (412) — As at 31 December 2022 11,714 — 450 — 6 — 12,170 — Credit cards, unsecured loans and other retail lending As at 1 January 2022 122,819 50 5,718 61 218 20 128,755 131 Net transfers between stages (3,390) 47 3,050 (42) 340 (5) — — Business activity in the year 38,204 25 451 27 14 2 38,669 54 Net drawdowns, repayments, net re- measurement and movement due to exposure 9,633 (54) (1,949) 67 (151) 5 7,533 18 and risk parameter changes Limit management and final repayments (8,212) (7) (503) (23) (89) (2) (8,804) (32) As at 31 December 2022 159,054 61 6,767 90 332 20 166,153 171 Wholesale loans As at 1 January 2022 178,490 167 28,565 241 1,077 3 208,132 411 Net transfers between stages 5,826 60 (5,759) (64) (67) 4 — — Business activity in the year 43,683 28 4,233 54 15 — 47,931 82 Net drawdowns, repayments, net re- measurement and movement due to exposure 28,353 (42) 5,953 59 138 (2) 34,444 15 and risk parameter changes Limit management and final repayments (54,175) (29) (9,515) (65) (321) (2) (64,011) (96) As at 31 December 2022 202,177 184 23,477 225 842 3 226,496 412
 Barclays PLC - Annual Report - 2022 Page 311 Page 313