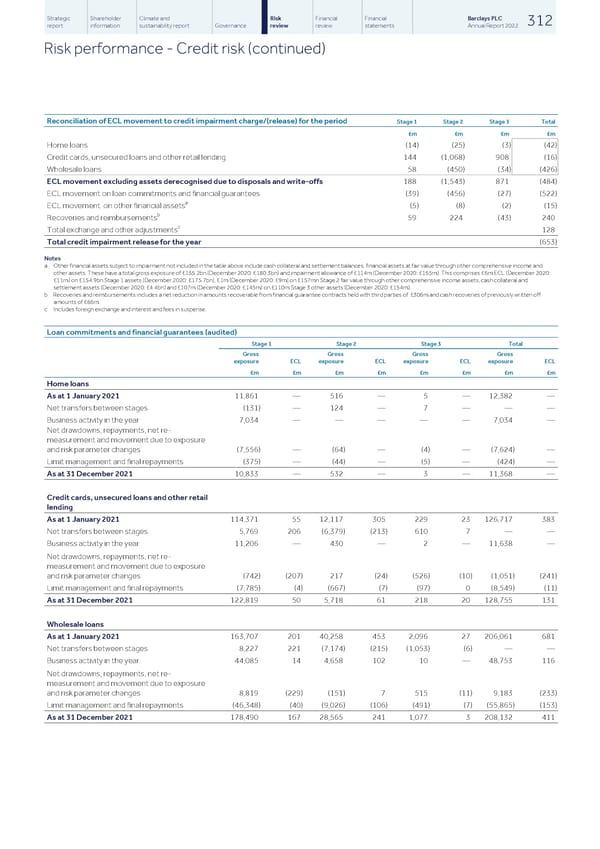
Strategic Shareholder Climate and Risk Financial Financial Barclays PLC 312 report information sustainability report Governance review review statements Annual Report 2022 Risk performance - Credit risk (continued) Reconciliation of ECL movement to credit impairment charge/(release) for the period Stage 1 Stage 2 Stage 3 Total £m £m £m £m Home loans (14) (25) (3) (42) Credit cards, unsecured loans and other retail lending 144 (1,068) 908 (16) Wholesale loans 58 (450) (34) (426) ECL movement excluding assets derecognised due to disposals and write-offs 188 (1,543) 871 (484) ECL movement on loan commitments and financial guarantees (39) (456) (27) (522) a ECL movement on other financial assets (5) (8) (2) (15) b Recoveries and reimbursements 59 224 (43) 240 c Total exchange and other adjustments 128 Total credit impairment release for the year (653) Notes a Other financial assets subject to impairment not included in the table above include cash collateral and settlement balances, financial assets at fair value through other comprehensive income and other assets. These have a total gross exposure of £155.2bn (December 2020: £180.3bn) and impairment allowance of £114m (December 2020: £165m). This comprises £6m ECL (December 2020: £11m) on £154.9bn Stage 1 assets (December 2020: £175.7bn), £1m (December 2020: £9m) on £157mn Stage 2 fair value through other comprehensive income assets, cash collateral and settlement assets (December 2020: £4.4bn) and £107m (December 2020: £145m) on £110m Stage 3 other assets (December 2020: £154m). b Recoveries and reimbursements includes a net reduction in amounts recoverable from financial guarantee contracts held with third parties of £306m and cash recoveries of previously written off amounts of £66m. c Includes foreign exchange and interest and fees in suspense. Loan commitments and financial guarantees (audited) Stage 1 Stage 2 Stage 3 Total Gross Gross Gross Gross exposure ECL exposure ECL exposure ECL exposure ECL £m £m £m £m £m £m £m £m Home loans As at 1 January 2021 11,861 — 516 — 5 — 12,382 — Net transfers between stages (131) — 124 — 7 — — — Business activity in the year 7,034 — — — — — 7,034 — Net drawdowns, repayments, net re- measurement and movement due to exposure and risk parameter changes (7,556) — (64) — (4) — (7,624) — Limit management and final repayments (375) — (44) — (5) — (424) — As at 31 December 2021 10,833 — 532 — 3 — 11,368 — Credit cards, unsecured loans and other retail lending As at 1 January 2021 114,371 55 12,117 305 229 23 126,717 383 Net transfers between stages 5,769 206 (6,379) (213) 610 7 — — Business activity in the year 11,206 — 430 — 2 — 11,638 — Net drawdowns, repayments, net re- measurement and movement due to exposure and risk parameter changes (742) (207) 217 (24) (526) (10) (1,051) (241) Limit management and final repayments (7,785) (4) (667) (7) (97) 0 (8,549) (11) As at 31 December 2021 122,819 50 5,718 61 218 20 128,755 131 Wholesale loans As at 1 January 2021 163,707 201 40,258 453 2,096 27 206,061 681 Net transfers between stages 8,227 221 (7,174) (215) (1,053) (6) — — Business activity in the year 44,085 14 4,658 102 10 — 48,753 116 Net drawdowns, repayments, net re- measurement and movement due to exposure and risk parameter changes 8,819 (229) (151) 7 515 (11) 9,183 (233) Limit management and final repayments (46,348) (40) (9,026) (106) (491) (7) (55,865) (153) As at 31 December 2021 178,490 167 28,565 241 1,077 3 208,132 411
 Barclays PLC - Annual Report - 2022 Page 313 Page 315