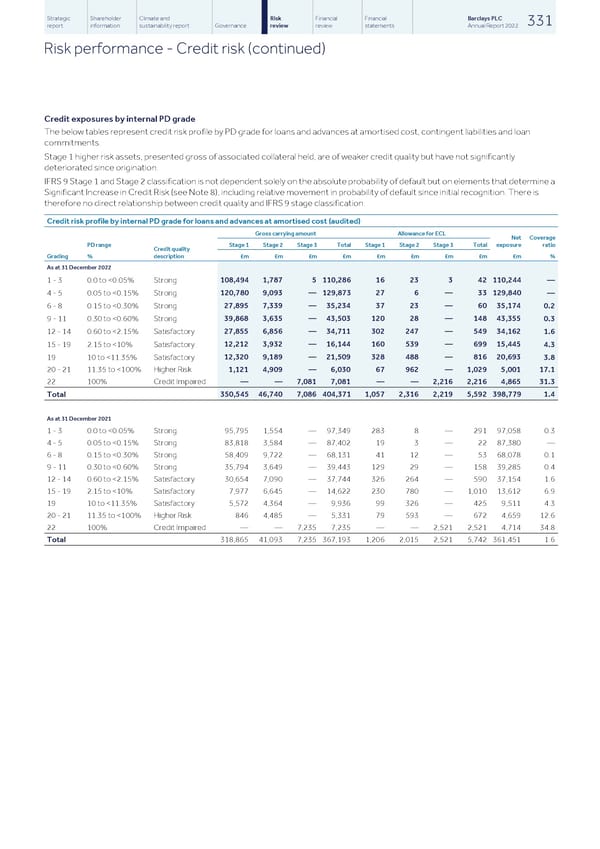
Strategic Shareholder Climate and Risk Financial Financial Barclays PLC 331 report information sustainability report Governance review review statements Annual Report 2022 Risk performance - Credit risk (continued) Credit exposures by internal PD grade The below tables represent credit risk profile by PD grade for loans and advances at amortised cost, contingent liabilities and loan commitments. Stage 1 higher risk assets, presented gross of associated collateral held, are of weaker credit quality but have not significantly deteriorated since origination. IFRS 9 Stage 1 and Stage 2 classification is not dependent solely on the absolute probability of default but on elements that determine a Significant Increase in Credit Risk (see Note 8), including relative movement in probability of default since initial recognition. There is therefore no direct relationship between credit quality and IFRS 9 stage classification. Credit risk profile by internal PD grade for loans and advances at amortised cost (audited) Gross carrying amount Allowance for ECL Net Coverage PD range Stage 1 Stage 2 Stage 3 Total Stage 1 Stage 2 Stage 3 Total exposure ratio Credit quality Grading % description £m £m £m £m £m £m £m £m £m % As at 31 December 2022 108,494 1,787 5 110,286 16 23 3 42 110,244 1 - 3 0.0 to
 Barclays PLC - Annual Report - 2022 Page 332 Page 334