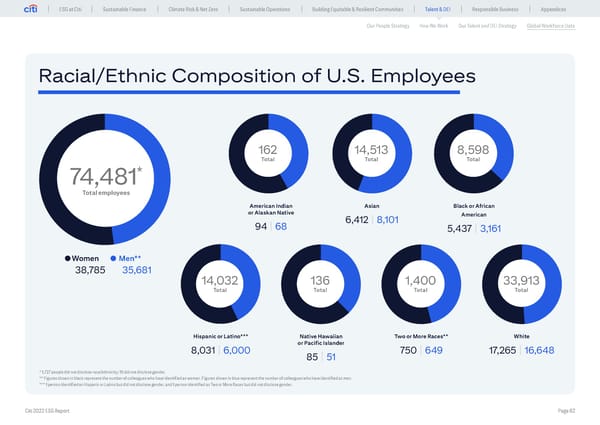
ESG at Citi Sustainable Finance Climate Risk & Net Zero Sustainable Operations Building Equitable & Resilient Communities Talent & DEI Responsible Business Appendices Our People Strategy How We Work Our Talent and DEI Strategy Global Workforce Data Racial/Ethnic Composition of U.S. Employees 162 14,513 8,598 Total Total Total 74,481* Total employees American Indian Asian Black or African or Alaskan Native 6,412 8,101 American 94 68 5,437 3,161 Women Men** 38,785 35,681 14,032 136 1,400 33,913 Total Total Total Total Hispanic or Latino*** Native Hawaiian Two or More Races** White 8,031 6,000 or Pacific Islander 750 649 17,265 16,648 85 51 * 1,727 people did not disclose race/ethnicity; 15 did not disclose gender. ** Figures shown in black represent the number of colleagues who have identified as women. Figures shown in blue represent the number of colleagues who have identified as men. *** 1 person identified as Hispanic or Latino but did not disclose gender, and 1 person identified as Two or More Races but did not disclose gender. Citi 2022 ESG Report Page 62
 Global ESG Report 2022 Citi Bookmarked Page 61 Page 63