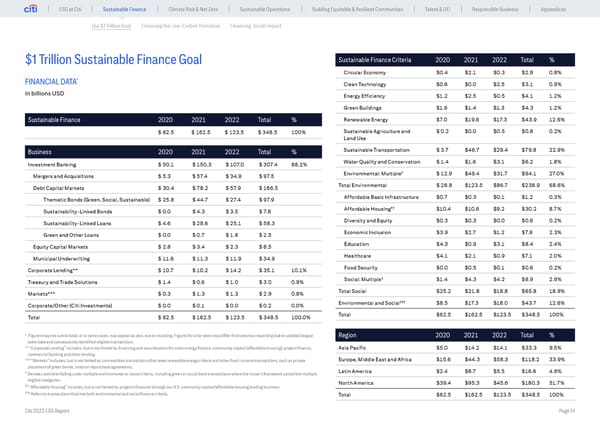
ESG at Citi Sustainable Finance Climate Risk & Net Zero Sustainable Operations Building Equitable & Resilient Communities Talent & DEI Responsible Business Appendices Our $1 Trillion Goal Financing the Low-Carbon Transition Financing Social Impact $1 Trillion Sustainable Finance Goal Sustainable Finance Criteria 2020 2021 2022 Total % Circular Economy $0.4 $2.1 $0.3 $2.8 0.8% * FINANCIAL DATA Clean Technology $0.6 $0.0 $2.5 $3.1 0.9% In billions USD Energy Efficiency $1.2 $2.5 $0.5 $4.1 1.2% Green Buildings $1.6 $1.4 $1.3 $4.3 1.2% Sustainable Finance 2020 2021 2022 Total % Renewable Energy $7.0 $19.6 $17.3 $43.9 12.6% $ 62.5 $ 162.5 $ 123.5 $ 348.5 100% Sustainable Agriculture and $ 0.2 $0.0 $0.5 $0.8 0.2% Land Use Business 2020 2021 2022 Total % Sustainable Transportation $ 3.7 $46.7 $29.4 $79.8 22.9% Investment Banking $ 50.1 $ 150.3 $ 107.0 $ 307.4 88.2% Water Quality and Conservation $ 1.4 $1.6 $3.1 $6.2 1.8% Mergers and Acquisitions $ 5.3 $ 57.4 $ 34.9 $ 97.5 Environmental: Multiple† $ 12.9 $49.4 $31.7 $94.1 27.0% Debt Capital Markets $ 30.4 $ 78.2 $ 57.9 $ 166.5 Total Environmental $ 28.8 $123.5 $86.7 $238.9 68.6% Thematic Bonds (Green, Social, Sustainable) $ 25.8 $ 44.7 $ 27.4 $ 97.9 Affordable Basic Infrastructure $0.7 $0.3 $0.1 $1.2 0.3% Sustainability-Linked Bonds $ 0.0 $ 4.3 $ 3.5 $ 7.8 Affordable Housing†† $10.4 $10.6 $9.2 $30.2 8.7% Sustainability-Linked Loans $ 4.6 $ 28.6 $ 25.1 $ 58.3 Diversity and Equity $0.3 $0.3 $0.0 $0.6 0.2% Green and Other Loans $ 0.0 $ 0.7 $ 1.8 $ 2.5 Economic Inclusion $3.9 $2.7 $1.2 $7.9 2.3% Equity Capital Markets $ 2.8 $ 3.4 $ 2.3 $ 8.5 Education $4.3 $0.9 $3.1 $8.4 2.4% Municipal Underwriting $ 11.6 $ 11.3 $ 11.9 $ 34.9 Healthcare $4.1 $2.1 $0.9 $7.1 2.0% Corporate Lending** $ 10.7 $ 10.2 $ 14.2 $ 35.1 10.1% Food Security $0.0 $0.5 $0.1 $0.6 0.2% Treasury and Trade Solutions $ 1.4 $ 0.6 $ 1.0 $ 3.0 0.9% Social: Multiple† $1.4 $4.3 $4.2 $9.9 2.9% Markets*** $ 0.3 $ 1.3 $ 1.3 $ 2.9 0.8% Total Social $25.2 $21.8 $18.8 $65.8 18.9% Corporate/Other (Citi Investments) $ 0.0 $ 0.1 $ 0.0 $ 0.2 0.0% Environmental and Social††† $8.5 $17.3 $18.0 $43.7 12.6% Total $ 62.5 $ 162.5 $ 123.5 $ 348.5 100.0% Total $62.5 $162.5 $123.5 $348.5 100% * Figures may not sum to total, or in some cases, may appear as zero, due to rounding. Figures for prior years may differ from previous reporting due to updated league Region 2020 2021 2022 Total % table data and subsequently identified eligible transactions. ** “Corporate Lending” includes, but is not limited to, financing and securitization for clean energy finance, community capital (affordable housing), project finance, Asia Pacific $5.0 $14.2 $14.1 $33.3 9.5% commercial banking and other lending. *** “Markets” includes, but is not limited to, commodities transactions that meet renewable energy criteria and other fixed-income transactions, such as private Europe, Middle East and Africa $15.6 $44.3 $58.3 $118.2 33.9% placement of green bonds, notes or repurchase agreements. † Denotes activities falling under multiple environmental or social criteria, including green or social bond transactions where the issuer’s framework comprises multiple Latin America $2.4 $8.7 $5.5 $16.6 4.8% eligible categories. North America $39.4 $95.3 $45.6 $180.3 51.7% †† “Affordable Housing” includes, but is not limited to, projects financed through our U.S. community capital/affordable housing lending business. ††† Refers to transactions that met both environmental and social finance criteria. Total $62.5 $162.5 $123.5 $348.5 100% Citi 2022 ESG Report Page 14
 Global ESG Report 2022 Citi Bookmarked Page 13 Page 15