Content thumbnail COVID-19 Facts and Insight

COVID-19 Facts and Insight

Briefing Note Presentation from the Global Health & Crisis Response | 34 slides

COVID-19: Briefing Note Global Health & Crisis Response Updated: March 16, 2020 Copyright @ 2020 McKinsey & Company. All rights reserved. Any use of this material without specific permission of McKinsey & Company is strictly prohibited

Current as of March 16, 2020 COVID-19 is, first and foremost, a global humanitarian challenge. Thousands of health professionals are heroically battling the virus, putting their own lives at risk. Governments and industry are working together to understand and address the challenge, support victims and their families and communities, and search for treatments and a vaccine. Companies around the world need to act promptly. This document is meant to help senior leaders understand the COVID-19 situation and how it may unfold, and take steps to protect their employees, customers, supply chains and financial results. Read more on Mckinsey.com McKinsey & Company 2

Current as of March 16, 2020 Executive summary The situation Possible future Actions for companies now scenarios to consider COVID-19 has seen a consistent case Delayed Recovery: The virus continues to A central, cross-functional Nerve decline in countries that had experienced spread across the Middle East, Europe and Center can coordinate efforts to: rapid case growth early (esp. China, South US until mid Q2 2020, when virus seasonality Ÿ Protect employees and give them Korea) combined with a stronger public health a strong sense of shared purpose However, cases outside of Asia are growing response drives case load reduction Ÿ Stress-test financials dramatically, driven primarily by complexes Prolonged Contraction: The virus spreads Ÿ Stabilize the supply chain in Europe and the Middle East. The United globally without a seasonal decline, creating Ÿ Engage customers States, while it has confirmed only a limited a demand shock that lasts until Q2 2021. number of new cases, appears to be set for Health systems are overwhelmed in many a large increase in cases once testing kits countries, especially the poorest, with large- become widely available scale human and economic impact Sources: World Health Organization Situation Reports, news reports, McKinsey analysis McKinsey & Company 3

s ent nt 01 02 03 04 Co COVID-19 Possible Actions for Leading The situation future companies indicator now scenarios to consider dashboards McKinsey & Company 4

Current as of March 16, 2020 5 COVID-19 appears to be Comparison to other diseases more dangerous than the flu Early identification of the disease, intensification of Latest as of March 15, 2020 viral control, and treatment, when available, will reduce reproduction number and case fatality 3 1 H Measles Features of the disease to date r on 4) e s > b r ( e G Polio3 m p h u n d 1.5-2x e Hig Chickenpox Smallpox K e t ag c ) r e g D Higher reproduction than the flu e f n in i t ( avh t 3 c e 4) a s r e - e k 2 Up to 20% b y a ( MERS-CoV J b e m r m F SARS-CoV u d b iu Of cases have a severe/critical form of the n e t d t u e n c o 6 o e M COVID-19 disease i f in t n c i u C Zika e d l o op E Influenza 1918 r e Ebola (West ~0.9% p p 2) B Influenza H2N2 1957 I - Re 0 Africa 2014) Case Fatality Ratio in South Korea after of ( A Influenza H1N1 2009 w widespread testing. CFR appears higher Lo where cases are missed and is higher when health systems are overwhelmed2 Low (<2%) Medium (2-15%) High (>15%) 4 Case Fatality (proportion of deaths among confirmed cases) 1. Evidence on exact numbers are emerging, however expected to decrease as viral containment measures intensify and treatments are developed 2. WHO estimates the global average CFR at 3.4%, dependent on conditions such as patient age, community immunity, and health system capabilities. Latest case fatality ratios were calculated as death/ cases 3. In outbreak setting or the introduction of a new disease 4. Case Fatality numbers reflect outbreak settings and factors such as the patient's age, community immunity and health system capabilities 5. Estimates are very context and time specific, however are provided from prior outbreaks based on academic lit review 6. WHO estimates 15% severe and 5% critical Sources: World Health Organization, CDC, Nature, The Lancet, PLOS One The Journal of Infectious Diseases, BMC Infectious Diseases, Infectious Disease Modelling, news reports McKinsey & Company 5

Current as of March 16, 2020 Impact >153,000 >5,700 to date Reported confirmed Deaths The global spread cases is accelerating >140 >80 ~40 with more reports of local Countries or territories Countries or territories Countries or territories 1 with reported cases with evidence of local with more than 100 2 1 transmission transmission reported cases Latest as of March 15, 2020 <1% ~75% >40 China’s share of new New reported cases on New countries with th th th 1. Previously counted only countries; now aligned with new WHO reports; reported cases March March 9-15 from cases March 9 -15 excluding cruise ship; th th 2. Previously noted as community transmission in McKinsey documents; now 9 -15 Europe aligned with WHO definition Sources: World Health Organization, CDC, news reports McKinsey & Company 6

Current as of March 16, 2020 The virus is located in 5 major “transmission Europe cases >45,000 Total deaths complexes” Total >1,700 A complex is an area with confirmed local transmission, and more than 100 confirmed cases, where it is difficult to prevent people’s movement Propagation trend Mature/ on-going propagation Early propagation China complex > 1000 reported cases cases Total >81,000 1 deaths 250-999 Americas Total >3,200 100-249 cases Total >2,300 50-99 deaths Total >40 10-49 3 Middle East <10 cases Total >13,900 2 deaths Asia (excl China) Total >620 cases Total >10,100 deaths 1. WHO data is lagging behind news reports for United States. In United States, CDC & WHO reports >1,600 cases; New York Times reports >3,600 cases Total >110 2. Includes Western Pacific and South-East Asia WHO regions; excludes China; Note that South Korea incremental cases are declining, however other countries are increasing 3. Eastern-Mediterranean WHO region Source: World Health Organization, team analysis McKinsey & Company 7

Current as of March 16, 2020 Progression varies widely among countries Country Status Recent Actions China New cases at low levels Strict containment and quarantine >81,000 >3,200 ~4.0% throughout China Significant testing at facilities and in Hubei 2 Construction of makeshift hospitals to increase Cases Deaths Case Fatality capacity South Korea New cases declined ~75% in Significant preparedness & rapid regulatory approval the last week with potential process for tests 1 Rapid roll-out of diagnostics (e.g., diagnostic drive- >8,100 >70 ~0.9% decline or plateau through) 2 Cases Deaths Case Fatality Hospitalization available for lower-severity cases & significant hospital coordination Italy ~3,500 new cases on March Efforts initially focused on Northern Italy, but efforts th now extend to the entire country, including >21,100 >1,400 ~6.8% 15 –the highest in the cancellations of larger gatherings 2 world, corresponding to a Healthcare recruiting efforts due to strain Cases Deaths Case Fatality ~180% increase in the last week1 Schools closed nationwide US3 US cases are increasing daily, A national emergency was declared on March 13 with however official reporting Congress aiming to provide testing free of charge >1,600 >40 ~2.4% 1 >29 states have declared emergency with a range of 2 may be lagging actions including school closures, bans on large Cases Deaths Case Fatality gatherings and large-scale testing plans 1. Number of new confirmed cases on March 15th compared to March 8th 2. Case Fatality calculated as ( total deaths) / (total cases) – this rate is evolving and dependent upon several factors, including number of suspected cases that are tested 3. WHO data is lagging behind news reports for United States; In United States, CDC & WHO reports >1,600 cases; New York Times reports >3,600 cases McKinsey and Company 8 Source: WHO situation reports, US CDC, press search

Current as of March 16, 2020 Overall, ~20% of cases are estimated to be severe/critical, requiring significant health capacity for testing and critical-care infrastructure WHO estimated global Context distribution by severity of symptoms WHO estimates ~20% of COVID-19 cases 100% are severe (requiring oxygen) or critical (requiring ventilation) Higher severity has potential to This reflects a higher level of severity overwhelm compared to influenza for instance hospital systems given that these At a country level, mild cases may go Mild 80% cases may require undiagnosed treatment Severe 15% Critical 5% 2020 Source: JAMA, WHO March 6 reports, JAMA, WSJ and associated press interviews with Italian physicians McKinsey and Company 9

Current as of March 16, 2020 People 50+ in age are ~40-76% of diagnosed cases As of data from February 11, 2020, in China and as of March 16 and 15, 2020, in South Korea and Italy, respectively Context Total cases by country and age segment, Percent by age segment Approximate age range1 In all three countries, there is a significant 0-19 difference in the age distribution 20-49 100% = 50-69 There is only a small percentage of cases 6% 2% 1% 70+ found among the youngest populations (0- 24% Undiagnosed t 19) despite frequent contac with other 44% individuals (school, public transport) 52% 37% 32% 42% 38% 10% 12% Undiagnosed Undiagnosed Undiagnosed (TBD) (TBD) (TBD) South Korea China Italy ~0.8-.9% fatalities ~2.3-4.0% fatalities2 ~4.3-7.2% fatalities2 1. Italy reports age segments slightly differently than South Korea and China thus categories are rounded 2. Note - Data reported from ISS March 15 reports 7.2%, however latest deaths/ cases from WHO indicates this may be higher 3. Note: Data reported from China February 11 reports 2.3%, however, latest deaths/cases from WHO indicate this may be higher Source: Korea CDC, China CDC, ISS Italian National Health Service McKinsey and Company 10

Current as of March 16, 2020 Case fatality rate data from three countries shows that older populations are at greater risk overall Data as of February 11 in China, 2020, and as of March 16 and 15, 2020, in South Korea and Italy, respectively Context Case fatality rate (%) by age segment South Korea China Italy WHO has estimated 20.2 global case fatality rates at 3.4% Rates vary significantly by age, 14.8 Fatalities may co-morbidity, health lag incremental system strength and 12.5 case reporting other factors 9.3 8.0 6.8-7.2% 5.3 Avg Italy1 3.6 3.5 2.3-4.0% 1 1.3 1.4 Avg China 0 0 0 0 0.2 0 0 0.2 0 0.10.2 0.3 0.10.4 0.4 0.4 1.0 0.8-0.9% Avg South Korea 0-9 10-19 20-29 30-39 40-49 50-59 60-69 70-79 80+ Age range 1. Note - data reported from China Feb 11 reports 2.3%, however latest deaths/cases from WHO indicate this may be higher Source: L’Istituto Superiore di Sanità (ISS) Italy, WHO, Korea CDC, China CDC McKinsey and Company 11

s ent nt 01 02 03 04 Co COVID-19 Possible Actions for Leading The situation future companies indicator now scenarios to consider dashboards McKinsey & Company 12

Current as of March 16, 2020 Scenario overview The situation now Epidemiological scenarios Economic impacts COVID-19 has seen a consistent case Delayed Recovery China and East Asian countries start decline in countries that had China and East Asian countries continue recovery but supply chains remain experienced rapid case growth early their current recovery and control the impaired (esp China, South Korea) virus by late Q1 or early Q2 2020 US and Europe large-scale quarantines, However, cases outside of Asia are European and US case count growth travel restrictions, and social distancing growing dramatically, driven primarily rises rapidly through mid-April drive drop-off in consumer spending and business investment in 2020 by complexes in Europe and the Middle East. The United States, while Prolonged Contraction China and East Asia experience double- it has confirmed only a limited number dip slowdowns as economic recovery is of new cases, may experience a large China and East Asian countries face a derailed in 2020 and pushed into Q1 increase in cases once testing kits surge of re-infection as they attempt to 2021 become widely available restart economic activity The virus is not seasonal with a mutated The United States and Europe virus resurging in the fall of 2020 experience demand-side reductions in consumer and business spending and deep recessions in 2020 Sources: World Health Organization Situation Reports, news reports, McKinsey analysis McKinsey & Company 13

Current as of March 16, 2020 Epidemiological scenario Economic impacts European and US case-count growth rises China and East Asian countries start recovery rapidly through mid-April but supply chains remain impaired in much of Q2 Tests available, and extent of cases fully 2020 and consumer spending subdued discovered by mid-April; More aggressive In the United States and Europe, large-scale Delayed shutdowns and social distancing slows spread quarantines, travel restrictions, and social recovery New case counts peak by end April and decline distancing drive drop-off in consumer spending by June with stronger public-health response and subsequently, business investment in 2020 The virus continues to and seasonality of virus • Layoffs drive unemployment rates higher spread across the Middle Fall 2020 sees a resurgence of the virus. • Corporate bankruptcies spike, putting East, Europe, and the Although countries have better public-health pressure on the banking/financial system United States until mid- preparedness globally • Monetary easing has limited impact with Q2, when virus Iran continues to be the epicenter in Middle already low rates and fiscal responses prove East; Southeast and South Asia, Africa, and Latin insufficient and poorly timed seasonality combined America are spared worst effects due to their • Self-reinforcing recession dynamics extend with a stronger public- warm climates and young demographics GDP declines through Q3; recovery begins in health response drives China and East Asian countries continue their Q4 case-load reduction current recovery and control the virus by late Q1 2020 Global GDP growth falls sharply, driven by or early Q2 2020 recessions in the United States and Europe and slower growth in China and other Asian countries. McKinsey & Company 14

Current as of March 16, 2020 Epidemiological scenario Economic impacts European and US public-health measures China and East Asia experience double-dip deliver initial containment of the virus only by slowdowns as economic recovery is derailed in early June 2020 and pushed into Q1 2021 The virus does not prove to be seasonal with a The United States and Europe experience Prolonged mutated virus resurging in the fall of 2020, demand-side reductions in consumer and leading to a spike in cases across geographies business spending and deep recessions in 2020 contraction throughout Q2 • Layoffs and bankruptcies in the most The virus spreads globally Restrictions on travel and quarantines in the affected sectors rise sharply throughout United States, Europe, China, and East Asia are 2020, feeding into a self-reinforcing without a seasonal tightened further in an attempt to stem the tide downward spiral decline, creating a Iran continues to be the epicenter in Middle • Financial system distress is significant but a demand shock that lasts East; Southeast and South Asia, Africa, and Latin full-scale banking crisis is averted due to until Q2 2021. Health America are spared worst effects due to their better capitalization of banks and new systems are warm climates and young demographics macro-prudential supervision in place overwhelmed in many China and East Asian countries face a surge of • Fiscal and monetary policy responses prove re-infection as a result of attempt to restart insufficient to break the headwinds countries, especially the economic activity The global economic impact is severe, with poorest, with large-scale significant GDP contraction in most major human and economic economies in 2020 and a slow-moving recovery impact beginning in only Q2 2021 McKinsey & Company 15

s ent nt 01 02 03 04 Co COVID-19 Possible Actions for Leading The situation future companies indicator now scenarios to consider dashboards McKinsey & Company 16

Current as of March 16, 2020 A crisis nerve center can play an important role in planning and managing COVID-19 responses Crisis nerve centers can help in situations with three When setting up a nerve center, consider four key determining features actions: : Ÿ A disruption or crisis requires immediate attention. It may • Discover an accurate view of the situation through have arrived or be imminent multisource “listening posts,” assess how it might Ÿ The situation is novel due to the nature or scale of the evolve, and derive implications for the organization threat, which distinguishes it from a “routine emergency” • Design a trigger-based portfolio of actions— Ÿ The disruption is unfolding faster than the organization immediate and strategic—with a pragmatic can understand or interpret using the usual approaches, operating model to develop detailed plans and act such as an extensive strategic study on them COVID-19 fits these criteria, so a nerve center may help • Decide on strategic actions quickly after stress- companies quickly assess the situation and consider and testing of hypotheses and alternatives, ensuring choose plans of action, and execute those plans. adherence to company and societal values • Deliver in a disciplined, efficient way, keeping sufficient flexibility to adapt to the changing landscape McKinsey & Company 17

Current as of March 16, 2020 Example COVID-19 Response Structure: 5 teams, 18 workstreams See next slides Based on discussions with risk and health professionals and more than 200 companies across sectors 1 Policy & Management Portfolio of policies and actions incl. prevention and incident response 2 Two Way Communication Multi-channel communications | Confidential reporting mechanisms | Source of truth AWorkforce 3 Personnel & contractors Tiering (all/some/no WFH) | Infra setup (VPN, laptops, desktops) | Broadband availability protection 4 Facility & On-site norms Staggering work shifts/times | Prevention (e.g., Social distancing) | Closures 5 Health & Govt engagement Local & federal regulators and public health officials 1 Supplier engagement Cross-tier risk transparency | Supplier restart | Order mgmt. | New supplier qualifications 2 Inventory management Critical part identification | Parts rationing | Location optimization B Supply Chain 3 Production & Operations Operational impact assessment | Production capacity optimization COVID-19 Stabilization Integrated 4 Demand management S&OP SKU-level demand signal estimates by macro scenario | Production and sourcing plan Nerve 5 Logistics Ports | Logistics capacity pre-booking | Route optimization Center 1 B2B transparency Comms to B2B customers (e.g., microsite) | Scenario-based risk comms CCustomer 2 Customer protection Prevention interventions across customer journey | Cust. team training | Execution monitoring engagement 3 Customer outreach Customer comms re: COVID-practices | Fact-based reports on issues | Situation comms DStress-test 1 Scenario definition Relevant scenarios based on latest epidemiological & economic outlook financials 2 Financial stress tests Financials in different scenarios, especially working capital requirements 1 Issue map & management Single source of truth for issue resolution & tapping surge resources where needed E Operate 2 Portfolio of actions Trigger-based portfolio of actions (across all workstreams above) nerve center 3 Leadership alignment Align leaders on scenarios | Roundtable exercises McKinsey & Company 18

Current as of March 16, 2020 Example Nerve center for a pandemic response Executive team Scenarios Overall guidelines/ policies Leadership team Issue map Guides for frontline managers Medical | Security | Response lead Opercadence Medical advisory council Crisis Nerve Center PMO Comms+Reg Colleagues Supply Chain Real Estate Technology Financial Regulatory alignment Communicate across Disruption, restart Building management Work from home Financial stress-testing (e.g., dispensations) employee channels support (e.g., loans) Factory management execution/ infra 3rd party comms (e.g., to 2 way feedback Exposure across tiers Special employee partners) as required (ombuds, survey, email, Inventory mgmt. segment management call) (e.g., where WFH not possible) 1. Includes procurement, supply chain, and logistics McKinsey & Company 19

Current as of March 16, 2020 A: Organizations Checklist of things to consider policies, I. Policy & 1. Develop which adhere to public-health recommendations and workplace laws, including should consider Management those on sick leave, as well as business priorities/continuity remote working and who can access the workplace 2. Set policies for at what times (eg, how to protect staggering shifts, business-critical employees on site only) sign-off processes 3. Set for policy changes their workforce communication channels II. Two-way 1. Select and set protocols to communicate early and often Communication cascaded communications Overall policies should consider 2. Develop approach for to provide clarity and direction two-way communication 3. Establish and confidential reporting for employees safety first, especially for high official authorities 4. Use for information (eg, WHO and CDC) risk individuals, as well as how critical functions III. Personnel 1. Identify and tier and roles, including back-office functions to maintain business & contractors infrastructure needs 2. Assess for remote working or other flexible models (eg, VPN, broadband, operations laptops, remote desktop, etc.); consider piloting/testing system first to learn and adapt (eg, These should be in-line with everyone on multiday pilot, remote desktop trials with subset of employees) reporting and sign-off processes 3. Adapt to reduce loss of productivity (eg, devolved local health authority guidance responsibility); consider training managers on how to manage remotely adaptations required for collective bargaining units and regulatory requirements 4. Agree on (eg, unions, int’l work councils) contractors 5. Agree on policies and incentives with reduce transmission IV. Workplace & 1. Implement physical mechanisms to (eg, cleaning, staggering shifts) norms clarify accountability and authority 2. Communicate with site leaders/N-1 leaders to (eg, WFH)— err on side of agile and localized decision-making contingency plans 3. Define for workplace closures (eg, seating capacity in other buildings) health officials V. Health 1. Engage with to assess risk and response and Government providers and payors engagement 2. Collaborate with healthcare to access appropriate care for individuals (eg, health-plan hotline) 3. Collaborate with appropriate government officials and other regulatory bodies to inform and implement policies McKinsey & Company 20

Current as of March 16, 2020 A: Across these areas organizations are taking a range of actions Examples of actions Basic Moderate (includes Basic) Extensive (includes Basic and Moderate) I. Policies & Remind employees of sick policy and adapt as needed Expand sick-leave policy and primary caregiver policy Quarantine affected employees including C-suite Management Circulate guidelines for employees who recently travelled to high-risk Restrict non-essential travel as well large gatherings leadership areas or display symptoms Prepare detailed guidance for functions on regulatory Develop specific policies limiting gatherings to X number of Choose a lead and set a process to review policies requirements people Ask all locations to assess their risk and define potential actions Develop C-1 and C-2 contingency plans Collaborate with industry colleagues to share best practices II. Two-way Publish communications (regularly and in response to major events) Provide real-time communication channels, nurse hot-line, Cascade communications via site leaders/regional leaders Organizations Communication including who to contact with questions, policies on remote working and ombudsman support Develop a global central intranet page with updated should consult and travel, and resources on hygiene and health; assign Develop confidential and compliant self-reporting policies and information, automatic alerts from key sources, multidisciplinary comms. leads to control messaging across functions mechanisms guidance by region (linked to country guidance) with official Post hand-washing instructions and other hygiene resources in visible Provide regular updates from C-level or N-1 executives Provided information not only to employees and guidelines to locations such as bathrooms caregivers/family members on cases (while maintaining establish confidentiality and in-line with authorities) actions based III. Personnel Provide work-from-home options and infrastructure where feasible Encourage all non-direct labor to work remotely Enforce work from home for affected offices or functions on the severity Send tips on remote working Install VPN for employees; provide devices where needed Add redundancies for all critical enablers for remote or risk of the Collaborate with contractors on planning for outbreak Stagger work schedules to reduce crowding working (eg additional telecom subscription or laptops) Provide personal protective gear for select frontline workers where Ensure sick leave is understood by all employees including Develop tools to allow traveling/remote employees to situation and appropriate (eg, healthcare professionals) contractors assess risk and obtain guidance for specific territories consult with Develop contingency plans for all middle/back offices Provide guidance on productivity during WFH for field staff health for when they cannot conduct visits (eg, trainings) professionals IV. Workplace Identify and reduce risk factors for transmission (eg shared tools) Implement shifts to reduce overcrowding Temporarily close offices in highly affected areas & norms Sanitize common areas and workspace more frequently Restrict factory floor access; Restrict HQ access in Provide on-site health personnel to provide information and Multiple Provide hygiene supplies in key areas and encourage handwashing affected area to outside visitors answer questions and offer health checks at facilities guidelines are Limit cafeteria-style food and communal snacks Divide production facilities by splitting critical workforce Convert fingerprint access to retinal access to reduce provided by across different locations, sealing areas and doing transmission Increase ventilation by opening windows and ensuring filters are handovers without physical contact the WHO and replaced where needed Increase spacing between seating in cafeterias and CDC Encouraged non-handshake greetings & social distancing conference rooms Limit meeting sizes/conduct virtual meetings Develop manager accountability and plan for staffing (eg, hospitals, manufacturing) Health & Review WHO and local regulatory guidelines Develop a risk assessment in partnership with a health Conduct periodic testing with agency Government Identify nearest healthcare providers/testing sites and collaborate professional Engagement with health insurers Establish testing protocol with local regulatory bodies Source: Press search, organization interviews McKinsey & Company 21

Current as of March 16, 2020 A: Organizations should consult official health sources for information, guidance, and tools Examples provided; Please check online for latest information WHO CDC Local health authorities & adapted info Situation reports and information Overall prevention, business guidance, Overall information, business guidance, examples and industry guidance examples public poster examples https://www.who.int/news-room/q-a-detail/q-a-coronaviruses https://www.cdc.gov/coronavirus/2019-ncov/about/prevention.html https://www.nhs.uk/conditions/coronavirus-covid-19/ https://www.who.int/docs/default-source/coronaviruse/situation-reports/20200310- https://www.cdc.gov/coronavirus/2019-ncov/community/guidance-business- https://www.sfcdcp.org/infectious-diseases-a-to-z/coronavirus-2019-novel- sitrep-50-covid-19.pdf?sfvrsn=55e904fb_2 response.html?CDC_AA_refVal=https%3A%2F%2Fwww.cdc.gov%2Fcoronavirus%2F2 coronavirus/#links-and-documents-public 019-ncov%2Fspecific-groups%2Fguidance-business-response.html https://www.cdc.gov/coronavirus/2019-ncov/downloads/sick-with-2019-nCoV-fact- https://www.cdc.gov/coronavirus/2019-ncov/healthcare-facilities/prevent-spread-in- sheet-chinese.pdf long-term-care-facilities.html Source: CDC, WHO, NHS, SF Public Health Dept McKinsey & Company 22

Current as of March 16, 2020 n o Sick family Exposure Workforce ssi i member on the line on sick leave sm n An employee indicates One employee on the After a recent exposure, a r t that their family floor or call center the next day 60% of the A: Policies & h member recently tested tested positive for workforce call in sick g i positive for COVID-19 COVID-19 Management H and they were exposed Critical functions are At least 20 other now at risk They also recently individuals were exposed Organizations should attended the latest including some temp develop company- company retreat agents wide policies to each Colleague may Workforce C-Suite of these scenarios be sick remote symptoms Employee observes that Company has made The CEO and CFO both and work with local a colleague is starting to decision to make all recently came down with exhibit symptoms of employees in a site work possible symptoms leaders to tailor / illness; they have an remotely They are both in the underlying health All critical functions are same location, yet adapt condition and request to being performed offices exist around the work from home remotely, for the first world time High severity McKinsey & Company 23

Current as of March 16, 2020 1 Create transparency 3 Optimize production 4 Estimate realistic on multi-tier supply chain and distribution capacity final customer demand Determine critical components, Assess impact on operations and available Work with S&OP to get demand and determine origin of supply resource capacity (mainly workforce) signal to determine required supply Assess interruption risk and identify Ensure employee safety and clearly Leverage direct communication likely Tier 2+ risk communicate with employees channels with direct customer B: There are Look to alternative sources if Conduct scenario planning and assess impact Use market insights/external suppliers in severely affected on operations based on available capacity databases to estimate for multiple end- regions customer’s customers to-end immediate supply chain actions to Tier 2 supplier Tier 1 supplier Plant DC Customer Customer's consider in customers response Analyze available to COVID-19 2 inventory 5 Leverage available logistics capacity Estimate inventory along the value Estimate available logistics capacity for air/sea/road/rail chain, including spare parts/ re- Accelerate customs clearance manufactured stock Use after sales stock as bridge to Change mode of transport and pre-book air/rail capacity given keep production running current exposure Collaborate with all parties to jointly leverage freight capacity McKinsey & Company 24

Current as of March 16, 2020 B: Supply chain actions to consider in Continuously Kick off designing Build collaborative the next two to improve material resilient supply chain relationships with four months supply stability for the future external partners Evaluate alternative sourcing Establish a supply chain risk Work with public agencies to for all materials impacted – function explore opportunities for availability of suppliers, support additional cost due to Digitize process and tools to logistics, tariffs, estimated integrate demand, supply, and Engage investors and other component price increases capacity planning stakeholders to improve transparency and get help Enhance the demand Trigger the new supply verification process to correct network design for resilience inflated demand to mitigate the whiplash effect Codify the processes and tools created during the crisis Provide continuous support to management as formal small and mid-sized tier 2-3 documentation suppliers in financial trouble Convert war room into Assess regional risks for a reliable risk management current and backup suppliers process McKinsey & Company 25

s ent nt 01 02 03 04 Co COVID-19 Possible Actions for Leading The situation future companies indicator now scenarios to consider dashboards McKinsey & Company 26

Current as of March 16, 2020 Supply chains are being disrupted around the world, Impact High Medium but the full impacts have not yet been felt Low Supply – production Logistics – transportation Customer demand or or 5 80% plants restarted 2M idle containers 60% China flights suspended 60% truck staff available 90% decline in car sales Situation Across China, ex-Hubei, with large 8.8% of global container capacity Commercial flights account for 1-14 day quarantine- and China consumer sentiment sharply today enterprises restarting, albeit with affected by reduced demand ~50% of air cargo capacity, some capacity -induced increase in lower; online/express deliveries ~60% capacity, at much higher airlines converting flights for freight transport times up rate than smaller ones cargo6 52% BDI increase 2x TAC index MED MED Baltic Dry Index1 52% higher since TAC index rate +98% for US- Demand for express last-mile Europe & US sentiments evolving, 3 2 CLNY but at same level as China, +117% EU-China , +21% delivery has spiked in China due to but localized February 2019 China-US, and +2% for China-EU quarantine and social distancing 3 since CLNY 4 MED 7,000 TEU/wkreduction 5% global air traffic decrease High High What Parts and labor shortages leading Volumes will return as factories Decline in capacity available due Trucking capacity constraints in Demand slump may persist to expect to further SC disruptions (eg, restart, may see peak for restocks to travel ban on commercial flights China likely to ease Inventory “whiplash” - 7-8 weeks decreased production capacity) Future capacity 2.3% reduction for YoY global air freight belly Declines at US ports foreshadow for auto, 2-4 weeks for high-tech Other regions will be facing a Asia-US route from May due to capacity reduction of 14% in declines in US intermodal (rail) Inventory hoarding and demand production capacity reductions 4 sea freight alliance revisions March 2020 spikes due to uncoordinated Customer pressure for MED Rates likely to continue to actors exacerbate SC prioritization increase Impact on freight will take an extended period of time to correct with slower ramp-up Logistics capacity returns but faces constraints; near-term price increases 1. Assessment of risk premium to ship raw materials on a number of shipping routes, data as of 3/13 4. Estimated prior to implementation of EU-US travel ban 2. Frankfurt (FRA) to Shanghi (PVG) used as a proxy 5. Commercial flights from China 3. End of extended Chinese Lunar New Year holiday (2/7-3/13 for BDI, 2/10-3/2 6. Companies such as Cathay Pacific and Singapore Airlines now starting to fly for US-China TAC, 2/10-3/9 for other TAC routes) empty passenger aircrafts as dedicated cargo planes Source: Baidu, WSJ, Bloomberg, Alphaliner, Quartz, TAC index, IATA, Seabury Consulting, A.P. Moller-Maersk Group of Denmark, Agility Logistics McKinsey & Company 27

Current as of March 16, 2020 COVID-19 Leading indicator dashboard for China Tracking toward economic restart Hubei impact China economic restart China consumer confidence How deep is the impact, and when could economic When could economic activity restart in China When will Chinese consumer confidence activity restart? (ex-Hubei)? and purchasing activity return? Late Hubei remains deeply impacted; return Late Restart has begun, especially for larger companies, Consumer spending in China spend may lag Q2 to economic activity tough to foresee until mid Q1 despite challenges such as labor shortages and Q2 behind economic restart Q2 movement of goods Tourism and some other sectors impacted well into Q2 Recovery Daily infection Crude case Labor availability Return to work index Air PMI Congestion Earliest Example consumer 1 5 milestones rate, per million fatality ratio (movement of workers (largest manufacturing pollution manufact. in major cities school behavior metrics to major industrial cities by output in (NO2level) restarts (anecdotal) 2 3) Steady decline in provinces) mainland China confirmed cases 32% 14pt 90% Retail passenger car Jiangsu 7 Shenzhen 54% decline in decline Shenzhen 6 sales down 92% New suspected and 0.07 ~4.6% 11 Beijing4 in Feb 63% confirmed cases 65% Smartphone sales rates consistent 4 24% Beijing 71% 8 down 37% with other provinces Shandong Shanghai 57% 6 decline in 64% Spending on food & Quarantine lifted Shenzhen4 Shanghai 67% drinks down $60B >4x >4x Zhejiang 7 Chongqing 50% in January and Public transport 7 Nanjing 80% February resumes 69% 17 Guangdong 9 Wuhan 18% 6% Hotel occupancy Factory activity 8 Wuhan 54% down 80% returns to pre- outbreak levels ~1.1% 03/15/2020 <0.02 Same day 2019 03/03/2020 03/16/2020 Started with online lessons th Same day After March 15 Hubei China other (avg.) Small businesses face more labor disruption TBD Source: WHO Situation Reports; National Bureau of Statistics of China; McKinsey Global Institute; OCED Data, Johns Hopkins CSSE, press research, TomTom traffic index, Baidu QianXi, CDC, New York Times, Reuters, The Economist, Peking University HSBC Business School, Tencent News, Sina news, Beijing Environmental Protection Monitoring Center, Shenzhen Environment Network McKinsey & Company 28

Current as of March 16, 2020 COVID-19 Leading indicator dashboard Click on buttons for more detail Propagation of COVID-19 across new transmission complexes South-Asia (ex-China)1 Europe 2 Middle East Americas 1. Includes Western Pacific (excl China) and South-East Asia WHO regions 2. Eastern-Mediterranean WHO region Note: All countries or regions have documented 3rd generation cases Source: WHO Situation Reports, TomTom traffic index, Baidu QianXi, CDC, IATA, BBC, NYT, Japan Times, NPR, Reuters, press research McKinsey & Company 29

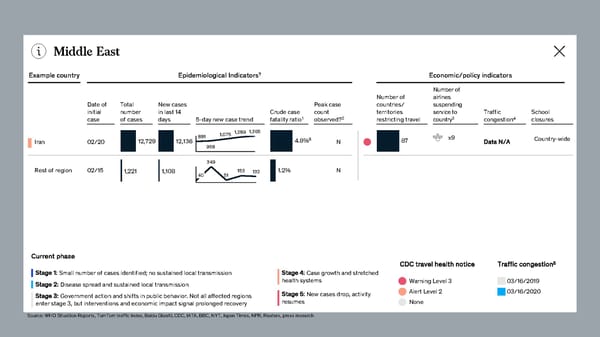
Middle East Example country Epidemiological Indicators7 Economic/policy indicators Number of Number of airlines Date of Total New cases Peak case countries/ suspending initial number in last 14 Crude case count territories service to Traffic School 1 2 3 4 case of cases days 5-day new case trend fatality ratio observed? restricting travel country congestion closures 1,075 1,289 1,365 Iran 02/20 12,729 12,136 881 4.8%6 N 87 x9 Data N/A Country-wide 958 349 Rest of region 02/15 1,221 1,108 40 51 153 132 1.2% N Current phase CDC travel health notice Traffic congestion5 Stage 1: Stage 4: Small number of cases identified; no sustained local transmission Case growth and stretched Stage 2: health systems Warning Level 3 03/16/2019 Disease spread and sustained local transmission Stage 5: Alert Level 2 03/16/2020 Stage 3: New cases drop, activity Government action and shifts in public behavior. Not all affected regions resumes None enter stage 3, but interventions and economic impact signal prolonged recovery Source: WHO Situation Reports, TomTom traffic index, Baidu QianXi, CDC, IATA, BBC, NYT, Japan Times, NPR, Reuters, press research McKinsey & Company

Europe Example country Epidemiological Indicators7 Economic/policy indicators Number of Number of airlines Date of Total New cases Peak case countries/ suspending initial number in last 14 Crude case count territories service to Traffic School 1 2 3 4 case of cases days 5-day new case trend fatality ratio observed? restricting travel country congestion closures 2,651 2,547 3,497 x 18 74 Country-wide 6 Italy 01/31 21,157 20,029 977 2,313 6.8% N 94 10 495 591 780 829 74 France 01/25 4,469 4,369 372 2.0% N 55 Country-wide 25 802 693 733 56 Germany 01/28 3,795 3,738 157 271 0.2% N 52 45 Local 825 1,266 1,522 59 Spain 02/01 5,753 5,708 615 501 2.4% N 49 Country-wide 5 Rest of region 01/29 9,900 9,754 8771,192 1,125 2,086 2,222 0.6% N Current phase CDC travel health notice Traffic congestion5 Stage 1: Stage 4: Small number of cases identified; no sustained local transmission Case growth and stretched Stage 2: health systems Warning Level 3 03/16/2019 Disease spread and sustained local transmission Stage 5: Alert Level 2 03/16/2020 Stage 3: New cases drop, activity Government action and shifts in public behavior. Not all affected regions resumes None enter stage 3, but interventions and economic impact signal prolonged recovery Source: WHO Situation Reports, TomTom traffic index, Baidu QianXi, CDC, IATA, BBC, NYT, Japan Times, NPR, Reuters, press research McKinsey & Company

Americas Example country Epidemiological Indicators7 Economic/policy indicators Number of Number of airlines Date of Total New cases Peak case countries/ suspending initial number in last 14 Crude case count territories service to Traffic School 1 2 3 4 case of cases days 5-day new case trend fatality ratio observed? restricting travel country congestion closures 291 277 414 Local US 01/23 224 N 59 5 1,678 1,616 0 2.4% 28 16 245 Rest of region 01/27 699 677 49 105 122 0.7% N 16 Current phase CDC travel health notice Traffic congestion5 Stage 1: Stage 4: Small number of cases identified; no sustained local transmission Case growth and stretched Stage 2: health systems Warning Level 3 03/16/2019 Disease spread and sustained local transmission Stage 5: Alert Level 2 03/16/2020 Stage 3: New cases drop, activity Government action and shifts in public behavior. Not all affected regions resumes None enter stage 3, but interventions and economic impact signal prolonged recovery Source: WHO Situation Reports, TomTom traffic index, Baidu QianXi, CDC, IATA, BBC, NYT, Japan Times, NPR, Reuters, press research McKinsey & Company

South-Asia (ex-China) Example country Epidemiological Indicators7 Economic/policy indicators Number of Number of airlines Date of Total New cases Peak case countries/ suspending initial number in last 14 Crude case count territories service to Traffic School 1 2 3 4 case of cases days 5-day new case trend fatality ratio observed? restricting travel country congestion closures Prior to 242 x 13 Country-wide South Korea 01/20 8,162 4,426 114 110 107 76 0.9% N 86 Data N/A Prior to 54 52 55 41 64 63 Japan 01/20 780 541 2.8% N 48 Country-wide 47 12 9 13 12 59 Singapore 01/24 212 110 6 0% N 42 Not noted 24 Prior to 206 241 Rest of region 01/20 1,033 906 87 61 30 1.1% N Current phase CDC travel health notice Traffic congestion5 Stage 1: Stage 4: Small number of cases identified; no sustained local transmission Case growth and stretched Stage 2: health systems Warning Level 3 03/16/2019 Disease spread and sustained local transmission Stage 5: Alert Level 2 03/16/2020 Stage 3: New cases drop, activity Government action and shifts in public behavior. Not all affected regions resumes None enter stage 3, but interventions and economic impact signal prolonged recovery Source: WHO Situation Reports, TomTom traffic index, Baidu QianXi, CDC, IATA, BBC, NYT, Japan Times, NPR, Reuters, press research McKinsey & Company

References COVID-19 Leading indicator dashboard for China 1. Case fatality ratio calculated as (deaths on day X) / (cases on day X). Previous versions of this dashboard calculated CFR = (deaths on day X)/ (cases on day X-7) to account for incubation. 2. Measures movement of population into destinations as of 3/15/2020 3. Wuhan included only for comparison 4. 7-day average (9-Mar to 16-Mar) compared to 2019 5. Car traffic only. Congestion reflects % increase in travel time compared to free-flow conditions Note: All countries and regions have documented third-generation cases Region-specific details 1. Case fatality rate calculated as (deaths on day X) / (cases on day X). Dashboards before February 29 calculated CFR as (deaths on day X)/ (cases on day X-7) to account for incubation. 2. Assessment based on observed stoppage in growth of cases and medical community’s opinion validated by external sources 3. Anecdotal reports of airline suspensions based on press searches 4. Based on representative cities: Tokyo, Singapore, Milan, Paris, Berlin, Madrid, Los Angeles 5. 0 new reported cases in US on 3/15 likely a reporting anomaly and not indicative of overall trend 6. Crude case fatality ratio likely to fall as testing becomes more widely available 7. Epidemiological data current as of 3/15 WHO Situation Report Note: All countries or regions have documented third-generation cases McKinsey & Company 34