Untitled
As the complexity of JavaScript applications increase, developers need powerful debugging tools to help quickly discover the cause of an issue and fix it efficiently. The Chrome DevTools include a number of useful tools to help make debugging JavaScript less painful.
In this section, we will walk through how to use these tools by debugging the Google Closure hovercard demo and other dynamic examples in this page.
Note: If you are a Web Developer and want to get the latest version of DevTools, you should use Chrome Canary.
Contents
The Sources Panel
The Sources panel lets you debug your JavaScript code. It provides a graphical interface to the V8 debugger. Follow the steps below to explore the Sources panel:
- Open Google Closure hovercard demo page.
- Open the DevTools window as described in the How to Access the DevTools section of this tutorial.
- If it is not already selected, select Sources.

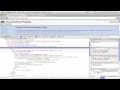
The Sources panel lets you see all the scripts that are part of the inspected page. Standard controls to pause, resume, and step through code are provided below the panel selection icons. A button to force a pause at exceptions is located at the bottom of the window. Sources are visible in separate tabs and clicking opens the file navigator which will display all open scripts.

Execution control
The execution control buttons are located at the top of the side panels and allow you to step through code. The buttons available are:
 Continue: continues code execution until we encounter another breakpoint.
 Step over: step through code line-by-line to get insights into how each line affects the variables being updated. Should your code call another function, the debugger won't jump into its code, instead stepping over so that the focus remains on the current function.
 Step into: like Step over, however clicking Step into at the function call will cause the debugger to move its execution to the first line in the functions definition.
 Step out: having stepped into a function, clicking this will cause the remainder of the function definition to be run and the debugger will move its execution to the parent function.
 Toggle breakpoints: toggles breakpoints on/off while leaving their enabled states intact.
There are also several related keyboard shortcuts available in the Sources panel:
- Continue: F8 or Command-/ (forward slash) on Mac or Control-/ (forward slash) on other platforms.
- Step over: F10 or Command-' (apostrophe) on Mac or Control-' (apostrophe) on other platforms.
- Step into: F11 or Command-; (semi-colon) on Mac or Control-; (semi-colon); on other platforms.
- Step out: Shift-F11 or Shift-Command-; (semi-colon) on Mac or Shift-Control-; (semi-colon) on other platforms.
- Next call frame: Control-. (period) on all platforms.
- Previous call frame: Control-, (comma) on all platforms.
For a walkthrough of other keyboard shortcuts supported, see .
Debugging With Breakpoints
A breakpoint is an intentional stopping or pausing place in a script, put in place for debugging purposes. Let's look at debugging JavaScript using breakpoints set on JavaScript code and breakpoints targeted at UI and network aspects of an application.
Workflow
First, open the DevTools by hitting the Control-Shift-I shortcut. Click the line gutter to set a breakpoint for that line of code, select another script and set another breakpoint.

All the breakpoints you have set appear under Breakpoints in the right-hand sidebar. Breakpoints can be enabled or disabled using the checkboxes in this sidebar.

Clicking on the entry jumps to the highlighted line in the source file. You can set one or more breakpoints in one or more scripts.

Delete a breakpoint by clicking the blue tag breakpoint indicator. The breakpoint indicator menu has several options including "Continue to here", "Edit Breakpoint", "Disable Breakpoint" and "Save As", which will save the file locally.

Once you have set a breakpoint, you can right-click on the blue arrow tag indicator in the gutter line to set a conditional statement for that specific breakpoint. Type any expression and the breakpoint will pause only if the condition is true. The tag cycles through its three states of active, inactive, and removed.

Click the Pause button then move your mouse over the Google Closure hovercard demo page.

While a script is paused, you can see the current call stack and in-scope variables in the right-hand side bar. The call stack displays the complete execution path that led to the point where code was paused, giving us insights into the code flaws that caused the error.
You may also open up the console to experiment while paused. Hit the Esc key to bring the console into view. Remember: the console will be evaluating within the scope of where the debugger is currently paused.

Remember, if your code happens to be using a loop which fires every 20ms, you likely won't want the debugger to halt on each iteration. Using conditional statements/breakpoints can assist with this. In the below example, code execution will only break if the minLevel variable is greater than 2004, helping us avoid a number of additional clicks in the debugger.

Note: It may not be desirable to set breakpoints from the DevTools interface. Should you wish to launch the debugger from your code, you may use the debugger keyword to achieve this.
Using Breakpoints
Make sure the Sources panel is open and select "script.js" from scripts drop-down
- Set a breakpoint on line 8 by clicking the line gutter (you can use the Control-G shortcut to reveal a line in a large file)
- Move your mouse over this page
- You should stop on the breakpoint
- Hover over the source code to inspect local and global variables, function arguments etc.
- Delete the breakpoint by clicking the blue tag breakpoint indicator
- Click the Continue
 button or hit F8 in DevTools window to resume

Breakpoints in Dynamic JavaScript
Note: Notice the "//@ sourceURL=dynamicScript.js" line at the end of dynamicScript.js file. This technique gives a name to a script created with eval, and will be discussed in more detail in the Source Maps section. Breakpoints can be set in dynamic JavaScript only if it has a user supplied name.
Pause on Next JavaScript Statement
Pause on Exceptions
Pause on Uncaught Exceptions
Breakpoints on DOM Mutation Events
Breakpoints on XHR
Note: To edit URL filter, double click on the XHR breakpoint entry in XHR Breakpoints sidebar pane. XHR breakpoint with empty URL filter will match any XHR.
Breakpoints on JavaScript Event Listeners
Note: Following events are supportedKeyboard: keydown, keypress, keyup, textInput
Mouse: click, dblclick, mousedown, mouseup, mouseover, mousemove, mouseout, mousewheel
Control: resize, scroll, zoom, focus, blur, select, change, submit, reset
Clipboard: copy, cut, paste, beforecopy, beforecut, beforepaste
Load: load, unload, abort, error
DOM Mutation: DOMActivate, DOMFocusIn, DOMFocusOut, DOMAttrModified, DOMCharacterDataModified, DOMNodeInserted, DOMNodeInsertedIntoDocument, DOMNodeRemoved, DOMNodeRemovedFromDocument, DOMSubtreeModified, DOMContentLoaded
Device: deviceorientation, devicemotion
Live Editing
In Authoring And Workflow, we discussed how to make changes to scripts in the Sources panel. While at a breakpoint, it's also possible to live edit scripts by clicking into the main editor panel and making modifications.
- Navigate to the Google Closure hovercard demo
- In the Sources panel, open up "mouse.js" and use the Ctrl/Cmd + Shift + O to navigate to the onMouseOut() function

- Click the pause button to pause debugging
- Modify the function, adding a console.log('Moused out') to the end
- Using the Cmd +S or Ctrl + S shortcuts will save these modifications. Make sure to Save As.
- Click the pause/resume button to resume execution
- When you now hover out, the new message will be logged to the console

This allows you to saved changes from within the DevTools without having to leave your browser.
Exceptions
Let's now look at how to deal with exceptions and stack traces using Chrome DevTools.
Exception handling is the process of responding to the occurrence of exceptions - exceptional situations that require special processing - often changing the normal flow of your JavaScript code's execution.
Note: If you are a Web Developer and want to get the latest version of DevTools, you should use Chrome Canary.
Tracking exceptions
When something goes wrong, you can open the DevTools console (Ctrl+Shift+J / Cmd+Option+J) and find a number of JavaScript error messages there. Each message has a link to the file name with the line number you can navigate to.

Viewing exception stack trace
There might be several execution paths that lead to the error and it's not always obvious which one of them has happened. Once DevTools window is opened, exceptions in the console are accompanied with the complete JavaScript call stacks. You can expand these console messages to see the stack frames and navigate to the corresponding locations in the code:

Pause on JavaScript exceptions
You may also want to pause JavaScript execution next time exception is thrown and inspect its call stack, scope variables and state of your app. A tri-state stop button (  ) at the bottom of the Scripts panel enables you to switch between different exception handling modes: you can choose to either pause on all exception or only on the uncaught ones or you can ignore exceptions altogether.

Printing stack traces
Printing log messages to the DevTools console may be very helpful in understanding how your application behaves. You can make the log entries even more informative by including associated stack traces. There are several ways of doing that.
Error.stack
Each Error object has a string property named stack that contains the stack trace:

console.trace()
You can instrument your code with console.trace() calls that would print current JavaScript call stacks:

console.assert()
There is also a way to place assertion in your JavaScript code. Just call console.assert() with the error condition as the first parameter. Whenever this expression evaluates to false you will see a corresponding console record:

Handling exceptions at runtime using window.onerror
Chrome supports setting a handler function to window.onerror. Whenever a JavaScript exception is thrown in the window context and is not caught by any try/catch block, the function will be invoked with the exception's message, the URL of the file where the exception was thrown and the line number in that file passed as three arguments in that order. You may find it convenient to set an error handler that would collect information about uncaught exceptions and report it back to your server.

Pretty Print
If you have trouble trying to read and debug minified JavaScript in the DevTools, a pretty printing option is available to make life easier. Here is how a minified script displayed in the tools might look prior to being displayed in the DevTools:

And by clicking on the curly brace  ("Pretty Print") icon in the bottom left corner, the JavaScript is transformed into a more human readable form. This is also more easy for debugging and setting breakpoints.

Source Maps
Have you ever found yourself wishing you could keep your client-side code readable and more importantly debuggable even after you've combined and minified it, without impacting performance? Well now you can through the magic of source maps.
Source Maps are a generic mapping format (that are JSON-based) which can be used by any processed file to create relations between files that are pre-processed and those that are post-processed. Of most relevance to us is that they can be used to map combined/minified scripts back to an unbuilt state for debugging.
A source map itself can look as simple as the following:
  {
    version : 3,
    file: "out.js",
    sourceRoot : "",
    sources: ["foo.js", "bar.js"],
    names: ["src", "maps", "are", "fun"],
    mappings: "AAgBC,SAAQ,CAAEA"
}
The idea is when you build for production, along with minifying and combining your JavaScript files, you generate a source map which holds information about your original files. When you query a certain line and column number in your generated JavaScript you can do a lookup in the source map which returns the original location. The DevTools can parse the source map automatically and make it appear as though you're running unminified and uncombined files.

Before you view the following real world implementation of Source Maps make sure you've enabled the Source Maps feature by clicking the settings cog in the dev tools panel and checking the "Enable source maps" option.

Take a look at the special build of the font dragr tool in Chrome, with source mapping enabled, and you'll notice that the JavaScript isn't compiled and you can see all the individual JavaScript files it references. This is using source mapping, but behind the scenes actually running the compiled code. Any errors, logs and breakpoints will map to the dev code for awesome debugging! So in effect it gives you the illusion that you're running a dev site in production.
How do Source Maps work?
Once you've combined and minified your JavaScript with a tool that supports outputting Source Maps, alongside it will exist a sourcemap file. At present, Closure Compiler and UglifyJS 2.0 are two such tools for achieving this but there are also tools available that support outputting Source Maps for CoffeeScript and SASS. A special comment is placed at the end of the file, signifying to the DevTools that a source map is available.
//@ sourceMappingURL=/path/to/file.js.map This enables DevTools to map calls back to their location in original source files. If you don't like the idea of the weird comment you can alternatively set a special header on your compiled JavaScript file:
X-SourceMap: /path/to/file.js.map Like the comment this will tell your source map consumer where to look for the source map associated with a JavaScript file. This header also gets around the issue of referencing Source Maps in languages that don't support single-line comments.
@sourceURL and displayName in action
While not part of the source map spec the following convention allows you to make development much easier when working with evals.
This helper looks very similar to the //@ sourceMappingURL property and is actually mentioned in the source map V3 specifications. By including the following special comment in your code, which will be evaled, you can name evals so they appear as more logical names in your dev tools.
//@ sourceURL=source.coffee Working with sourceURL
- Navigate to the demo
- Open the DevTools and go to the Sources panel.
- Enter in a filename into the Name your code: input field.
- Click on the compile button.
- An alert will appear with the evaluated sum from the CoffeeScript source
- If you expand the Sources sub-panel you will now see a new file with the custom filename you entered earlier. If you double-click to view this file it will contain the compiled JavaScript for our original source. On the last line however will be a
// @sourceURLcomment indicating what the original source file was. This can greatly help with debugging when working with language abstractions.

Read more
- Conditional breakpoints
- Working With Source Maps
As the complexity of JavaScript applications increase, developers need powerful debugging tools to help quickly discover the cause of an issue and fix it efficiently. The Chrome DevTools include a number of useful tools to help make debugging JavaScript less painful.
In this section, we will walk through how to use these tools by debugging the Google Closure hovercard demo and other dynamic examples in this page.
Note: If you are a Web Developer and want to get the latest version of DevTools, you should use Chrome Canary.
Contents
The Sources Panel
The Sources panel lets you debug your JavaScript code. It provides a graphical interface to the V8 debugger. Follow the steps below to explore the Sources panel:
- Open Google Closure hovercard demo page.
- Open the DevTools window as described in the How to Access the DevTools section of this tutorial.
- If it is not already selected, select Sources.
The Sources panel lets you see all the scripts that are part of the inspected page. Standard controls to pause, resume, and step through code are provided below the panel selection icons. A button to force a pause at exceptions is located at the bottom of the window. Sources are visible in separate tabs and clicking opens the file navigator which will display all open scripts.
Execution control
The execution control buttons are located at the top of the side panels and allow you to step through code. The buttons available are:
Continue: continues code execution until we encounter another breakpoint.
Step over: step through code line-by-line to get insights into how each line affects the variables being updated. Should your code call another function, the debugger won't jump into its code, instead stepping over so that the focus remains on the current function.
Step into: like Step over, however clicking Step into at the function call will cause the debugger to move its execution to the first line in the functions definition.
Step out: having stepped into a function, clicking this will cause the remainder of the function definition to be run and the debugger will move its execution to the parent function.
Toggle breakpoints: toggles breakpoints on/off while leaving their enabled states intact.
There are also several related keyboard shortcuts available in the Sources panel:
- Continue: F8 or Command-/ (forward slash) on Mac or Control-/ (forward slash) on other platforms.
- Step over: F10 or Command-' (apostrophe) on Mac or Control-' (apostrophe) on other platforms.
- Step into: F11 or Command-; (semi-colon) on Mac or Control-; (semi-colon); on other platforms.
- Step out: Shift-F11 or Shift-Command-; (semi-colon) on Mac or Shift-Control-; (semi-colon) on other platforms.
- Next call frame: Control-. (period) on all platforms.
- Previous call frame: Control-, (comma) on all platforms.
For a walkthrough of other keyboard shortcuts supported, see .
Debugging With Breakpoints
A breakpoint is an intentional stopping or pausing place in a script, put in place for debugging purposes. Let's look at debugging JavaScript using breakpoints set on JavaScript code and breakpoints targeted at UI and network aspects of an application.
Workflow
First, open the DevTools by hitting the Control-Shift-I shortcut. Click the line gutter to set a breakpoint for that line of code, select another script and set another breakpoint.
All the breakpoints you have set appear under Breakpoints in the right-hand sidebar. Breakpoints can be enabled or disabled using the checkboxes in this sidebar.
Clicking on the entry jumps to the highlighted line in the source file. You can set one or more breakpoints in one or more scripts.
Delete a breakpoint by clicking the blue tag breakpoint indicator. The breakpoint indicator menu has several options including "Continue to here", "Edit Breakpoint", "Disable Breakpoint" and "Save As", which will save the file locally.
Once you have set a breakpoint, you can right-click on the blue arrow tag indicator in the gutter line to set a conditional statement for that specific breakpoint. Type any expression and the breakpoint will pause only if the condition is true. The tag cycles through its three states of active, inactive, and removed.
Click the Pause button then move your mouse over the Google Closure hovercard demo page.
While a script is paused, you can see the current call stack and in-scope variables in the right-hand side bar. The call stack displays the complete execution path that led to the point where code was paused, giving us insights into the code flaws that caused the error.
You may also open up the console to experiment while paused. Hit the Esc key to bring the console into view. Remember: the console will be evaluating within the scope of where the debugger is currently paused.
Remember, if your code happens to be using a loop which fires every 20ms, you likely won't want the debugger to halt on each iteration. Using conditional statements/breakpoints can assist with this. In the below example, code execution will only break if the minLevel variable is greater than 2004, helping us avoid a number of additional clicks in the debugger.
Note: It may not be desirable to set breakpoints from the DevTools interface. Should you wish to launch the debugger from your code, you may use the debugger keyword to achieve this.
Using Breakpoints
Make sure the Sources panel is open and select "script.js" from scripts drop-down
- Set a breakpoint on line 8 by clicking the line gutter (you can use the Control-G shortcut to reveal a line in a large file)
- Move your mouse over this page
- You should stop on the breakpoint
- Hover over the source code to inspect local and global variables, function arguments etc.
- Delete the breakpoint by clicking the blue tag breakpoint indicator
- Click the Continue button or hit F8 in DevTools window to resume
Breakpoints in Dynamic JavaScript
Note: Notice the "//@ sourceURL=dynamicScript.js" line at the end of dynamicScript.js file. This technique gives a name to a script created with eval, and will be discussed in more detail in the Source Maps section. Breakpoints can be set in dynamic JavaScript only if it has a user supplied name.
Pause on Next JavaScript Statement
Pause on Exceptions
Pause on Uncaught Exceptions
Breakpoints on DOM Mutation Events
Breakpoints on XHR
Note: To edit URL filter, double click on the XHR breakpoint entry in XHR Breakpoints sidebar pane. XHR breakpoint with empty URL filter will match any XHR.
Breakpoints on JavaScript Event Listeners
Note: Following events are supportedKeyboard: keydown, keypress, keyup, textInput
Mouse: click, dblclick, mousedown, mouseup, mouseover, mousemove, mouseout, mousewheel
Control: resize, scroll, zoom, focus, blur, select, change, submit, reset
Clipboard: copy, cut, paste, beforecopy, beforecut, beforepaste
Load: load, unload, abort, error
DOM Mutation: DOMActivate, DOMFocusIn, DOMFocusOut, DOMAttrModified, DOMCharacterDataModified, DOMNodeInserted, DOMNodeInsertedIntoDocument, DOMNodeRemoved, DOMNodeRemovedFromDocument, DOMSubtreeModified, DOMContentLoaded
Device: deviceorientation, devicemotion
Live Editing
In Authoring And Workflow, we discussed how to make changes to scripts in the Sources panel. While at a breakpoint, it's also possible to live edit scripts by clicking into the main editor panel and making modifications.
- Navigate to the Google Closure hovercard demo
- In the Sources panel, open up "mouse.js" and use the Ctrl/Cmd + Shift + O to navigate to the onMouseOut() function
- Click the pause button to pause debugging
- Modify the function, adding a console.log('Moused out') to the end
- Using the Cmd +S or Ctrl + S shortcuts will save these modifications. Make sure to Save As.
- Click the pause/resume button to resume execution
- When you now hover out, the new message will be logged to the console
This allows you to saved changes from within the DevTools without having to leave your browser.
Exceptions
Let's now look at how to deal with exceptions and stack traces using Chrome DevTools.
Exception handling is the process of responding to the occurrence of exceptions - exceptional situations that require special processing - often changing the normal flow of your JavaScript code's execution.
Note: If you are a Web Developer and want to get the latest version of DevTools, you should use Chrome Canary.
Tracking exceptions
When something goes wrong, you can open the DevTools console (Ctrl+Shift+J / Cmd+Option+J) and find a number of JavaScript error messages there. Each message has a link to the file name with the line number you can navigate to.
Viewing exception stack trace
There might be several execution paths that lead to the error and it's not always obvious which one of them has happened. Once DevTools window is opened, exceptions in the console are accompanied with the complete JavaScript call stacks. You can expand these console messages to see the stack frames and navigate to the corresponding locations in the code:
Pause on JavaScript exceptions
You may also want to pause JavaScript execution next time exception is thrown and inspect its call stack, scope variables and state of your app. A tri-state stop button ( ) at the bottom of the Scripts panel enables you to switch between different exception handling modes: you can choose to either pause on all exception or only on the uncaught ones or you can ignore exceptions altogether.
Printing stack traces
Printing log messages to the DevTools console may be very helpful in understanding how your application behaves. You can make the log entries even more informative by including associated stack traces. There are several ways of doing that.
Error.stack
Each Error object has a string property named stack that contains the stack trace:
console.trace()
You can instrument your code with console.trace() calls that would print current JavaScript call stacks:
console.assert()
There is also a way to place assertion in your JavaScript code. Just call console.assert() with the error condition as the first parameter. Whenever this expression evaluates to false you will see a corresponding console record:
Handling exceptions at runtime using window.onerror
Chrome supports setting a handler function to window.onerror. Whenever a JavaScript exception is thrown in the window context and is not caught by any try/catch block, the function will be invoked with the exception's message, the URL of the file where the exception was thrown and the line number in that file passed as three arguments in that order. You may find it convenient to set an error handler that would collect information about uncaught exceptions and report it back to your server.
Pretty Print
If you have trouble trying to read and debug minified JavaScript in the DevTools, a pretty printing option is available to make life easier. Here is how a minified script displayed in the tools might look prior to being displayed in the DevTools:
And by clicking on the curly brace ("Pretty Print") icon in the bottom left corner, the JavaScript is transformed into a more human readable form. This is also more easy for debugging and setting breakpoints.
Source Maps
Have you ever found yourself wishing you could keep your client-side code readable and more importantly debuggable even after you've combined and minified it, without impacting performance? Well now you can through the magic of source maps.
Source Maps are a generic mapping format (that are JSON-based) which can be used by any processed file to create relations between files that are pre-processed and those that are post-processed. Of most relevance to us is that they can be used to map combined/minified scripts back to an unbuilt state for debugging.
A source map itself can look as simple as the following:
  {
    version : 3,
    file: "out.js",
    sourceRoot : "",
    sources: ["foo.js", "bar.js"],
    names: ["src", "maps", "are", "fun"],
    mappings: "AAgBC,SAAQ,CAAEA"
}
The idea is when you build for production, along with minifying and combining your JavaScript files, you generate a source map which holds information about your original files. When you query a certain line and column number in your generated JavaScript you can do a lookup in the source map which returns the original location. The DevTools can parse the source map automatically and make it appear as though you're running unminified and uncombined files.
Before you view the following real world implementation of Source Maps make sure you've enabled the Source Maps feature by clicking the settings cog in the dev tools panel and checking the "Enable source maps" option.
Take a look at the special build of the font dragr tool in Chrome, with source mapping enabled, and you'll notice that the JavaScript isn't compiled and you can see all the individual JavaScript files it references. This is using source mapping, but behind the scenes actually running the compiled code. Any errors, logs and breakpoints will map to the dev code for awesome debugging! So in effect it gives you the illusion that you're running a dev site in production.
How do Source Maps work?
Once you've combined and minified your JavaScript with a tool that supports outputting Source Maps, alongside it will exist a sourcemap file. At present, Closure Compiler and UglifyJS 2.0 are two such tools for achieving this but there are also tools available that support outputting Source Maps for CoffeeScript and SASS. A special comment is placed at the end of the file, signifying to the DevTools that a source map is available.
//@ sourceMappingURL=/path/to/file.js.map This enables DevTools to map calls back to their location in original source files. If you don't like the idea of the weird comment you can alternatively set a special header on your compiled JavaScript file:
X-SourceMap: /path/to/file.js.map Like the comment this will tell your source map consumer where to look for the source map associated with a JavaScript file. This header also gets around the issue of referencing Source Maps in languages that don't support single-line comments.
@sourceURL and displayName in action
While not part of the source map spec the following convention allows you to make development much easier when working with evals.
This helper looks very similar to the //@ sourceMappingURL property and is actually mentioned in the source map V3 specifications. By including the following special comment in your code, which will be evaled, you can name evals so they appear as more logical names in your dev tools.
//@ sourceURL=source.coffee Working with sourceURL
- Navigate to the demo
- Open the DevTools and go to the Sources panel.
- Enter in a filename into the Name your code: input field.
- Click on the compile button.
- An alert will appear with the evaluated sum from the CoffeeScript source
- If you expand the Sources sub-panel you will now see a new file with the custom filename you entered earlier. If you double-click to view this file it will contain the compiled JavaScript for our original source. On the last line however will be a
// @sourceURLcomment indicating what the original source file was. This can greatly help with debugging when working with language abstractions.
Read more
- Conditional breakpoints
- Working With Source Maps