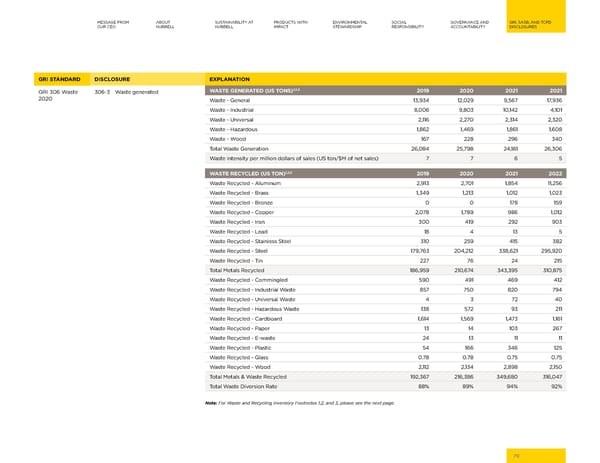
MESSAGE FROM ABOUT SUSTAINABILITY AT PRODUCTS WITH ENVIRONMENTAL SOCIAL GOVERNANCE AND GRI, SASB, AND TCFD OUR CEO HUBBELL HUBBELL IMPACT STEWARDSHIP RESPONSIBILITY ACCOUNTABILITY DISCLOSURES GRI STANDARD DISCLOSURE EXPLANATION 1,2,3 GRI 306 Waste 306-3 Waste generated WASTE GENERATED (US TONS) 2019 2020 2021 2021 2020 Waste - General 13,934 12,029 9,567 17,936 Waste - Industrial 8,006 9,803 10,142 4,101 Waste - Universal 2,116 2,270 2,314 2,320 Waste - Hazardous 1,862 1,469 1,861 1,608 Waste - Wood 167 228 296 340 Total Waste Generation 26,084 25,798 24,181 26,306 Waste intensity per million dollars of sales (US ton/$M of net sales) 7 7 6 5 1,2,3 WASTE RECYCLED (US TON) 2019 2020 2021 2022 Waste Recycled - Aluminum 2,913 2,701 1,854 11,256 Waste Recycled - Brass 1,349 1,213 1,012 1,023 Waste Recycled - Bronze 0 0 178 159 Waste Recycled - Copper 2,078 1,789 986 1,012 Waste Recycled - Iron 300 419 292 903 Waste Recycled - Lead 18 4 13 5 Waste Recycled - Stainless Steel 310 259 415 382 Waste Recycled - Steel 179,763 204,212 338,621 295,920 Waste Recycled - Tin 227 76 24 215 Total Metals Recycled 186,959 210,674 343,395 310,875 Waste Recycled - Commingled 590 491 469 412 Waste Recycled - Industrial Waste 857 750 820 794 Waste Recycled - Universal Waste 4 3 72 40 Waste Recycled - Hazardous Waste 138 572 93 211 Waste Recycled - Cardboard 1,614 1,569 1,473 1,161 Waste Recycled - Paper 13 14 103 267 Waste Recycled - E-waste 24 13 11 11 Waste Recycled - Plastic 54 166 346 125 Waste Recycled - Glass 0.78 0.78 0.75 0.75 Waste Recycled - Wood 2,112 2,134 2,898 2,150 Total Metals & Waste Recycled 192,367 216,386 349,680 316,047 Total Waste Diversion Rate 88% 89% 94% 92% Note: For Waste and Recycling Inventory Footnotes 1,2, and 3, please see the next page. 70
 Hubbell 2023 Sustainability Report Page 69 Page 71