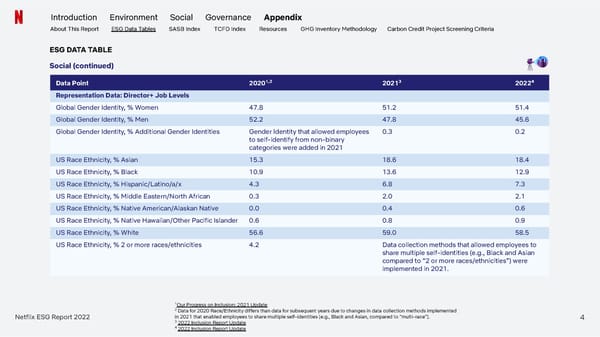
Introduction Environment Social Governance Appendix About This Report ESG Data Tables SASB Index TCFD Index Resources GHG Inventory Methodology Carbon Credit Project Screening Criteria ESG DATA TABLE Social (continued) ,2 3 4 Data Point 2020¹ 2021 2022 Representation Data: Director+ Job Levels Global Gender Identity, % Women 47.8 51.2 51.4 Global Gender Identity, % Men 52.2 47.8 45.6 Global Gender Identity, % Additional Gender Identities Gender Identity that allowed employees 0.3 0.2 to self-identify from non-binary categories were added in 2021 US Race Ethnicity, % Asian 15.3 18.6 18.4 US Race Ethnicity, % Black 10.9 13.6 12.9 US Race Ethnicity, % Hispanic/Latino/a/x 4.3 6.8 7.3 US Race Ethnicity, % Middle Eastern/North African 0.3 2.0 2.1 US Race Ethnicity, % Native American/Alaskan Native 0.0 0.4 0.6 US Race Ethnicity, % Native Hawaiian/Other Pacific Islander 0.6 0.8 0.9 US Race Ethnicity, % White 56.6 59.0 58.5 US Race Ethnicity, % 2 or more races/ethnicities 4.2 Data collection methods that allowed employees to share multiple self-identities (e.g., Black and Asian compared to “2 or more races/ethnicities”) were implemented in 2021. ¹Our Progress on Inclusion: 2021 Update 2 Data for 2020 Race/Ethnicity differs than data for subsequent years due to changes in data collection methods implemented in 2021 that enabled employees to share multiple self-identities (e.g., Black and Asian, compared to “multi-race”). Netflix ESG Report 2022 4 3 2022 Inclusion Report Update 4 2022 Inclusion Report Update
 Netflix 2022 ESG Report Page 65 Page 67