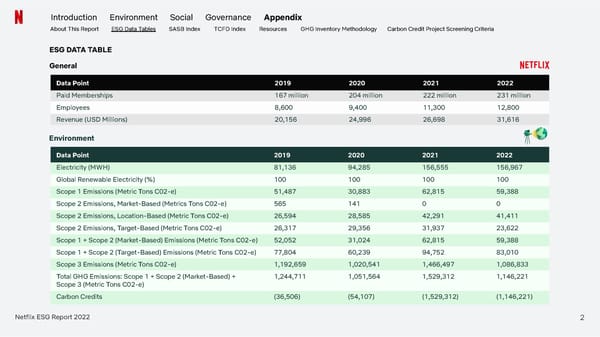
Introduction Environment Social Governance Appendix About This Report ESG Data Tables SASB Index TCFD Index Resources GHG Inventory Methodology Carbon Credit Project Screening Criteria ESG DATA TABLE General Data Point 2019 2020 2021 2022 Paid Memberships 167 million 204 million 222 million 231 million Employees 8,600 9,400 11,300 12,800 Revenue (USD Millions) 20,156 24,996 26,698 31,616 Environment Data Point 2019 2020 2021 2022 Electricity (MWH) 81,136 94,285 156,555 156,967 Global Renewable Electricity (%) 100 100 100 100 Scope 1 Emissions (Metric Tons C02-e) 51,487 30,883 62,815 59,388 Scope 2 Emissions, Market-Based (Metrics Tons C02-e) 565 141 0 0 Scope 2 Emissions, Location-Based (Metric Tons C02-e) 26,594 28,585 42,291 41,411 Scope 2 Emissions, Target-Based (Metric Tons C02-e) 26,317 29,356 31,937 23,622 Scope 1 + Scope 2 (Market-Based) Emissions (Metric Tons C02-e) 52,052 31,024 62,815 59,388 Scope 1 + Scope 2 (Target-Based) Emissions (Metric Tons C02-e) 77,804 60,239 94,752 83,010 Scope 3 Emissions (Metric Tons C02-e) 1,192,659 1,020,541 1,466,497 1,086,833 Total GHG Emissions: Scope 1 + Scope 2 (Market-Based) + 1,244,711 1,051,564 1,529,312 1,146,221 Scope 3 (Metric Tons C02-e) Carbon Credits (36,506) (54,107) (1,529,312) (1,146,221) Netflix ESG Report 2022 2
 Netflix 2022 ESG Report Page 63 Page 65