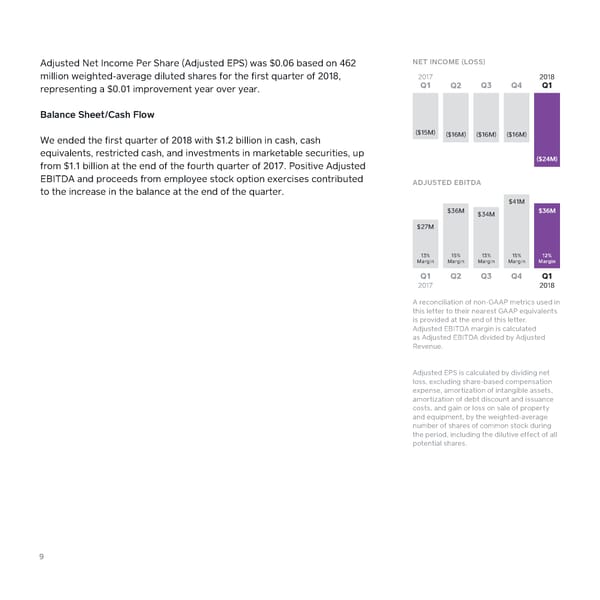
Adjusted Net Income Per Share (Adjusted EPS) was $0.06 based on 462 NET INCOME (LOSS) million weighted-average diluted shares for the first quarter of 2018, 2017 2018 representing a $0.01 improvement year over year. Q1 Q2 Q3 Q4 Q1 Balance Sheet/Cash Flow ($15M) ($16M) ($16M) ($16M) We ended the first quarter of 2018 with $1.2 billion in cash, cash equivalents, restricted cash, and investments in marketable securities, up ($24M) from $1.1 billion at the end of the fourth quarter of 2017. Positive Adjusted EBITDA and proceeds from employee stock option exercises contributed ADJUSTED EBITDA to the increase in the balance at the end of the quarter. $41M $36M $34M $36M $27M 13% 15% 13% 15% 12% Margin Margin Margin Margin Margin Q1 Q2 Q3 Q4 Q1 2017 2018 A reconciliation of non-GAAP metrics used in this letter to their nearest GAAP equivalents is provided at the end of this letter. Adjusted EBITDA margin is calculated as Adjusted EBITDA divided by Adjusted Revenue. Adjusted EPS is calculated by dividing net loss, excluding share-based compensation expense, amortization of intangible assets, amortization of debt discount and issuance costs, and gain or loss on sale of property and equipment, by the weighted-average number of shares of common stock during the period, including the dilutive effect of all potential shares. 9
 2018 Q1 Shareholder Letter — Square Page 8 Page 10