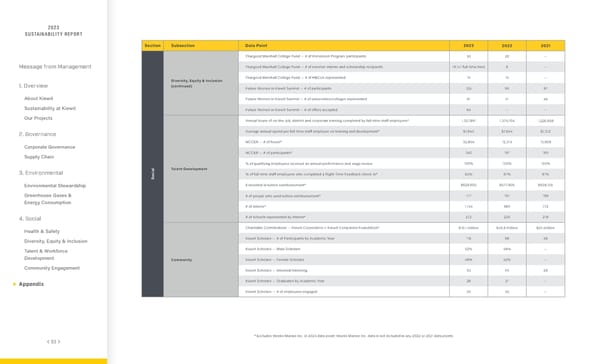
20220233 SSUUSTSTAAINAINABBILITILITY REY REPPORORTT Section Subsection Data Point 2023 2022 2021 Thurgood Marshall College Fund — # of Immersion Program participants 30 20 — Message from Management Thurgood Marshall College Fund — # of summer interns and scholarship recipients 19 (+1 full-time hire) 8 — Diversity, Equity & Inclusion Thurgood Marshall College Fund — # of HBCUs represented 10 10 — 1. Overview (continued) Future Women in Kiewit Summit — # of participants 105 95 97 About Kiewit Future Women in Kiewit Summit — # of universities/colleges represented 61 41 46 Sustainability at Kiewit Future Women in Kiewit Summit — # of offers accepted 64 — — Our Projects Annual hours of on-the-job, district and corporate training completed by full-time staff employees* 1,327,881 1,375,704 1,228,608 2. Governance Average annual spend per full-time staff employee on training and development* $7,845 $7,644 $7,512 NCCER — # of hours* 32,805 12,315 15,609 Corporate Governance Supply Chain NCCER — # of participants* 342 197 165 l % of qualifying employees received an annual performance and wage review 100% 100% 100% a Talent Development 3. Environmental ci % of full-time staff employees who completed a Right-Time Feedback check-in* 63% 67% 61% o S Environmental Stewardship $ invested in tuition reimbursement* $629,600 $577,900 $638,100 Greenhouse Gases & # of people who used tuition reimbursement* 177 167 199 Energy Consumption # of interns* 1,154 980 772 4. Social # of schools represented by interns* 272 220 218 Health & Safety Charitable Contributions — Kiewit Corporation + Kiewit Companies Foundation* $10.1 million $40.8 million $25 million Diversity, Equity & Inclusion Kiewit Scholars — # of Participants by Academic Year 116 96 48 Talent & Workforce Kiewit Scholars — Male Scholars 52% 48% — Development Community Kiewit Scholars — Female Scholars 48% 52% — Community Engagement Kiewit Scholars — Interned/Interning 55 45 28 Appendix Kiewit Scholars — Graduates by Academic Year 28 21 — Kiewit Scholars — # of employees engaged 30 42 — * Excludes Weeks Marine Inc. in 2023 data point; Weeks Marine Inc. data is not included in any 2022 or 2021 data points 93939393
 2023 | Sustainability Report Page 92 Page 94