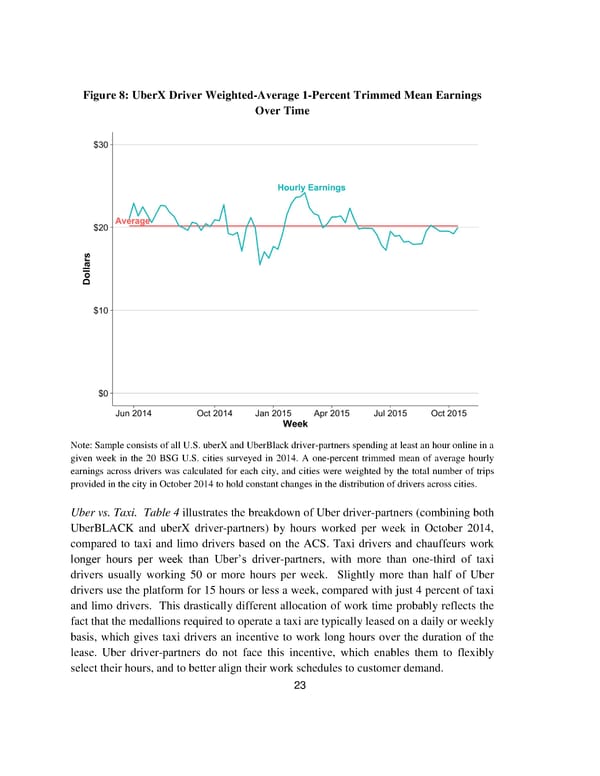
Figure 8: UberX Driver Weighted-Average 1-Percent Trimmed Mean Earnings Over Time Note: Sample consists of all U.S. uberX and UberBlack driver-partners spending at least an hour online in a given week in the 20 BSG U.S. cities surveyed in 2014. A one-percent trimmed mean of average hourly earnings across drivers was calculated for each city, and cities were weighted by the total number of trips provided in the city in October 2014 to hold constant changes in the distribution of drivers across cities. Uber vs. Taxi. Table 4 illustrates the breakdown of Uber driver-partners (combining both UberBLACK and uberX driver-partners) by hours worked per week in October 2014, compared to taxi and limo drivers based on the ACS. Taxi drivers and chauffeurs work longer hours per week than Uber’s driver-partners, with more than one-third of taxi drivers usually working 50 or more hours per week. Slightly more than half of Uber drivers use the platform for 15 hours or less a week, compared with just 4 percent of taxi and limo drivers. This drastically different allocation of work time probably reflects the fact that the medallions required to operate a taxi are typically leased on a daily or weekly basis, which gives taxi drivers an incentive to work long hours over the duration of the lease. Uber driver-partners do not face this incentive, which enables them to flexibly select their hours, and to better align their work schedules to customer demand. 23
 An Analysis Of The Labor Market For Uber’s Driver-partners In The United States Page 23 Page 25