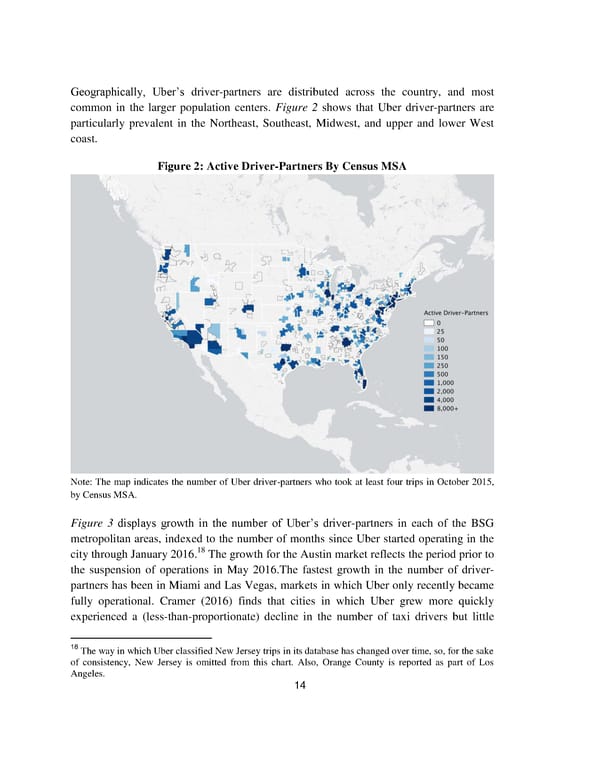
Geographically, Uber’s driver-partners are distributed across the country, and most common in the larger population centers. Figure 2 shows that Uber driver-partners are particularly prevalent in the Northeast, Southeast, Midwest, and upper and lower West coast. Figure 2: Active Driver-Partners By Census MSA Note: The map indicates the number of Uber driver-partners who took at least four trips in October 2015, by Census MSA. Figure 3 displays growth in the number of Uber’s driver-partners in each of the BSG metropolitan areas, indexed to the number of months since Uber started operating in the 18 city through January 2016. The growth for the Austin market reflects the period prior to the suspension of operations in May 2016.The fastest growth in the number of driver- partners has been in Miami and Las Vegas, markets in which Uber only recently became fully operational. Cramer (2016) finds that cities in which Uber grew more quickly experienced a (less-than-proportionate) decline in the number of taxi drivers but little 18 The way in which Uber classified New Jersey trips in its database has changed over time, so, for the sake of consistency, New Jersey is omitted from this chart. Also, Orange County is reported as part of Los Angeles. 14
 An Analysis Of The Labor Market For Uber’s Driver-partners In The United States Page 14 Page 16