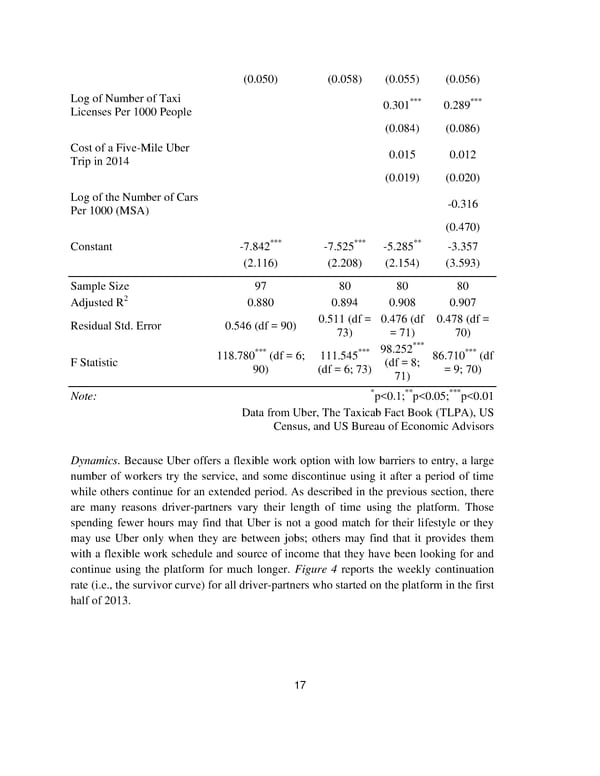
(0.050) (0.058) (0.055) (0.056) Log of Number of Taxi 0.301*** 0.289*** Licenses Per 1000 People (0.084) (0.086) Cost of a Five-Mile Uber 0.015 0.012 Trip in 2014 (0.019) (0.020) Log of the Number of Cars -0.316 Per 1000 (MSA) (0.470) Constant -7.842*** -7.525*** -5.285** -3.357 (2.116) (2.208) (2.154) (3.593) Sample Size 97 80 80 80 2 Adjusted R 0.880 0.894 0.908 0.907 Residual Std. Error 0.546 (df = 90) 0.511 (df = 0.476 (df 0.478 (df = 73) = 71) 70) *** *** 98.252*** *** F Statistic 118.780 (df = 6; 111.545 (df = 8; 86.710 (df 90) (df = 6; 73) 71) = 9; 70) * ** *** Note: p<0.1; p<0.05; p<0.01 Data from Uber, The Taxicab Fact Book (TLPA), US Census, and US Bureau of Economic Advisors Dynamics. Because Uber offers a flexible work option with low barriers to entry, a large number of workers try the service, and some discontinue using it after a period of time while others continue for an extended period. As described in the previous section, there are many reasons driver-partners vary their length of time using the platform. Those spending fewer hours may find that Uber is not a good match for their lifestyle or they may use Uber only when they are between jobs; others may find that it provides them with a flexible work schedule and source of income that they have been looking for and continue using the platform for much longer. Figure 4 reports the weekly continuation rate (i.e., the survivor curve) for all driver-partners who started on the platform in the first half of 2013. 17
 An Analysis Of The Labor Market For Uber’s Driver-partners In The United States Page 17 Page 19