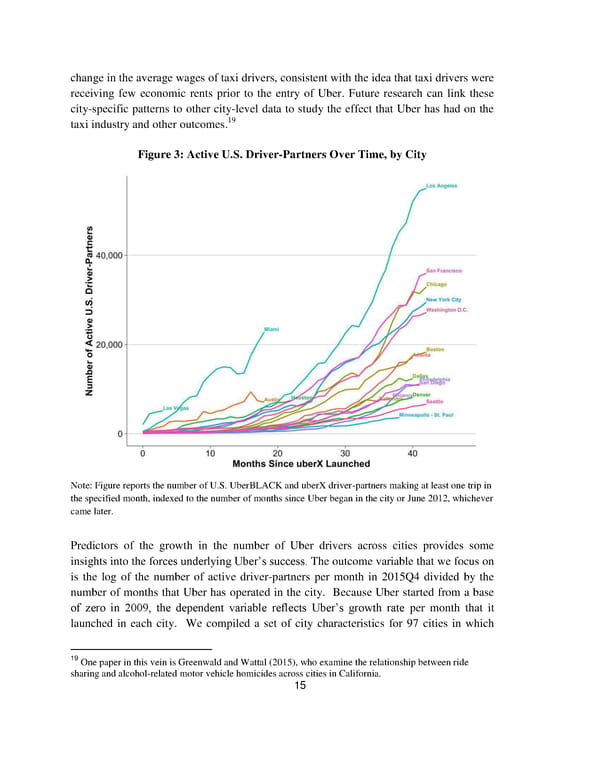
change in the average wages of taxi drivers, consistent with the idea that taxi drivers were receiving few economic rents prior to the entry of Uber. Future research can link these city-specific patterns to other city-level data to study the effect that Uber has had on the taxi industry and other outcomes.19 Figure 3: Active U.S. Driver-Partners Over Time, by City Note: Figure reports the number of U.S. UberBLACK and uberX driver-partners making at least one trip in the specified month, indexed to the number of months since Uber began in the city or June 2012, whichever came later. Predictors of the growth in the number of Uber drivers across cities provides some insights into the forces underlying Uber’s success. The outcome variable that we focus on is the log of the number of active driver-partners per month in 2015Q4 divided by the number of months that Uber has operated in the city. Because Uber started from a base of zero in 2009, the dependent variable reflects Uber’s growth rate per month that it launched in each city. We compiled a set of city characteristics for 97 cities in which 19 One paper in this vein is Greenwald and Wattal (2015), who examine the relationship between ride sharing and alcohol-related motor vehicle homicides across cities in California. 15
 An Analysis Of The Labor Market For Uber’s Driver-partners In The United States Page 15 Page 17