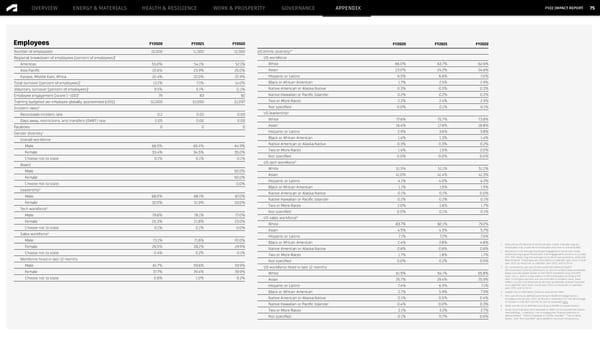
FY22 IMPACT REPORT OVERVIEW ENERGY & MATERIALS HEALTH & RESILIENCE WORK & PROSPERITY GOVERNANCE APPENDIX 75 Employees FY2020 FY2021 FY2022 FY2020 FY2021 FY2022 1 1,7 Number of employees 10,200 11,500 12,300 US ethnic diversity Regional breakdown of employees [percent of employees]1 US workforce Americas 55.0% 54.1% 52.1% White 66.0% 63.7% 62.6% Asia Pacific 22.6% 23.9% 25.0% Asian 23.0% 24.2% 24.6% Europe, Middle East, Africa 22.4% 22.0% 22.9% Hispanic or Latino 6.5% 6.6% 7.0% Total turnover [percent of employees]1 13.1% 7.1% 14.0% Black or African American 1.7% 2.5% 2.9% 1 Native American or Alaska Native 0.3% 0.3% 0.3% Voluntary turnover [percent of employees] 9.5% 5.1% 11.1% 2 Native Hawaiian or Pacific Islander 0.2% 0.2% 0.2% Employee engagement [score 1–100] 79 83 82 Training budgeted per employee globally, approximate [US$] $1,000 $1,050 $1,097 Two or More Races 2.2% 2.4% 2.3% 3 Not specified 0.0% 0.1% 0.1% Incident rates 4 Recordable incident rate 0.2 0.02 0.00 US leadership Days away, restrictions, and transfers (DART) rate 0.05 0.00 0.00 White 77.6% 75.7% 73.8% Fatalities 0 0 0 Asian 16.4% 17.6% 18.8% Gender diversity1 Hispanic or Latino 2.9% 3.6% 3.8% Overall workforce Black or African American 1.4% 1.3% 1.4% Male 66.5% 65.4% 64.9% Native American or Alaska Native 0.3% 0.3% 0.2% Female 33.4% 34.5% 35.0% Two or More Races 1.4% 1.5% 2.0% Choose not to state 0.1% 0.1% 0.1% Not specified 0.0% 0.0% 0.0% 5 Board US tech workforce Male 50.0% White 51.5% 51.1% 51.2% Female 50.0% Asian 41.0% 41.4% 41.3% Choose not to state 0.0% Hispanic or Latino 4.1% 4.0% 4.2% 4 Black or African American 1.1% 1.5% 1.5% Leadership Native American or Alaska Native 0.1% 0.1% 0.0% Male 68.0% 68.1% 67.0% Native Hawaiian or Pacific Islander 0.2% 0.2% 0.1% Female 32.0% 31.9% 33.0% Two or More Races 2.0% 1.6% 1.7% 5 Tech workforce Not specified 0.0% 0.1% 0.1% Male 79.6% 78.1% 77.0% 6 Female 20.3% 21.8% 23.0% US sales workforce Choose not to state 0.1% 0.1% 0.0% White 83.7% 82.1% 79.2% Asian 4.5% 4.3% 5.7% 6 Sales workforce Hispanic or Latino 7.1% 7.2% 7.5% Male 73.1% 71.6% 70.0% Black or African American 2.4% 3.8% 4.8% Female 26.5% 28.2% 29.9% 1 Data are as of the end of the fiscal year noted. Includes regular Native American or Alaska Native 0.6% 0.6% 0.6% employees only. Fixed-term employees and interns are excluded. Choose not to state 0.4% 0.2% 0.1% 2 Represents the average employee engagement score over three Two or More Races 1.7% 1.8% 1.7% pulses during a given fiscal year. The engagement score is on a scale Workforce hired in last 12 months of 1–100 measuring the average outcome of two questions, eSat and Not specified 0.0% 0.2% 0.5% Recommend. These data are reported on a calendar year basis. Fiscal Male 61.7% 59.6% 59.9% year 2022 corresponds to calendar year 2021, and so forth. US workforce hired in last 12 months 3 For consistency, we use US Occupational Safety & Health Female 37.7% 39.4% 39.9% Administration (OSHA) definitions to record incident data worldwide. White 61.5% 54.1% 55.8% Rates are calculated based on the OSHA standard using 200,000 Choose not to state 0.6% 1.0% 0.2% labor hours, which is equivalent to 100 employees working a full Asian 25.7% 29.4% 25.9% year. Contingent workers are not included in incident rates. Data reflect injuries and illnesses at all sites worldwide, and are reported Hispanic or Latino 7.4% 6.3% 7.1% on a calendar year basis. Fiscal year 2022 corresponds to calendar year 2021, and so forth. Black or African American 2.7% 5.9% 7.9% 4 Leadership as defined as Director and above roles. Native American or Alaska Native 0.1% 0.5% 0.4% 5 Tech workforce as defined according to Radford categorization. Autodesk’s fiscal year 2022 verification statement for the percentage Native Hawaiian or Pacific Islander 0.4% 0.0% 0.3% of women in the tech workforce can be accessed here. 6 Sales workforce as defined according to Radford categorization. Two or More Races 2.1% 3.2% 2.7% 7 Some historical data were restated to reflect an enhanced calculation methodology. In addition, the subcategories “Native American or Not specified 0.1% 0.7% 0.0% Alaska Native,” “Native Hawaiian or Pacific Islander,” “Two or More Races,” and “Not specified” were added to improve transparency.
 Autodesk Impact Report | Generative AI Page 74 Page 76