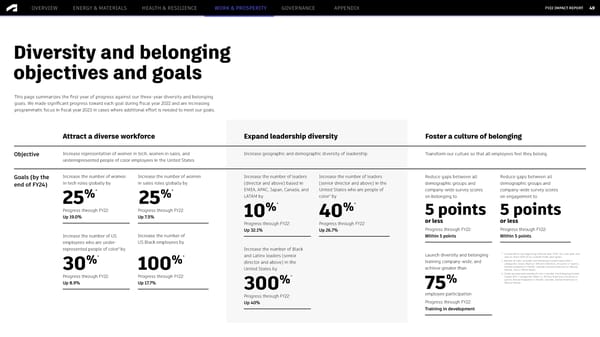
FY22 IMPACT REPORT OVERVIEW ENERGY & MATERIALS HEALTH & RESILIENCE WORK & PROSPERITY GOVERNANCE APPENDIX 49 Diversity and belonging objectives and goals This page summarizes the first year of progress against our three-year diversity and belonging goals. We made significant progress toward each goal during fiscal year 2022 and are increasing programmatic focus in fiscal year 2023 in cases where additional effort is needed to meet our goals. Attract a diverse workforce Expand leadership diversity Foster a culture of belonging Objective Increase representation of women in tech, women in sales, and Increase geographic and demographic diversity of leadership Transform our culture so that all employees feel they belong underrepresented people of color employees in the United States Goals (by the Increase the number of women Increase the number of women Increase the number of leaders Increase the number of leaders Reduce gaps between all Reduce gaps between all end of FY24) in tech roles globally by in sales roles globally by (director and above) based in (senior director and above) in the demographic groups and demographic groups and * * EMEA, APAC, Japan, Canada, and United States who are people of company-wide survey scores company-wide survey scores % % † 25 25 LATAM by color by on belonging to on engagement to * * Progress through FY22: Progress through FY22: % % 5 points 5 points Up 19.0% Up 7.5% 10 40 or less or less Progress through FY22: Progress through FY22: Up 32.1% Up 26.7% Progress through FY22: Progress through FY22: Increase the number of US Increase the number of Within 5 points Within 5 points employees who are under- US Black employees by ‡ represented people of color by Increase the number of Black and Latinx leaders (senior Launch diversity and belonging * Compared to the beginning of fiscal year 2022. Our one-year aim * * was to reach 20% of our overall three-year goals. % % director and above) in the training company-wide, and † People of color includes the following United States EE0-1 categories: Asian, Black or African American, Hispanic or Latino, 30 100 United States by achieve greater than Native Hawaiian or Pacific Islander, Native American or Alaska Native, Two or More Races. ‡ Underrepresented people of color includes the following United Progress through FY22: Progress through FY22: * States EE0-1 categories: Black or African American, Hispanic or % % Latino, Native Hawaiian or Pacific Islander, Native American or Up 8.9% Up 17.7% 300 75 Alaska Native. Progress through FY22: employee participation Up 40% Progress through FY22: Training in development
 Autodesk Impact Report | Generative AI Page 48 Page 50